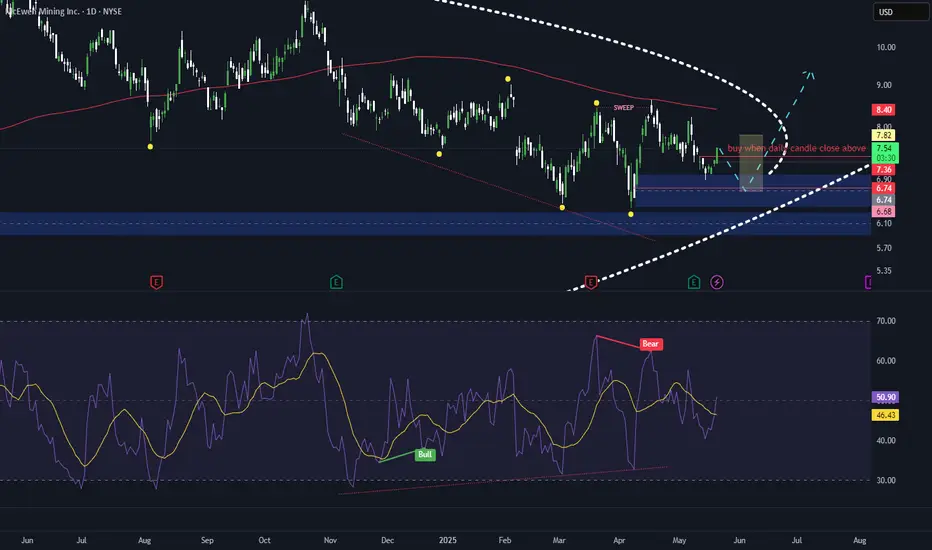
bullishentry now is possible but with no SL as I might buy again from 6.3$
it is confirmed for me but it may need more liquidity to grap from lower levels
Not a financial advice
You thoughts are welcome
Next report date
—
Report period
—
EPS estimate
—
Revenue estimate
—
−11.77 MXN
−910.93 M MXN
3.64 B MXN
45.15 M
About McEwen Inc.
Sector
Industry
CEO
Robert Ross McEwen
Website
Headquarters
Toronto
Founded
1979
FIGI
BBG002S0Q7Y3
McEwen, Inc. engages in the the production and exploration of precious and base metals, It operates through the following geographical segments: USA, Canada, Mexico, MSC , and Los Azules. The USA segment includes the Gold Bar mine and exploration properties. The Canada segment consists of the Fox Complex, which includes the Black Fox gold mine, the Froome underground mine development and the Grey Fox and Stock advanced-stage projects, the Stock mill, and other gold exploration properties located in Timmins, Ontario, Canada. The Mexico segment comprises of El Gallo Project and the advanced-stage Fenix Project, located in Sinaloa. The MSC segment focuses in the San Jose mine, located in Argentina. The Los Azules segment operates copper exploration project located in San Juan, Argentina. The company was founded on July 24, 1979 and is headquartered in Toronto, Canada.
Related stocks
Much upside for this 100k oz mining firm100k oz gold would be valued at 200 million revenue assuming aics of 50%.

Cup and Handle MUXLooks like an excellent cup and handle formation waiting on a move towards the brim of the cup. I am long at 6.45. Target is $10, then lets see how it consolidates if it reaches there and re-evaluate.

Mux Mining 15 MinMux Mining Looks Strong long term
Incredible year for Mux Mining
see the charts below.
Watch anything on youtube, its very impressive.
MUXIf Legacy Holds, then MUX is a must buy.
Be better cheaper. And it will be. But whats your timeframe. Post your trading timeframe and I'll post you a personal marker up view of MUX
Mux is copper mine, not yet dug, with Orders for EV multinationals for all their Copper Requirements for the fore

MUX targets raised for possible dip buys adding to long.Mux continues channel bound, some downside expected. This is a jewel in the crown, with EV contracts settled, and full governmental licenses already issued.
This is a no brainer.
They have literally sold every single bit of copper they find ( and eveyrthing else lol ) already, and they haven't ev
McEwan Mining - Bump and run - followed by a bigger Bump and RunCheck it out.
If you could get this 50 % to 70% off from here......lol
This is mental
www.youtube.com
Copper is it Boys. Trust Me

Starting to build positions in gold and silver minersWe just hit a major support for this stock, so I am starting to build a position. I'll take out half at the next resistance and hold the rest in case we break resistance and see an explosion in price.

time to jumbrsi divergence, increasing volume, awaiting good news, falling wedge. we can wait for a solid jump here

See all ideas
Summarizing what the indicators are suggesting.
Neutral
SellBuy
Strong sellStrong buy
Strong sellSellNeutralBuyStrong buy
Neutral
SellBuy
Strong sellStrong buy
Strong sellSellNeutralBuyStrong buy
Neutral
SellBuy
Strong sellStrong buy
Strong sellSellNeutralBuyStrong buy
An aggregate view of professional's ratings.
Neutral
SellBuy
Strong sellStrong buy
Strong sellSellNeutralBuyStrong buy
Neutral
SellBuy
Strong sellStrong buy
Strong sellSellNeutralBuyStrong buy
Neutral
SellBuy
Strong sellStrong buy
Strong sellSellNeutralBuyStrong buy
Displays a symbol's price movements over previous years to identify recurring trends.
Frequently Asked Questions
The current price of MUX is 182.50 MXN — it has decreased by −0.82% in the past 24 hours. Watch MCEWEN INC stock price performance more closely on the chart.
Depending on the exchange, the stock ticker may vary. For instance, on BMV exchange MCEWEN INC stocks are traded under the ticker MUX.
We've gathered analysts' opinions on MCEWEN INC future price: according to them, MUX price has a max estimate of 300.20 MXN and a min estimate of 257.99 MXN. Watch MUX chart and read a more detailed MCEWEN INC stock forecast: see what analysts think of MCEWEN INC and suggest that you do with its stocks.
MUX stock is 0.83% volatile and has beta coefficient of 1.10. Track MCEWEN INC stock price on the chart and check out the list of the most volatile stocks — is MCEWEN INC there?
Today MCEWEN INC has the market capitalization of 11.03 B, it has decreased by −0.92% over the last week.
Yes, you can track MCEWEN INC financials in yearly and quarterly reports right on TradingView.
MCEWEN INC is going to release the next earnings report on Aug 7, 2025. Keep track of upcoming events with our Earnings Calendar.
MUX earnings for the last quarter are −1.43 MXN per share, whereas the estimation was −2.46 MXN resulting in a 41.67% surprise. The estimated earnings for the next quarter are 2.06 MXN per share. See more details about MCEWEN INC earnings.
MCEWEN INC revenue for the last quarter amounts to 731.31 M MXN, despite the estimated figure of 731.31 M MXN. In the next quarter, revenue is expected to reach 920.11 M MXN.
MUX net income for the last quarter is −128.45 M MXN, while the quarter before that showed −171.63 M MXN of net income which accounts for 25.16% change. Track more MCEWEN INC financial stats to get the full picture.
As of Jul 13, 2025, the company has 424 employees. See our rating of the largest employees — is MCEWEN INC on this list?
EBITDA measures a company's operating performance, its growth signifies an improvement in the efficiency of a company. MCEWEN INC EBITDA is 449.45 M MXN, and current EBITDA margin is 11.64%. See more stats in MCEWEN INC financial statements.
Like other stocks, MUX shares are traded on stock exchanges, e.g. Nasdaq, Nyse, Euronext, and the easiest way to buy them is through an online stock broker. To do this, you need to open an account and follow a broker's procedures, then start trading. You can trade MCEWEN INC stock right from TradingView charts — choose your broker and connect to your account.
Investing in stocks requires a comprehensive research: you should carefully study all the available data, e.g. company's financials, related news, and its technical analysis. So MCEWEN INC technincal analysis shows the sell today, and its 1 week rating is sell. Since market conditions are prone to changes, it's worth looking a bit further into the future — according to the 1 month rating MCEWEN INC stock shows the neutral signal. See more of MCEWEN INC technicals for a more comprehensive analysis.
If you're still not sure, try looking for inspiration in our curated watchlists.
If you're still not sure, try looking for inspiration in our curated watchlists.