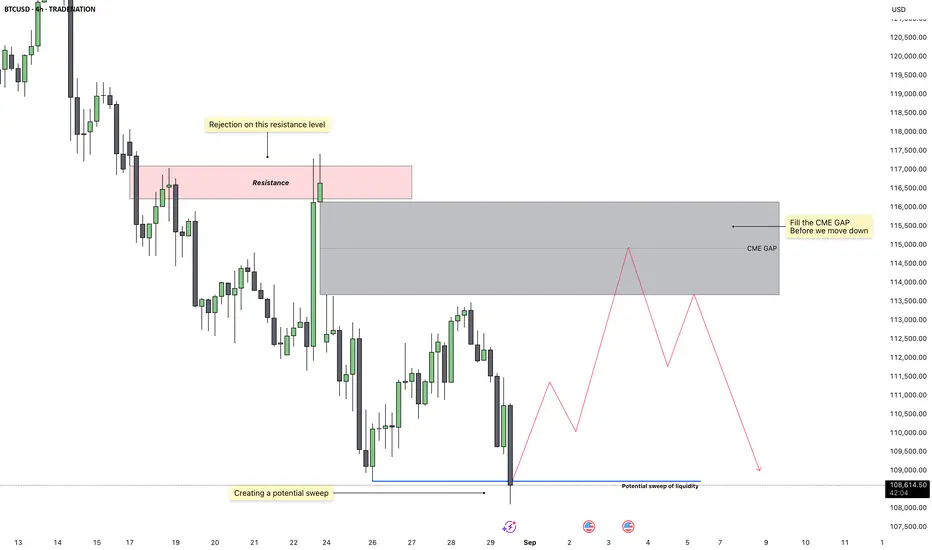
Bitcoin – Next Week Outlook: Liquidity Sweep Then Gap FillBitcoin has been trading inside a broader downtrend, with repeated rejections at key resistance levels confirming bearish pressure. Recently, we saw price reject strongly at a 4H resistance zone, which set the stage for another leg down. However, before extending lower, there is still an unfilled CM
Key facts today
Key stats
About Bitcoin
Bitcoin is the world’s most traded cryptocurrency, and represents the largest piece of the crypto market pie. It was the first digital coin and as such, remains the most famous and widely-adopted cryptocurrency in the world. It's the original gangster in whose footsteps all other coins follow. The birth of Bitcoin was the genesis of an entirely new asset class, and a huge step away from traditional, centrally controlled money. Today, many advocates believe Bitcoin will facilitate the next stage for the global financial system, although this — of course — remains to be seen.
Related pairs
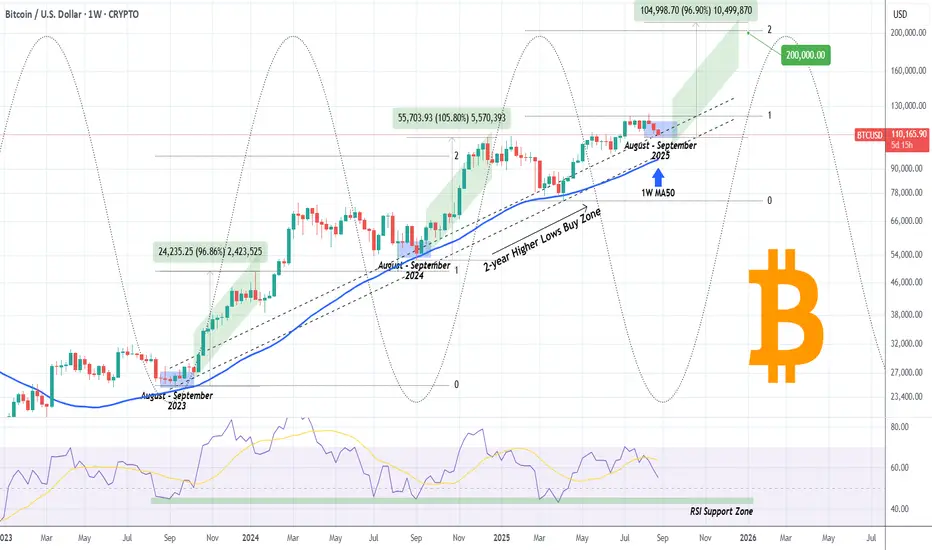
BITCOIN The August-September bottom cheat sheet!Bitcoin (BTCUSD) has just entered its 2-year Buy Zone, which is a Higher Lows belt that has priced its last 3 major bottoms and since the November 2022 Bear market bottom, has been the most optimal long-term buy entry.
A very interesting fact is that the August - September period since 2023 has bee
Bitcoin - It is bullish either way!💎Bitcoin ( CRYPTO:BTCUSD ) still remains bullish:
🔎Analysis summary:
Yes, over the past couple of days we have been seeing a quite negative correction on Bitcoin. However, looking at the higher timeframe, Bitcoin remains totally bullish. So even if Bitcoin continues with the recent correction

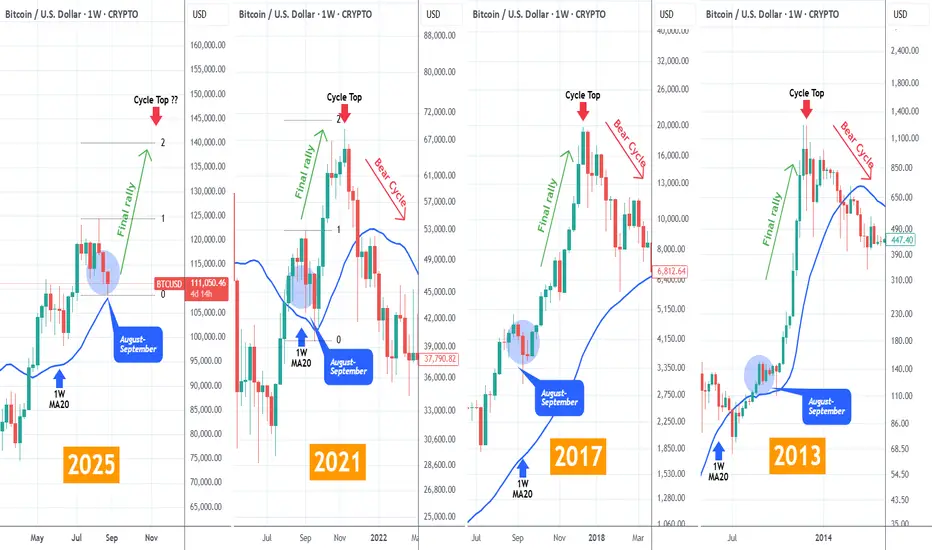
BITCOIN The key importance of the 1W MA20 that was just tested!Bitcoin (BTCUSD) almost hit early this week its 1W MA20 (blue trend-line) and so far it appears to be holding it. Whether that leads into a sustainable rebound or not it remains to be seen but this is historically a critical level for the market.
More specifically, as you can see on the charts abov
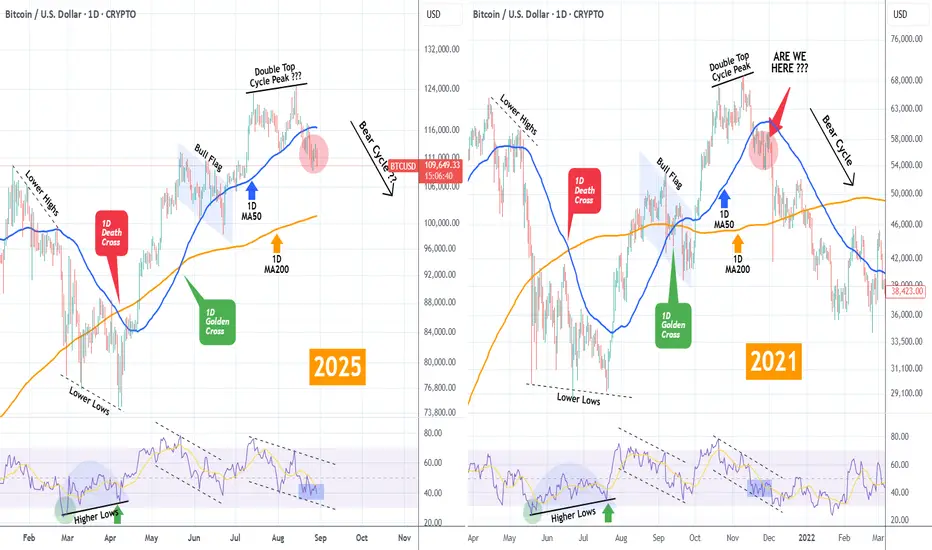
BITCOIN The NIGHTMARE BEAR CYCLE fractal that Bulls must avoid!Bitcoin (BTCUSD) has been on a strong correction lately after the August 14 All Time High (ATH) at $124500. Every High since has been sold and the price has found itself below the 1D MA50 (blue trend-line).
Whether that's alarming or not yet, this sequence draws a lot of comparisons with the patter
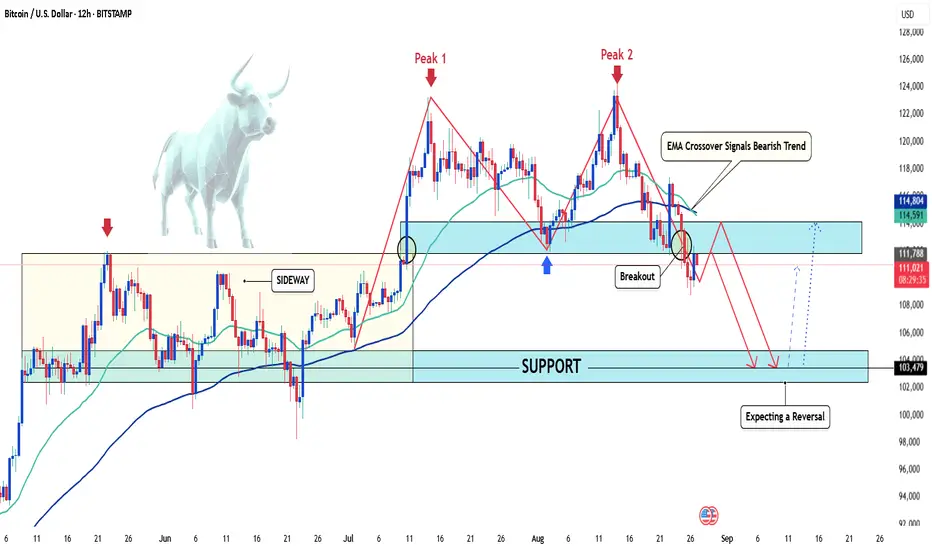
BTCUSD – Bearish Trend ? Hello traders! Let’s take a closer look at BITSTAMP:BTCUSD !
Recently, we’re seeing clear signs of a potential reversal after BTCUSD formed a double top pattern, and the EMA 34 and EMA 89 have crossed each other.
Breaking the support level around the previous key zone has strengthened the beari
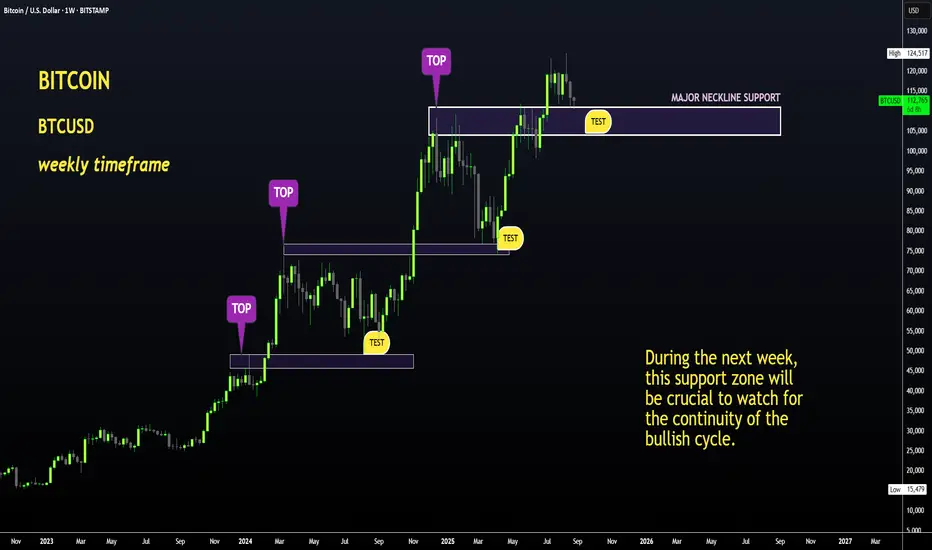
BTC in Trouble if THIS Support Breaks !Hello BTC Watchers
The previous update on Bitcoin was on how we may expect the altcoin market to play out during the next few weeks. (Find it here):
Now, if we look at Bitcoin in the weekly timeframe, the price is trading right on top of a KEY support zone. Here, we can either see a dip - marki
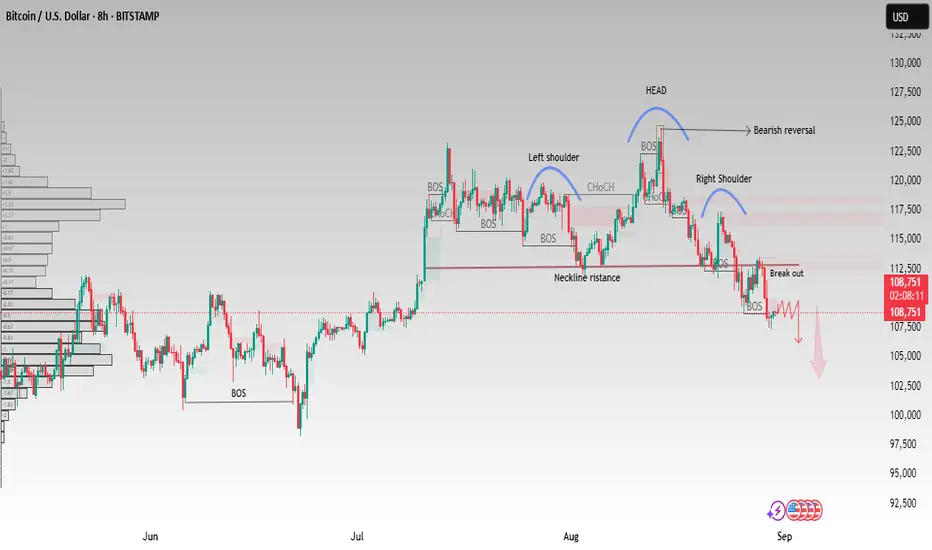
BTCUSD–Head & Shoulders Confirms Bearish Reversal | 8H AnalysisBitcoin (BTCUSD) has formed a clear Head & Shoulders pattern on the 8H timeframe, signaling a potential bearish reversal.
Pattern Structure:
Left Shoulder ✅
Head ✅
Right Shoulder ✅
Neckline break confirms weakness 📉
Key Levels:
Neckline resistance around 112,500
Current price hovering near 1
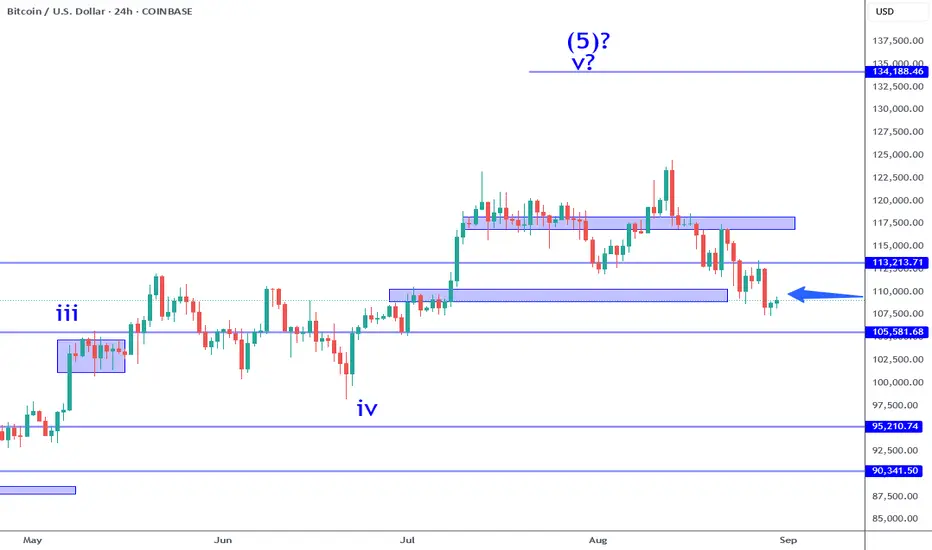
Bitcoin: Wave 4 Overlap Changes Expectations.Bitcoin has compromised the 108K area overlap which refers to the wave 1/wave 4 overlap rule for the broader wave 5 impulse that I have been measuring for months. While this can be very subjective, this fact prompts me to adjust my expectations in regards to trend structure, along with risk manageme
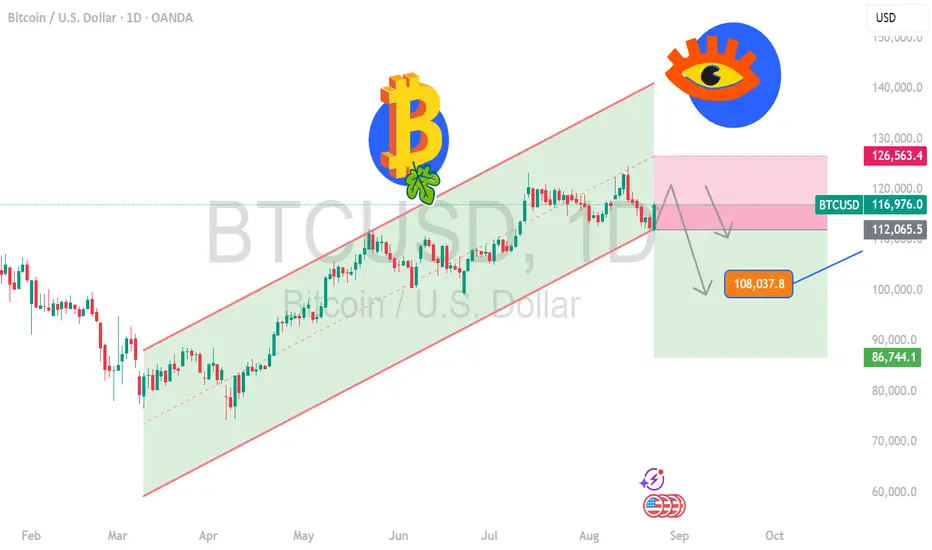
BTCUSD Short Opportunity, Bears Take Control BTCUSD is currently trading around 116,980, facing strong rejection near the 117,200–117,500 resistance zone. The recent price action suggests that sellers are gaining control as bullish momentum fades. A sustained move below 116,800 could trigger further downside pressure, pushing Bitcoin toward 11
See all ideas
Displays a symbol's price movements over previous years to identify recurring trends.
Curated watchlists where BTCUSD is featured.

Gen 1 crypto: from little acorns grow
15 No. of Symbols

Proof of Work: Embracing the crunch
27 No. of Symbols
See all sparks
Discover funds exposed to Bitcoin and find another way to access the coin.
Frequently Asked Questions
Bitcoin (BTC) reached its highest price on Aug 14, 2025 — it amounted to 124,554.23 USD. Find more insights on the BTC price chart.
See the list of crypto gainers and choose what best fits your strategy.
See the list of crypto gainers and choose what best fits your strategy.
Bitcoin (BTC) reached the lowest price of 1,862.75 USD on Jul 17, 2017. View more Bitcoin dynamics on the price chart.
See the list of crypto losers to find unexpected opportunities.
See the list of crypto losers to find unexpected opportunities.
The safest choice when buying BTC is to go to a well-known crypto exchange. Some of the popular names are Binance, Coinbase, Kraken. But you'll have to find a reliable broker and create an account first. You can trade BTC right from TradingView charts — just choose a broker and connect to your account.
You can discuss Bitcoin (BTC) with other users in our public chats, Minds or in the comments to Ideas.