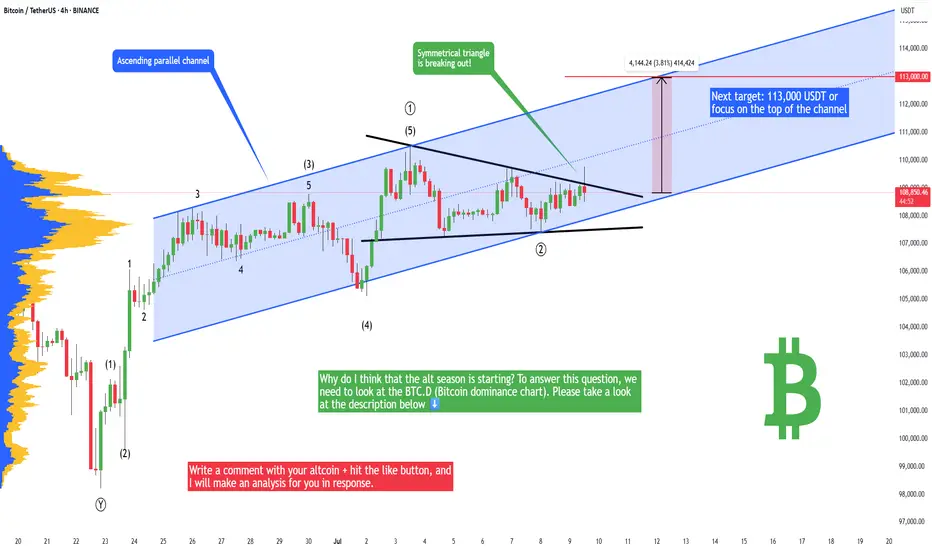
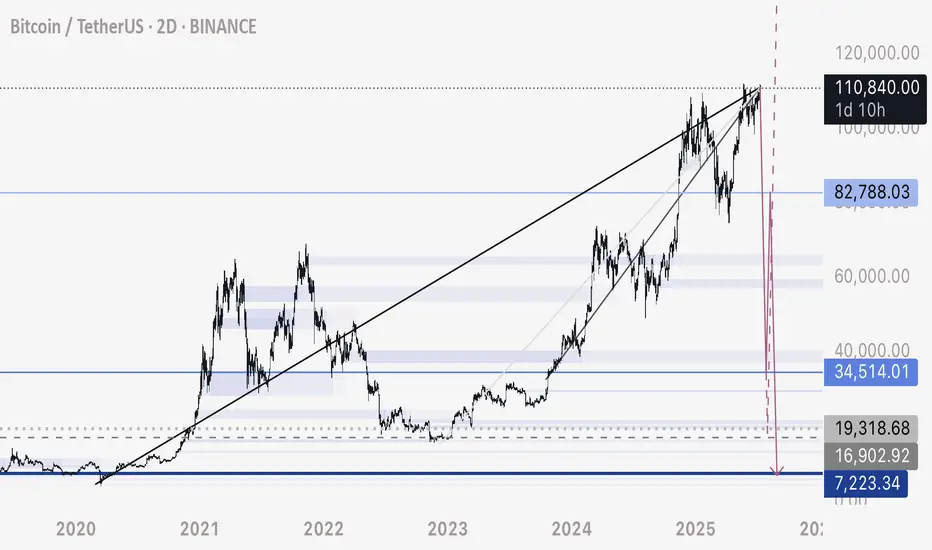
Bitcoin - Ready for a new all time high! + ALT SEASON startingBitcoin is breaking out of the symmetrical triangle and showing major signs of strength, so we can expect to hit a new all-time high in the short term! Bitcoin was struggling in the past weeks compared to the stock market, but this should end!
Why do I think that the alt season is starting? To answer this question, we need to look at the BTC.D (Bitcoin dominance chart). if BTC.D goes up, that means money is flowing out of altcoins to Bitcoin, and when BTC.D goes down, that means money is flowing from Bitcoin to altcoins. And we want BTC.D to go up! So what is the chart telling us?
First of all, this is not exactly BTC.D on TradingView, but this is BTCDOMUSDT.P. I think this chart may give us a better outlook on the dominance at the moment. So what we can see here is that the long-term trendline is breaking down, that's a pretty rare event.
That's definitely great news! Time to buy some altcoins and prepare for a bullish altcoin season. I would say forget about Bitcoin and a 5% profit; let's buy some altcoins, and I want you to tell me in the comment section, what altcoin do you believe in?
Write a comment with your altcoin + hit the like button, and I will make an analysis for you in response. Trading is not hard if you have a good coach! This is not a trade setup, as there is no stop-loss or profit target. I share my trades privately. Thank you, and I wish you successful trades! Trading tip at the end: Learn to bear losses - A trader needs to accept the losses to maintain their emotional stability. Losses are a crucial internal part of trading that helps traders to learn how to grow from their losses. Traders learn from losses and implement required changes in their strategies for better results in future trades.
BTCUSDT.P trade ideas
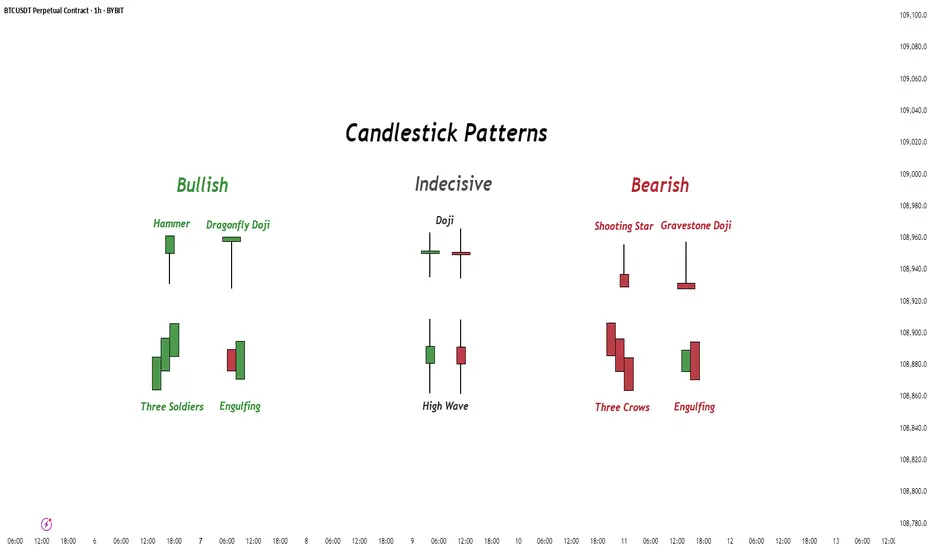
Candlestick Patterns - How to read them like a ProOverview
Candlestick charts serve as a cornerstone in technical analysis, presenting price activity in a visually digestible format. By examining how prices move over a given timeframe, traders gain key insights into potential market direction, sentiment shifts, and trend strength.
Mastering candlestick interpretation is essential for identifying bullish or bearish sentiment, as well as for spotting possible trend reversals or continuations. Still, candlesticks alone don’t paint the full picture—using them without broader context increases the risk of false signals.
---
What You'll Learn
What are candlestick charts?
Common bearish candlestick patterns
Common bullish candlestick patterns
How to apply candlestick analysis in trading
---
What is a Candlestick Chart?
A candlestick provides a snapshot of an asset’s price behavior during a specific time interval, whether it's one minute, one hour, or one day. This format allows traders to quickly assess how the price has moved within that period.
Each candle reveals four price points:
* Open – the price at the beginning of the interval
* Close – the price at the end of the interval
* High – the highest price reached
* Low – the lowest price during that time
Anatomy of a Candlestick:
* Body: The thick section between the open and close. A green (or white) body means the close was higher than the open (bullish), while red (or black) means the opposite (bearish).
* Wicks (or Shadows): Thin lines extending from the body to indicate the high and low.
* Upper wick: Marks the highest traded price
* Lower wick: Marks the lowest traded price
---
Bearish Candlestick Patterns
Understanding bearish candlestick patterns helps traders identify moments when buying momentum might be running out—setting the stage for a potential downward shift.
Evening Star
A three-candle formation that signals a shift from buying pressure to selling dominance. It starts with a strong bullish candle, followed by a small-bodied candle of indecision, and concludes with a large bearish candle that cuts deep into the first. This pattern often appears at the end of an uptrend.
Bearish Engulfing
This setup includes a small bullish candle followed by a large bearish candle that completely swallows the previous one. It indicates that sellers have seized control, potentially marking the beginning of a downward trend.
Shooting Star
With a small real body near the low and a long upper wick, this pattern reflects strong early buying that is ultimately rejected by the close—suggesting fading bullish momentum.
Gravestone Doji
This candle opens, closes, and hits its low all around the same price, leaving a long upper wick. It suggests that bulls pushed higher during the session but were overpowered by bears by the close.
Three Crows
Three consecutive bearish candles, all approximately the same size. These indicate that a sell off is coming soon.
---
Bullish Candlestick Patterns
Bullish patterns can alert traders to possible reversals after a downtrend or strengthen conviction during an uptrend.
Morning Star
This three-candle formation marks a potential turning point from bearish to bullish. It begins with a strong bearish candle, followed by a smaller candle showing indecision, and ends with a large bullish candle breaking upward—signaling buying strength is returning.
Bullish Engulfing
This two-candle pattern begins with a bearish candle, then a larger bullish candle that completely envelops the previous body. It reflects a sharp transition in sentiment, suggesting renewed buying pressure.
Dragonfly Doji
A single candle where the open, close, and high are all very close, with a long lower wick. It shows sellers pushed prices lower but buyers stepped in and brought them back up—an early sign of possible reversal.
Hammer
A classic bullish reversal signal that features a small real body near the top and a long lower shadow. It indicates a battle where sellers initially dominated, but buyers managed to close near the open price.
Three soldiers
Three consecutive bullish candles, all approximately the same size. These indicate that a big buy is coming soon.
---
Trading with Candlestick Patterns
Candlestick patterns become more meaningful when they align with major chart areas—such as previous support or resistance, trendlines, or retracement zones. A bullish signal at a support level can hint that the downward pressure is fading, while a bearish pattern at resistance may warn of an upcoming decline.
To increase the reliability of your trades, combine candlestick patterns with other forms of technical analysis:
* Support & Resistance Zones: These are price levels where the market has historically reacted. Candlestick patterns forming near these zones have stronger potential implications.
* Fibonacci Levels : These help identify likely retracement areas. When a candlestick pattern forms near a key Fibonacci level like 61.8%, it adds strength to a potential reversal setup.
* Liquidity Areas: Clusters of orders (buy or sell) tend to create strong reactions. When patterns appear in these zones, they often precede more decisive moves.
* Technical Indicators : RSI, MACD, Moving Averages, and Stochastic RSI can provide confirmation. For instance, a bullish reversal pattern that appears when RSI is oversold strengthens the signal.
💡 Tip: Don’t rush into trades based on one candlestick alone. Always wait for the next candle or price confirmation (e.g., a break of a previous high/low) to validate your signal.
---
Thanks for Reading!
✨ If you found this helpful, show some love by liking or commenting!
🔔 Don’t forget to follow for more technical breakdowns and trading insights coming soon!
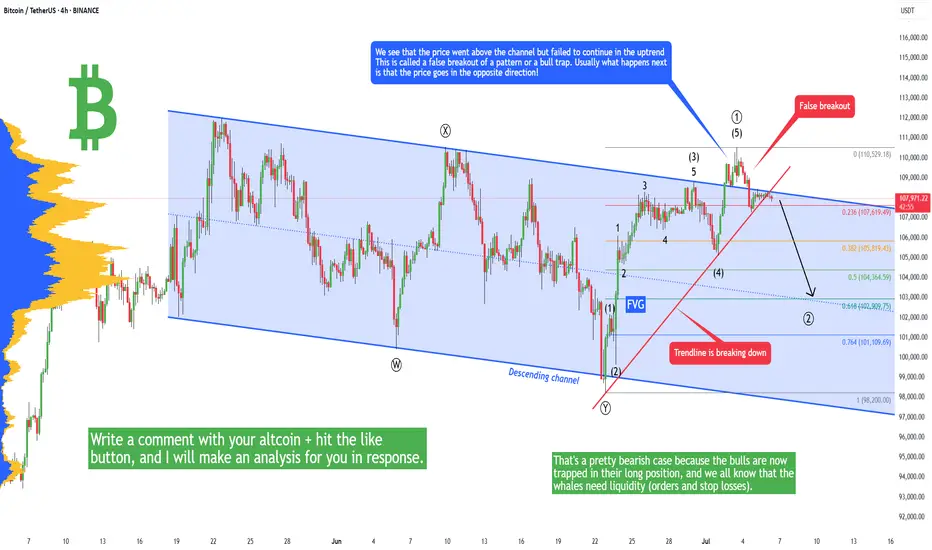
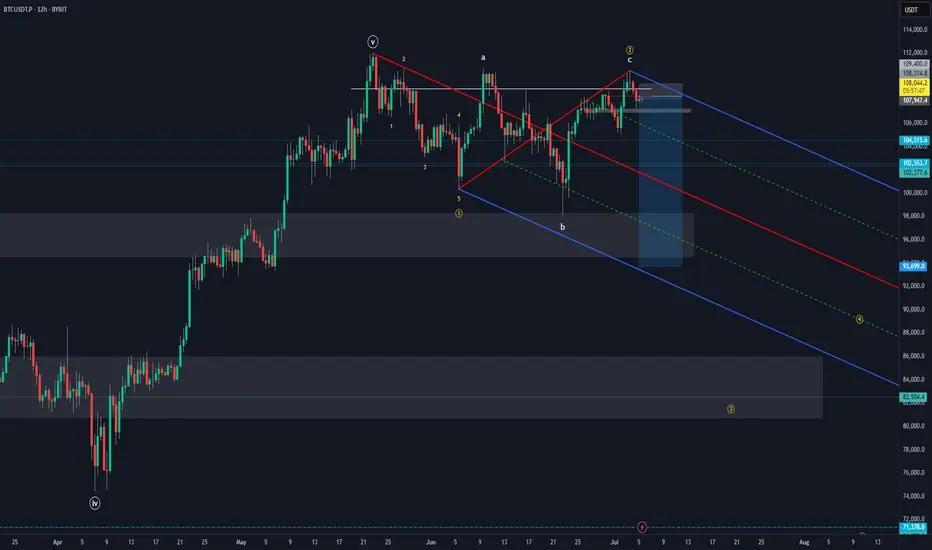
Bitcoin - Bull Trap! Don't get caught (Buy at 102,909 USD)Bitcoin has been pumping last week, but the problem is that the bulls made a false breakout above the bullish flag / descending channel. We see that the price went above the channel but failed to continue in the uptrend. This is called a false breakout of a pattern or a bull trap. Usually what happens next is that the price goes in the opposite direction!
That's a pretty bearish case because the bulls are now trapped in their long position, and we all know that the whales need liquidity (orders and stop losses). That's why they will be ready to push the price to the downside, potentially to the 0.618 Fibonacci retracement of the previous impulse wave.
From the Elliott Wave perspective, this is a bullish setup, but we have just finished an impulse wave (1), so we should wait for an ABC correction (wave (2)) to form before entering a long position. I expect Bitcoin to hit 102,909 USD in the short term because there is the 0.618 FIBO. Also, we have an unfilled FVG between 102k - 104k on the daily chart. Usually these kinds of gaps tend to be filled sooner rather than later; that's why I expect a pullback.
Write a comment with your altcoin + hit the like button, and I will make an analysis for you in response. Trading is not hard if you have a good coach! This is not a trade setup, as there is no stop-loss or profit target. I share my trades privately. Thank you, and I wish you successful trades! Trading tip at the end: Organize Personal Life - Professional traders have great management of their personal life as they keep their trading activities from personal concerns. Balancing your personal life is essential to achieve harmony as well as improve your performance in trading.
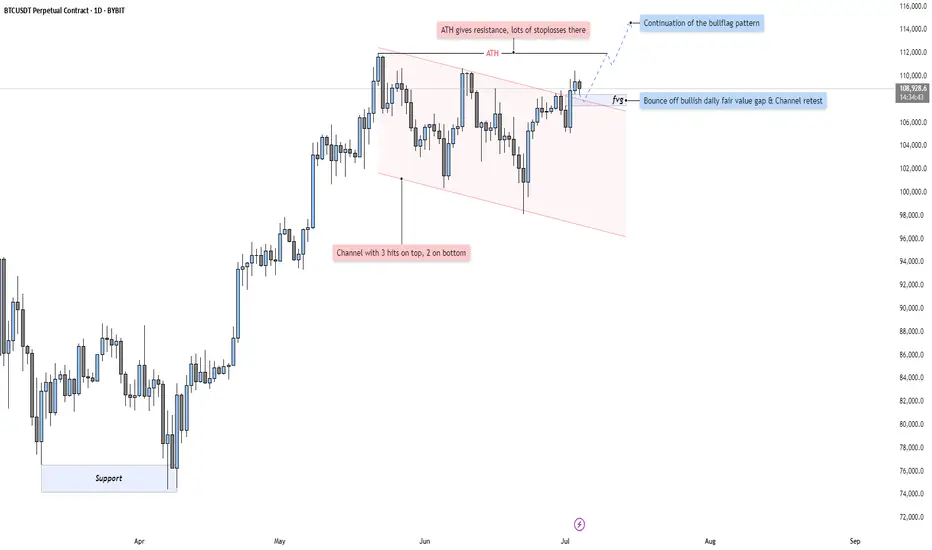
BTC - Bullflag Pattern points to new ATHMarket Context
Bitcoin has been trading within a well-defined descending channel for several weeks now, respecting both upper and lower boundaries with precision (3 touches on the top, 2 on the bottom). This structure suggests an orderly pullback after a strong impulsive leg to the upside in Q2. As price compresses within this flag-like pattern, market participants are watching closely for signs of breakout or breakdown.
Bullish Fair Value Gap Reaction
Recently, price dipped into a Daily Fair Value Gap (FVG) and bounced strongly — a key bullish signal indicating that demand stepped in at the inefficiency. The FVG also aligns with a retest of the channel’s resistance-turned-support, further validating the bounce. This confluence zone acts as a springboard for potential continuation.
Channel Breakout & Liquidity Above ATH
Price has now broken above the channel structure, shifting the market narrative from consolidation to potential expansion. The breakout zone is located just beneath the All-Time High (ATH) — an area that’s likely loaded with stop orders and breakout buys. A sweep or clean break above the ATH would not only invalidate the prior bearish structure but also trigger a fresh wave of bullish momentum.
Bull Flag Continuation Potential
Structurally, this chart presents a classic bull flag breakout. After a strong impulsive leg up and a controlled consolidation phase, we now see bullish continuation potential toward the 112,000–114,000 region. If the ATH gets breached and reclaimed, it could become strong support in the next leg higher.
Final Thoughts
This is the type of setup that blends both technical precision and market psychology — structure, liquidity, and momentum all coming together. Whether you're already long or watching for confirmation, this move could set the tone for Bitcoin’s next major rally.
If you found this analysis helpful or thought-provoking, please give it a like! And let me know in the comments — do you see this as a true breakout or a trap in disguise?
Just Two Months Left: Navigating Bitcoin and Global ChangesGreetings to everyone reading these lines! Today, I want to share with you not just an analysis, but my personal reflections and feelings about the current situation in the financial and cryptocurrency markets, especially regarding Bitcoin.
Many of you already know that I have always been a firm believer in Bitcoin’s market cycles. Right now, we are approaching the final stage of another such cycle-the distribution phase. The past few months have seen considerable turmoil: Trump's election, escalating conflicts between India and Pakistan, Israel and Iran, rising tensions between Russia and Ukraine, and not to mention China’s increasingly assertive geopolitical moves. I can't shake the feeling that the world stands on the threshold of something significant, perhaps serious. I sincerely hope I'm mistaken, but signs of a global conflict or a substantial reset in the world order are undeniably in the air.
History shows us that after major upheavals and wars, the world undergoes profound changes. It seems we are nearing such a pivotal moment within the next couple of months. For a long time, I've highlighted September 2025 as a critical point in the current market cycle, and now everything confirms this scenario.
In these unstable times, participants in the financial markets face both risks and tremendous opportunities. The distinguishing factor today is the rapid integration of artificial intelligence into all areas of life. I firmly believe that if you don't begin incorporating AI into your activities now, you risk being left behind. Personally, I'm actively integrating artificial intelligence into my professional processes and everyday life, as I see it as inevitable in our near future.
Regarding the cryptocurrency market, I'll be frank: the past couple of years have significantly changed it and even somewhat disappointed me. Liquidity has become diluted, and the market has clearly become seasonal, with brief periods of explosive growth followed by long downturns. This has led me to return to trading Forex and gold, where the market is more transparent and predictable.
Many crypto projects that seemed promising in 2017 are now nearly forgotten and stagnating. Think of Dash, EOS, Litecoin, ZCash, and others-they haven't disappeared entirely, but they no longer play significant roles in the market. The battle for user attention has become overly aggressive, and competition has devolved into chasing short-lived hype. Nevertheless, there are exceptions, such as Solana—a project that achieved success thanks to a fortunate combination of factors. Yet such projects remain exceedingly rare.
Today, I see the most promising and powerful trend as the tokenization of real-world assets (RWA). It doesn’t matter so much which blockchain will be used-the concept itself has already proven effective. While this journey won't be easy, the involvement of giants like BlackRock indicates the trend is sustainable and promising in the long run.
Overall, I am confident that financial markets and digital currencies will continue to evolve and grow. However, in about two months, I plan to adopt a bearish stance. Unfortunately, there are few signs of a quick global economic recovery. The world needs significant restructuring and changes-new rules and agreements are inevitable, and the coming year promises many notable events.
Ask yourself: Are you ready for these changes? Are you prepared to adapt to new conditions, technologies, and realities? Personally, I'm fully ready, which is why I remain active in the market, continuing to share my thoughts, assist, and engage with each of you. If you have questions, ideas, or proposals for collaboration, I am always open to dialogue and eager for any interaction.
I sincerely thank each of you for your support, comments, and attention to my posts. I stay here because I believe in the enormous opportunities available even in the most uncertain times. We have an exciting journey ahead, and I invite you to travel it together with me.
Wishing you success, profits, and above all, peace and kindness on our planet. The time of change is already here. Let’s meet it together.
Warm regards,
Your EXCAVO.
Are You Really Analyzing Or Just Defending your imagination? You might think you're analyzing every time you open a chart.
But what if you're just looking for reasons to justify a bad trade?
Real analysis is data-based. Justification is emotion-based.
Let’s figure out if you're really trading smart or just lying to yourself.
Hello✌
Spend 3 minutes ⏰ reading this educational material.
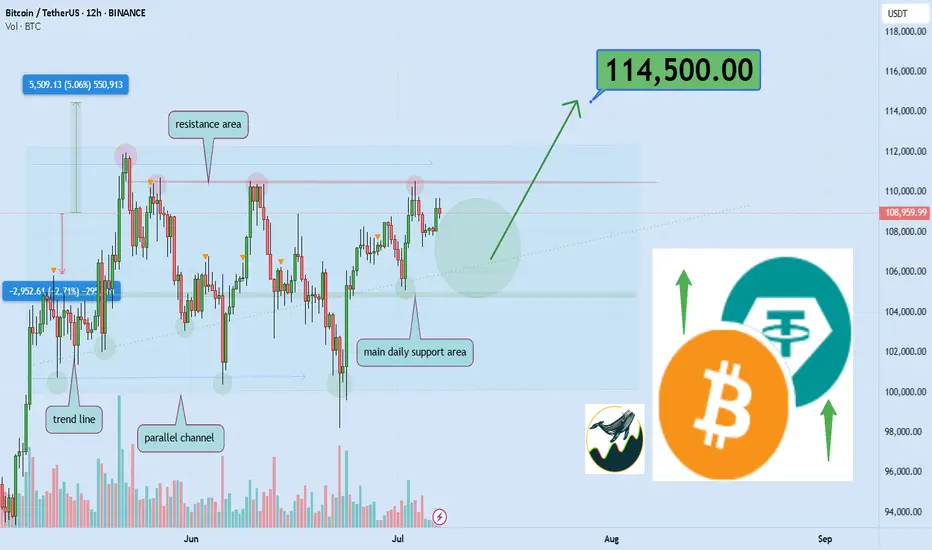
🎯 Analytical Insight on Bitcoin:
BINANCE:BTCUSDT is currently testing a strong resistance near the upper boundary of its parallel channel. A breakout to the upside looks likely soon. From this level, I expect at least a 5% gain, with a main target around $114,500. 📈🚀
Now , let's dive into the educational section,
🎯 Analysis or Mental Justification?
Many traders, once they’re in a position, stop looking for truth and start looking for confirmation.
Instead of reading what the chart actually says, they twist every line and indicator to make it look like their trade still makes sense even when it doesn’t.
🛠 TradingView Tools That Kill Self-Deception
TradingView is way more than just a place to slap on some EMAs and MACDs. If used right, it can literally stop you from fooling yourself:
Replay Tool – Use this to backtest without future data bias. It trains your brain to analyze based only on the present moment.
Multi-Timeframe Layouts – View your idea across multiple timeframes. Confirmation bias collapses fast when you see the same chart from different angles.
Volume Profile – This shows where real trading happens, not where you wish it would happen.
Community Scripts & Public Indicators – Looking at someone else's logic helps you catch your own blind spots.
Idea Journal & Posts – Publish your analysis and compare it with what actually happened. You’ll quickly see how often emotion was driving your trade.
😵💫 What Does Justification Even Look Like?
It’s when you’re deep in the red but instead of managing your loss, you draw a new trendline… or add a reversed Fibonacci… or tell yourself, “It’s just a correction.”
That’s not analysis. That’s emotional defense.
💡 Know the Real Difference
Analysis = data-driven, emotion-free.
Justification = emotion-driven, data-twisted.
🔂 Why Do You Keep Making the Same Mistake?
Because your brain loves to feel right even when it's wrong.
Instead of accepting reality, it tries to bend it.
So you dig for signals to support your bad position, not question it.
🧠 The Psychology Behind the Trap
What you’re feeling is cognitive dissonance. Two thoughts fighting in your head:
“This position is failing.”
“I don’t want to be wrong.”
So your brain builds fake reasons to stay in it. Welcome to the mental loop that kills portfolios.
🎯 How To Break the Cycle
Write down why you’re entering any trade before you open it.
Only trade what you can explain, not what you hope.
Decide your stop-loss level before you enter.
If you’re “hoping” for something to turn around, it probably won’t.
🪞Be Brutally Honest With Yourself
The real question isn’t “Can you analyze?”
It’s “Can you admit you were wrong when it matters?”
Every losing trade you hold onto out of ego is a reminder that you chose comfort over skill.
⚠️ What Makes a Pro Trader?
A pro doesn’t just win trades. They cut losses fast.
They don’t “marry” a position just because they drew a trendline.
They survive by respecting truth, not bending it.
🧪 Train Your Brain To See Reality
To break the habit of self-justification, you need to rewire your analysis process. Here's how:
Before analyzing a chart, review your previous trade honestly.
Ask: What made me enter? Strategy or emotion?
Replay the chart with TradingView’s tool. If you didn’t know the future, would you still take that trade?
Answer those questions and you'll start separating real analysis from self-defense.
👁 Look at the Chart Without Bias
If you’re holding a position while analyzing, you’re probably just looking for evidence to stay in.
Try this instead: Pick a timeframe where you have no position, and do a clean analysis.
No hope. No fear. No money on the line.
That’s when real analysis happens.
🔚 Final Note
Real analysis hurts because it forces you to face mistakes. But it's also the path to real consistency.
Next time you open a chart, ask yourself:
“Am I seeking the truth or just a reason to hold on?”
One moment of honesty can change your entire trading journey.
✨ Need a little love!
We put so much love and time into bringing you useful content & your support truly keeps us going. don’t be shy—drop a comment below. We’d love to hear from you! 💛
Big thanks , Mad Whale 🐋
📜Please remember to do your own research before making any investment decisions. Also, don’t forget to check the disclaimer at the bottom of each post for more details.
Bitcoin - Last move down, ready for ATH?Bitcoin is showing clear signs of a corrective move within a broader bullish structure. After forming a second consecutive lower high, price is now pressing downward, creating space for a potential liquidity grab and discount entry. Despite this short-term weakness, the macro narrative remains intact. The all-time high remains untapped above, holding a thick layer of liquidity that the market has yet to collect.
Liquidity and Fib Confluence
There is a visible equal low structure around the 107.8k area. This is a prime zone for a sweep, where smart money is likely to trigger sell stops before reversing. Below that lies a Fair Value Gap (FVG) extending into the 106.5k range. Within this same zone, we also have strong Fibonacci confluence, especially at the 0.786 level near 106.2k. This makes it a high-probability entry area if price delivers a clean displacement after the sweep.
Short-Term Bearish, Long-Term Bullish
The market is respecting a trendline drawn across the lower highs, giving the impression of sustained bearish control. However, this is likely a trap. Once the sell-side liquidity below the 107.8k low is taken and the imbalance around 106.5k is filled, price will be primed for a reversal. The true target lies much higher, with the all-time high around 110.5k as the main magnet.
FVG Fill and Reversal Mechanics
This entire drop is likely engineered to fill inefficiencies left behind earlier in the move up. The FVG acts not only as a magnet, but also a springboard for the next leg. Expecting price to show a reaction at the 0.786 level, where the order flow could shift and confirm a bullish reversal, is key here. Ideally, we see a clean sweep, a displacement, and a reclaim of previous structure before targeting higher levels.
Projection and Trade Setup
The anticipated sequence is a sweep of 107.8k, fill of the gap and fib zone down to 106.2k, then a potential reversal structure forming. If that structure confirms, the next major move should aim for the untouched all-time highs, where significant liquidity remains resting. Traders should remain patient and let the sweep and confirmation unfold before entering.
Conclusion
We are watching a classic setup where engineered downside movement is likely to create the conditions for a powerful reversal. As long as price respects the 106k zone and gives a strong reaction, the path toward the ATH remains wide open.
___________________________________
Thanks for your support!
If you found this idea helpful or learned something new, drop a like 👍 and leave a comment, I’d love to hear your thoughts! 🚀
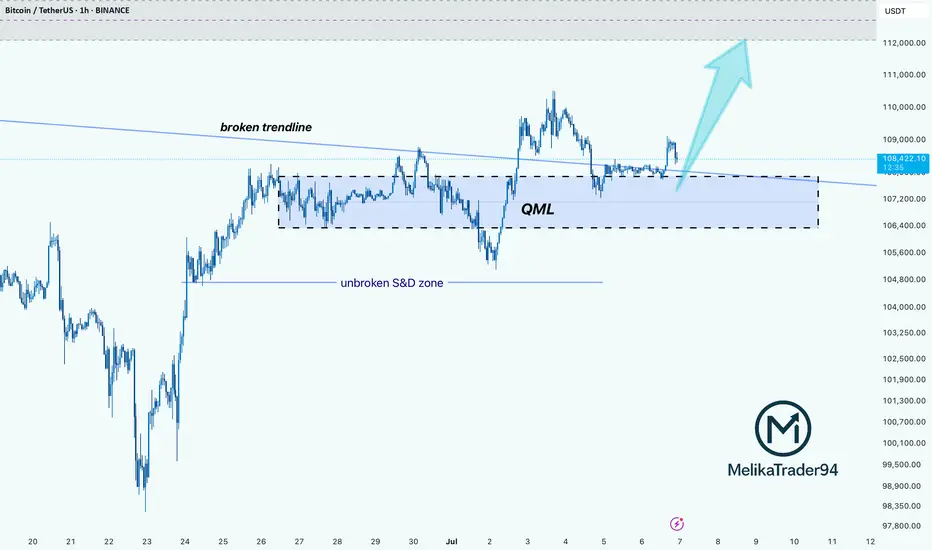
BTC: Demand Zone + QML + Trendline Flip = Perfect SETUPHello guys!
BTC is showing signs of a potential bullish reversal, forming a Quasimodo Level (QML) setup inside a valid S&D zone that remains unbroken despite multiple tests.
The downward trendline has been broken and is now acting as support, aligning perfectly with the QML and demand zone. giving us a solid confluence area.
Important to watch:
Rejection wicks and volume building at $106.6K–$107.4K zone show strong buyer interest.
If price can reclaim $109K and consolidate above, we could see a move toward $112K and higher.
Invalidation below $106.4K suggests the demand has failed, and bears may regain control.
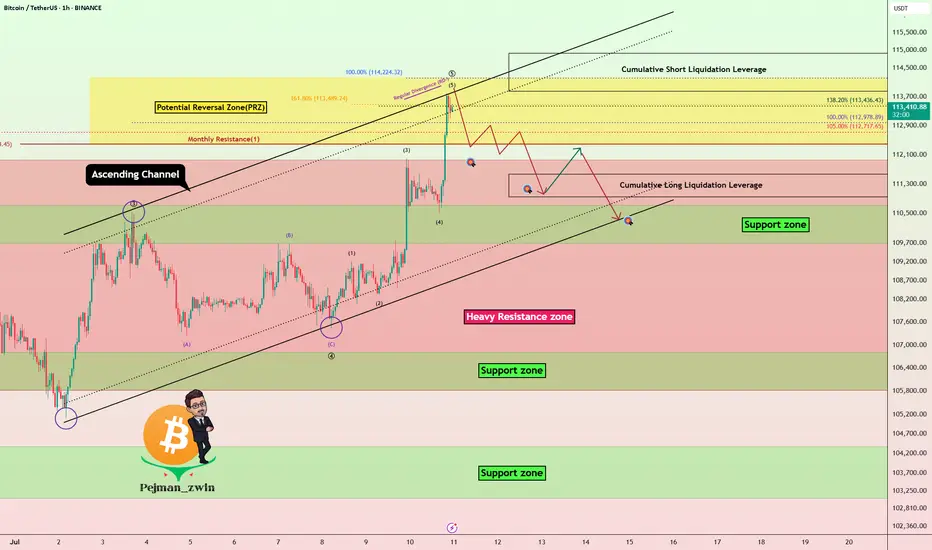
Bitcoin Hits New ATH – Is It Time to Short?Bitcoin ( BINANCE:BTCUSDT ) managed to form a new All-Time High(ATH) in the previous one-hour candles .
Do you think Bitcoin can create a new ATH in the coming hours?
Bitcoin is currently trying to break the Heavy Resistance zone($110,720-$105,820) . It has also penetrated the Potential Reversal Zone(PRZ) and Cumulative Short Liquidation Leverage($114,910-$113,850) .
In terms of Elliott wave theory , it seems that the 5 impulsive waves that Bitcoin started in the last 3 days can be completed above the ascending channel and PRZ .
Also, we can see the Regular Divergence(RD-) between Consecutive Peaks.
I expect Bitcoin to drop to at least Cumulative Long Liquidation Leverage($111,563-$110,947) . At least the price zone Bitcoin is in at the time of publishing this analysis is better for short positions , even if the Stop Loss(SL) is touched .
Note: Stop Loss(SL)= $115,023
Please respect each other's ideas and express them politely if you agree or disagree.
Bitcoin Analyze (BTCUSDT), 1-hour time frame.
Be sure to follow the updated ideas.
Do not forget to put a Stop loss for your positions (For every position you want to open).
Please follow your strategy and updates; this is just my Idea, and I will gladly see your ideas in this post.
Please do not forget the ✅' like '✅ button 🙏😊 & Share it with your friends; thanks, and Trade safe.
War news are actually good news for Crypto & GoldI Love Global Peace and hope all Wars end soon.
Here are my thoughts about Crypto when war Starts between two countries or more.
i think After wars so many reasons will help Crypto to see gain specially for Bitcoin which is the King of this market.
Some of the major Reasons in my view are:
A. Countries currency or Markets start to fall :
Usually with starting of war, we have two countries that are involved and due to negative effects of war on different Economic parameters cause weaker country or both currencies lose the power of Their currencies and it start To dump.
weak countries Bank can get hacked or worst scenario a countries currency can get 0 by the time.
most of the times Their stock markets also Face with huge losses.
B. People start to Buy more Gold or Bitcoin and ...
with things mentioned above and other reasons their People start to Buy more Crypto usually and Metals like Gold.
C. People start to migrate to other countries with their Crypto Wallets Only
Some start to leave their countries and Sell their Cars homes and ... and turn them to BTC or... and transfer their money and life to a peaceful country.
D. Spies and bribery gets more in those countries which all is done with Crypto usually
Corruption & Spy jobs and ... increases in those countries usually and the money on this Fields usually transfer Via Crypto or Gold and Silver which is harder to track.
And with these reasons which mentioned Above usually in the past all the Attention comes to Metal like Gold and the Value of it increase in Wars, but now Days Bitcoin(&Crypto Tokens) also gets more value and attention in war in my personal View and See gain in price too.
DISCLAIMER: ((trade based on your own decision))
<<press like👍 if you enjoy💚
Bitcoin is bullish in world of War or Peace Simple and easy it is like Gold but better version and limited edition one.
Both(BTC & XAU) are bullish most of the time because future is not for Paper Tokens like Dollar or Yuan or Ruble or Euro or ..
Currency of strong countries seems interesting But soon with more laws and Taxes and Rules against each other Economic which USA start it, more and more Trades and things are going to take place in Crypto where the money is still non Trackable or it is tax free.
Also in a world of War as i mentioned in previous Analysis too, more Buys and Sells are going to take place via Crypto instead of countries currency.
Some countries Now are buying and selling weapons from their enemies even and it is possible in Crypto which no one judge or find the transactions.
interesting things which can not all written here are now need Crypto more than ever.
These prices are like a joke and soon maybe with or without some stop loss hunting to the downside and kicking out buyers with leverage market of Crypto will face another Huge gain.
DISCLAIMER: ((trade based on your own decision))
<<press like👍 if you enjoy💚

Pine Screener - Powerful tool for building programmable screenerHello Everyone,
In this video, we have discussed on how to use pine screener utility of tradingview. We are making use of the indicator Divergence Screener for this demonstration and screen stocks undergoing bullish divergence.
In a nutshell, here are the steps:
🎯 Use Stock Screener to build watchlist of less than 1000 symbols
🎯 Add the indicator you want to use in the pine screener to your favorites.
🎯 Pine screener can be accessed from the tradingview screener menu or you can simply click on the link tradingview.sweetlogin.com
🎯 Add the watchlist and indicator to the pine screener and adjust the timeframe and indicator settings
🎯 Select the criteria to be scanned and press scan

Bitcoin's Consolidation Almost Over —200-220 DaysBitcoin's consolidation period before a bullish breakout tends to last some 200-220 days on average. We have four instances of this pattern since the 2022 bear market counting 2025. Let's look at those. This proves that Bitcoin is set to grow in a matter of days. Continue reading below and make sure to boost. When you reach the end of the article leave a comment with your opinion about this issue. Do you agree? Do you disagree? Can you see what I mean?
» Back in 2022 Bitcoin consolidated for 203 days before a bullish breakout.
» Back in 2023 Bitcoin consolidated for 203 days before a bullish breakout.
» Back in 2024, last year, Bitcoin consolidated for 217 days before a bullish breakout.
It really depends on where you start counting for the total days but it all adds up to 200-220 days. With 220 being the maximum.
» Currently, in 2025, Bitcoin has been consolidating for 210 days. Looking at previous patterns, this means that only a few days are left before Bitcoin produces a bullish continuation.
We also saw that once Bitcoin breaks out of a this long-term consolidation range/period/phase, it never moves back to the lows of the consolidation range. That is, Bitcoin will never trade below 80K nor 90K once it resumes growing.
I am estimating that the next jump can start as early as next week. The entire move can take months to develop. After a peak is reached, Bitcoin will then start a new consolidation phase with a bearish bias first. This bearish bias produces a low after several months yet a strong higher low compared to the previous consolidation period which is current prices. After this low, more consolidation and then a new bullish jump.
If we take into consideration a bear market, then the dynamics can be different. Bear markets only happen once every four years. Seeing how different market conditions are now, the next bear market will be interesting because it won't be anything like the bear markets of the past. Bitcoin will remain much stronger but that is an analysis for another time.
Summary
Bitcoin is going up. It is very close now. When Bitcoin breaks up and hits a new all-time high, just to continue growing, the altcoins market will explode. You've been warned.
Now you can leave your comment.
Share your opinion on the comments section below. I know you have something to say. You've been trading Cryptocurrencies for years, buying and selling, making profits so... Are you ready for the 2025 bull market?
Thank you for reading.
Namaste.
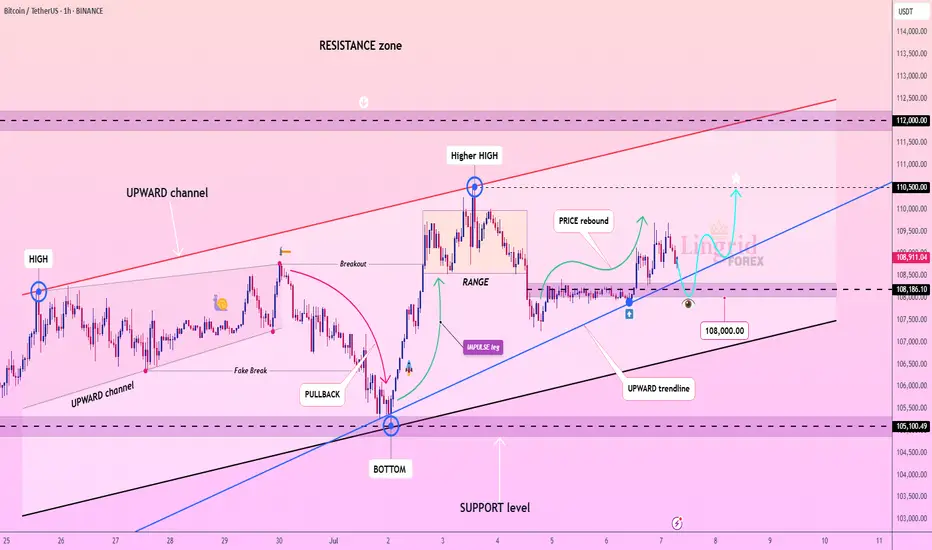
Lingrid | BTCUSDT Short-Term Bullish Momentum The price perfectly fulfilled my last idea . BINANCE:BTCUSDT continues to trade within a strong upward channel, supported by consecutive higher highs and an ascending trendline. After breaking above the range near $108,200, price briefly peaked above $110,000 before pulling back to retest the mid-support zone. Current action shows a rebound from the upward trendline, suggesting buyers are preparing for another leg up toward $110,500 and possibly the $112,000 resistance zone.
📈 Key Levels
Buy zone: around 108,000 or below
Sell trigger: break below 107,000 with close under channel
Target: 110,500 – midpoint resistance, followed by 112,000
Buy trigger: bounce from trendline and reclaim of 109,000
💡 Risks
Weak rebound could signal range re-entry and stall upside
Break below the trendline may shift bias to 105,000
Multiple rejections near 110,000 could indicate topping pressure
If this idea resonates with you or you have your own opinion, traders, hit the comments. I’m excited to read your thoughts!
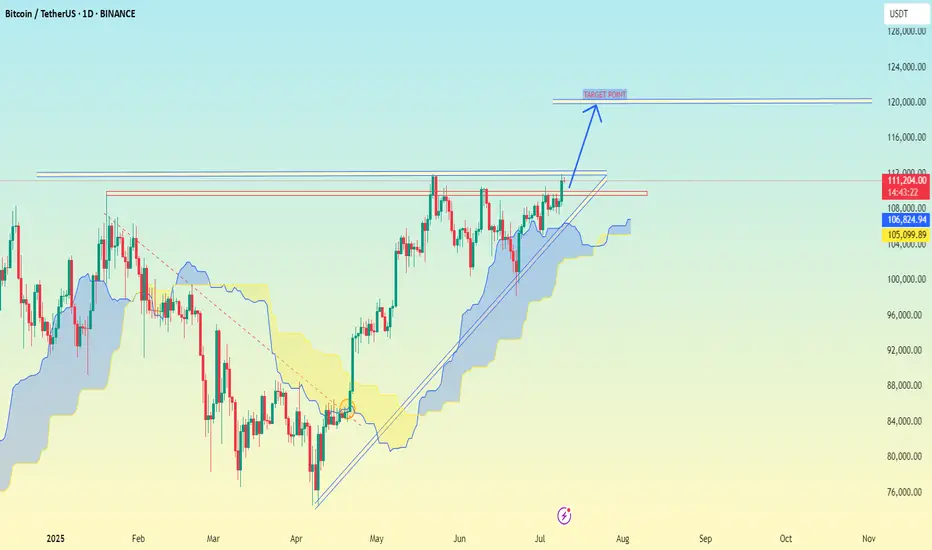
(BTC/USDT) appears to be around $120,000.(BTC/USDT) appears to be around $120,000.
Here's a quick analysis of what the chart suggests:
Timeframe: 1D (Daily)
Current price: ~$111,150
Technical Indicators:
Ascending triangle breakout is indicated.
Ichimoku Cloud shows bullish momentum (price above the cloud).
The breakout is targeting a horizontal resistance zone around $120,000.
✅ Target Zone:
Target Point (based on breakout projection): $120,000 – $124,000
This target aligns with previous resistance levels and technical breakout patterns.
Let me know if you want a more detailed technical breakdown (e.g., support/resistance zones, volume analysis, RSI, etc.).
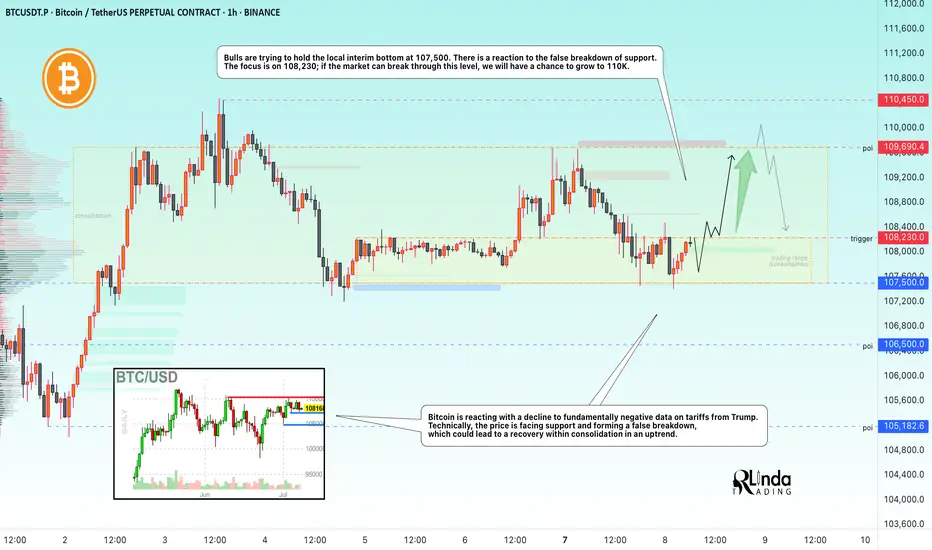
BITCOIN → Market manipulation. Chance for growth to 110KBINANCE:BTCUSDT , as part of a correction triggered by negative news from the US regarding tariffs, is testing liquidity in the support zone. There is a chance of recovery to 110K.
Bitcoin is reacting with a decline to fundamentally negative data on tariffs from Trump. Technically, the price is facing support and forming a false breakdown, the purpose of which was to capture liquidity. This could lead to a recovery within consolidation in an uptrend, but again, there are conditions...
Countries that have received notification of tariffs are responding positively to cooperation (if this trend continues, Bitcoin could receive a local bullish driver).
The market perceives this as positive, and after liquidity is captured, the price could recover to the resistance of the trading range.
Resistance levels: 108230, 109690
Support levels: 107500, 106500
Bulls are trying to hold the local interim bottom at 107500. There is a reaction to the false breakdown of support. The focus is on 108230; if the market can break through this level, we will have a chance to grow to 110K.
Best regards, R. Linda!
BTC - Last Chance to Prepare for Potential Flash Crash (Full) Expanding on my previous update - this chart is the zoomed out and expanded look at correction movement and liquidity zones to these lows.
Pathway to these levels is filled with long position stop losses - sell orders leveraged.
Orders triggered will create a cascading chain reaction and this is why we see fast movements and “stop hunts” as they are AKA.
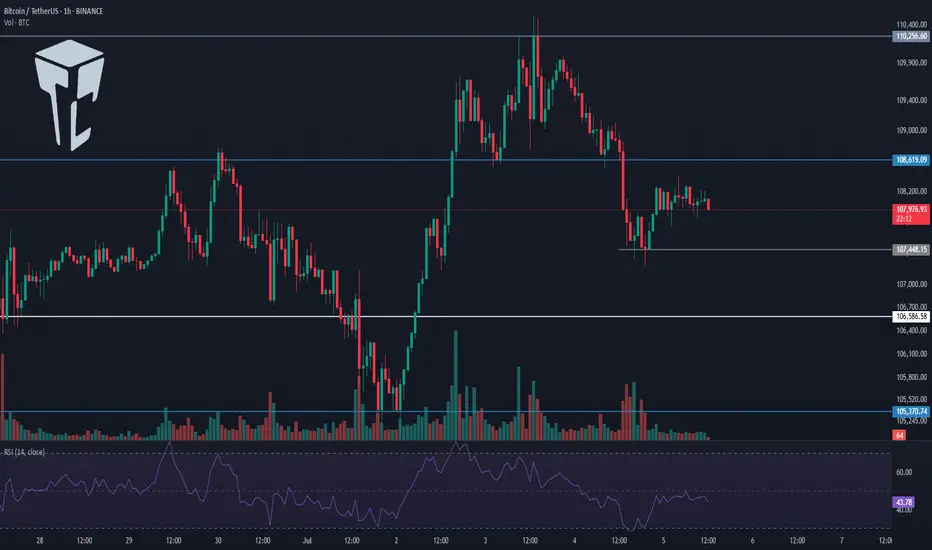
TradeCityPro | Bitcoin Daily Analysis #119👋 Welcome to TradeCity Pro!
Let’s go over the analysis of Bitcoin and the key crypto indexes. As usual, in this analysis I’m going to review the futures triggers for the New York session.
⏳ 1-Hour Timeframe
Yesterday, the price broke out of the range box between 108619 and 110256 that I had marked for you, and with the heavy selling volume that entered the market, this bearish move took place.
✔️ This move continued to the 107448 zone, and as you can see, we are now in a consolidation and rest phase, and once again the volume has dropped significantly.
✨ As I mentioned in yesterday’s analysis, I believe this low volume will persist through the weekend, and for a solid move to happen, we’ll need to wait for the new week to begin.
💥 For now, the price has room to move up to 108619 and perform a retracement. A break above the 50 zone on the RSI greatly increases the likelihood of this move.
📊 If selling volume re-enters the market and the price moves downward, the short trigger we have is the 107448 level, and breaking it could start the next bearish leg.
📈 For a long position, the price must first stabilize above 108619, and then, if we see that buying volume continues and increases, we can enter a long position. The main trigger will be 110256.
⭐ I myself won’t be opening any positions for now and will wait until the market shows some proper volume and trend before entering. If you plan to open a position based on these triggers, I suggest you take on very little risk so that in case your stop-loss is hit, you don’t lose much money.
👑 BTC.D Analysis
Let’s look at Bitcoin dominance. Yesterday, dominance touched the trendline I had marked and is still dealing with this dynamic resistance.
💫 A bottom has formed at 65.38. If this bottom is broken, we’ll get confirmation of rejection from the trendline, and dominance could have a bearish move down to 65.04.
⚡️ If the trendline is broken instead, we’ll have a new trigger at 65.52, and breaking it would confirm a bullish reversal in dominance. The main trigger will still be a break of 65.64.
📅 Total2 Analysis
Now let’s move on to Total2. This index dropped to the 1.13 zone and has now pulled back to 1.14. It seems like it’s getting ready for another downward move.
☘️ If Bitcoin dominance gets rejected from the trendline and moves down, and if Bitcoin moves upward, Total2 could make a very sharp move.
🔑 Even if Bitcoin drops, Total2 might range or even move up. For now, our short trigger is 1.13, and aside from 1.14, we don’t have any specific long trigger.
📅 USDT.D Analysis
Finally, let’s look at Tether dominance. This index made a bullish move to 4.85 after breaking 4.78 and is now in a corrective phase.
📊 If 4.85 is broken, the next bullish leg could continue up to 4.93. If a correction happens, dominance might pull back to 4.78.
❌ Disclaimer ❌
Trading futures is highly risky and dangerous. If you're not an expert, these triggers may not be suitable for you. You should first learn risk and capital management. You can also use the educational content from this channel.
Finally, these triggers reflect my personal opinions on price action, and the market may move completely against this analysis. So, do your own research before opening any position.
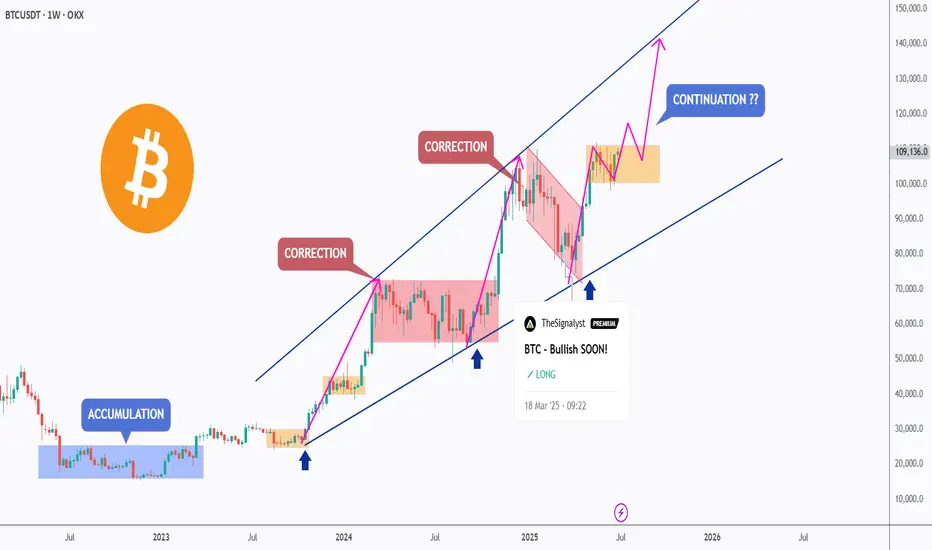
BTC – Bullish Continuation Ahead ?Bitcoin has been trading within a well-defined rising channel since mid-2023, respecting both upper and lower bounds beautifully.
After each impulsive move, we’ve seen healthy corrections followed by bullish continuations — a classic market structure in play.
🟦 Accumulation Zone: After a long accumulation phase, BTC kicked off a strong bullish cycle.
🟥 Correction Phases: Each major move was followed by a red correction zone before resuming the uptrend.
🟧 Current Phase: BTC is consolidating just below the upper channel boundary. A breakout above this zone could confirm the next bullish wave toward $140K+.
🔵 Key Observations:
Structure remains intact within the channel
Previous breakout zones now acting as support (blue arrows)
Continuation patterns are forming, signaling potential upside
🏹As long as the orange zone holds, BTC remains in a bullish structure, and a breakout would likely push us to new highs.
📍Will history repeat and BTC continue its journey toward the upper channel boundary? Let’s wait for confirmation!
💬 What’s your bias here? Are you bullish or waiting for a deeper pullback?
📚 Always follow your trading plan regarding entry, risk management, and trade management.
Good luck!
All Strategies Are Good; If Managed Properly!
~Richard Nasr
BYCUSDTHello Traders! 👋
What are your thoughts on Bitcoin?
Bitcoin has broken above its descending trendline and formed a new higher high. The price is now in a consolidation phase, taking a short pause after the breakout.
We expect the bullish trend to remain intact. After a pullback to the broken trendline and some consolidation in the support zone, Bitcoin is likely to resume its upward move toward higher levels and new all-time highs.
The overall market structure remains bullish, and this consolidation phase could present a buy-the-dip opportunity.
Is Bitcoin ready for the next leg higher, or will the pullback go deeper? Share your view below! 🤔👇
Don’t forget to like and share your thoughts in the comments! ❤️
Bitcoin Elliott WaveI am currently short Bitcoin and I think the top is in
With this post, I am expressing my thoughts on where Elliott Wave stands per my perspective
In addition, I am also tracking Pitchfork of proposed wave 1 and 2. Getting out of that default pitchfork (if we drop this hard) will likely indicate that my bearishness is correct and we are in wave 3 potentially, which indicates bear market
My short position is open both on Ethereum and Bitcoin
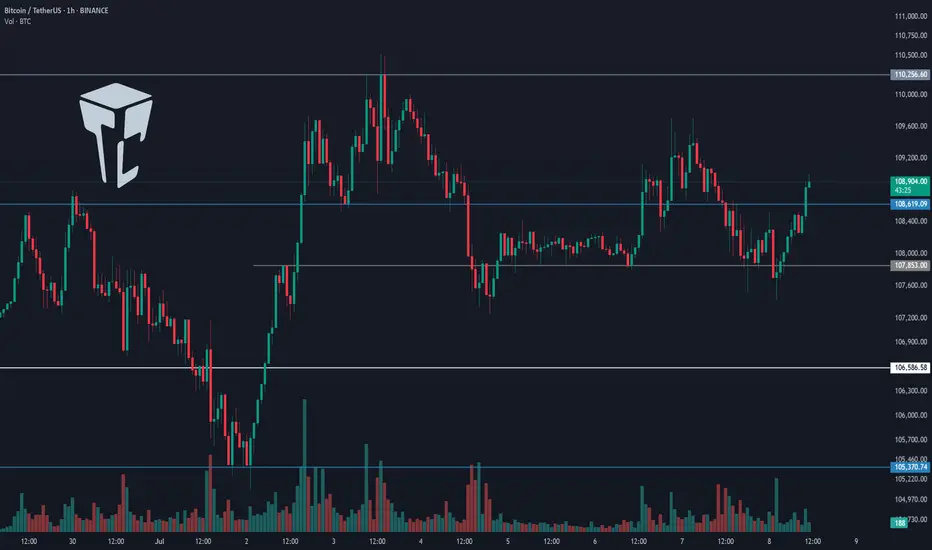
TradeCityPro | Bitcoin Daily Analysis #122👋 Welcome to TradeCity Pro!
Let’s dive into the latest analysis of Bitcoin and major crypto indicators. As usual, this update will focus on potential triggers for the New York futures session.
⌛️ 1-Hour Timeframe
On the 1-hour chart, Bitcoin is once again ranging between the 107,853 and 108,619 levels.
✔️ Last night, Bitcoin briefly faked out below the bottom of this range, so we now need to wait and see how the price reacts upon revisiting this area.
💫 I believe it’s best to hold off on entering a short position until we identify the precise location of the support line. As price retests this area, we can pinpoint the true support level.
✨ Once that level is confirmed, and if it breaks, a short position could be considered. The next support zones would be at 106,586 and 105,370.
📊 Make sure to watch the volume closely for this trade, and I strongly recommend waiting for a volume confirmation before entering.
📈 As for a long position, if 108,619 breaks to the upside, we could consider going long. The buying volume in the current upward leg is increasing, and if this trend continues, a breakout above 108,619 would make a long position reasonable.
👑 BTC.D Analysis
Moving on to Bitcoin dominance — it has once again reached its trendline and is currently being rejected from it. If this rejection continues, BTC.D could decline toward 65.04.
🔍 However, if the trendline breaks, the 65.31 level will be the bullish confirmation trigger.
📅 Total2 Analysis
Now on to the Total2 index (altcoin market cap excluding BTC), it has bounced from the 1.14 support and is moving toward 1.16.
🔑 A breakout above 1.16 would serve as a bullish confirmation for long positions, with 1.17 acting as the main breakout trigger.
📅 USDT.D Analysis
USDT dominance is also moving downward and has reached the 4.78 support zone.
💥 A breakdown below this level would confirm a bearish continuation toward the 4.72 level..
❌ Disclaimer ❌
Trading futures is highly risky and dangerous. If you're not an expert, these triggers may not be suitable for you. You should first learn risk and capital management. You can also use the educational content from this channel.
Finally, these triggers reflect my personal opinions on price action, and the market may move completely against this analysis. So, do your own research before opening any position.