BTCUSDT Perpetual Swap Contract forum
a. MACD
Current status: The histogram is decreasing, with the MACD line still above the signal line, indicating that buying power is weakening but no clear sell signal has appeared yet.
MACD Summary: Currently in a slight correction phase. If a clear bearish crossover occurs, a deeper correction will be confirmed.
---
b. RSI
Current status: RSI is around the 70 level, indicating an overbought zone, warning of a potential upcoming correction.
RSI behavior: A slight drop from the RSI peak shows weakening bullish momentum.
---
c. Price Action & Volume
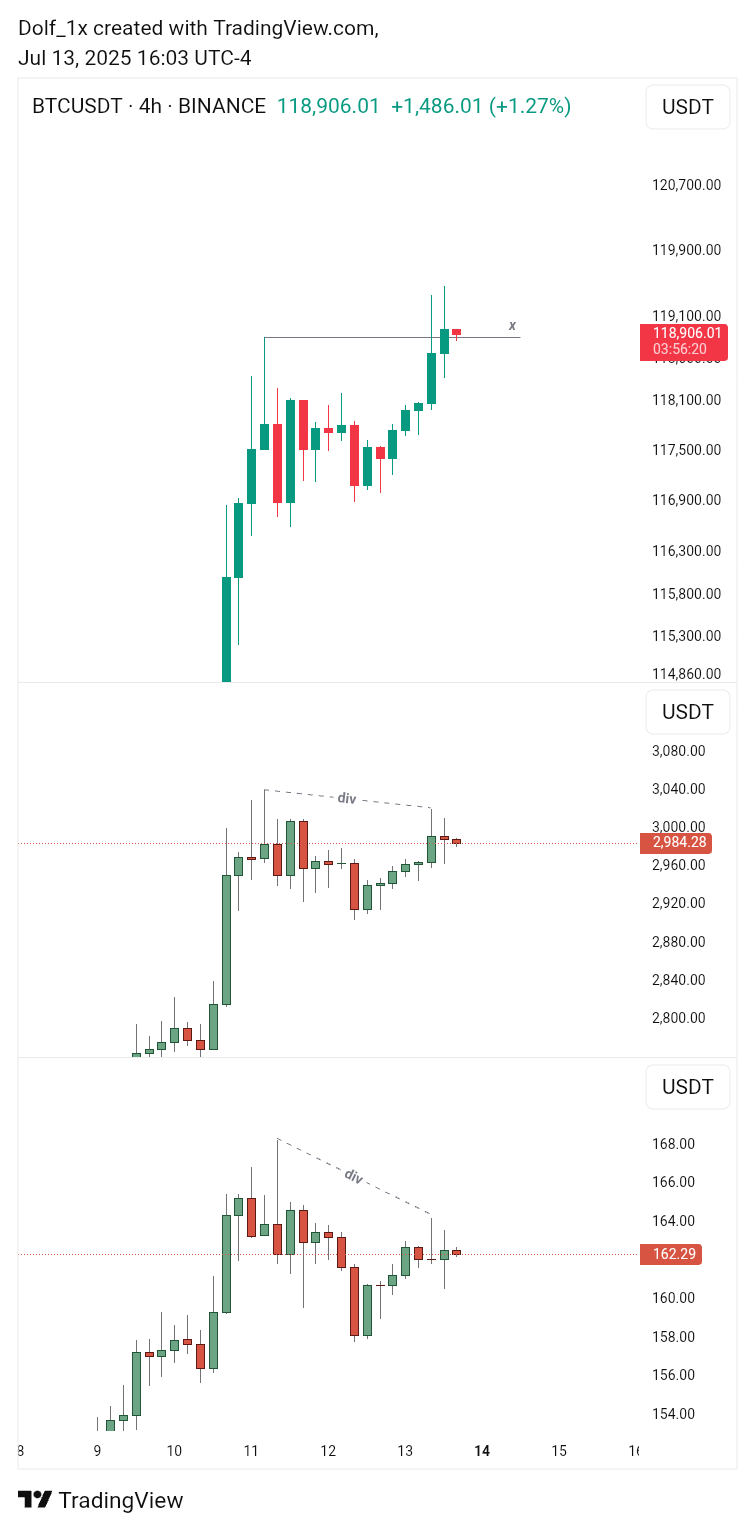
Price: Stabilized near the recent high (118,880 USDT).
Volume: The previous strong volume supported the recent upward move, but the current lower volume at higher prices signals a possible short-term correction.
---
🔹 2. Fundamental Analysis & Experts’ Opinions
a. Main fundamental drivers this week
1. US CPI data: Inflation continues to decrease, supporting BTC prices.
2. Upcoming FED decision: Expected to keep rates unchanged, providing a positive environment for risk assets like BTC.
3. Bitcoin Spot ETF news: BlackRock and Fidelity resubmitted their amended ETF applications, creating renewed optimism.
4. Global economy & Dollar index: A decline in DXY (Dollar Index) is providing psychological support for BTC.
---
b. Leading analysts’ insights
🔹 Michael Saylor (MicroStrategy)
Emphasized ongoing institutional inflows into BTC and maintains a mid-term target above 150,000 USDT.
🔹 Willy Woo (On-chain analyst)
Stated that BTC is currently in a reaccumulation phase after the recent pump, with no large-scale distribution signals seen yet.
🔹 PlanB (Stock-to-Flow model)
According to the S2F model, the current price is aligned with the long-term trend, and post-2024 halving, BTC could enter a new bullish phase.
---
🔹 3. Summary & Suggested Strategy
✅ If you are a holder: Continue holding, given the positive fundamentals and no clear MACD sell signal.
✅ If you are a short-term trader:
If a bearish MACD crossover occurs and support at 116,000 USDT breaks, plan for a correction down to the 112,000–110,000 USDT range.
If the current high (118,880) holds as support, the next targets are 122,000 and then 125,000 USDT.
tradingview.com/x/Qtuc4loE