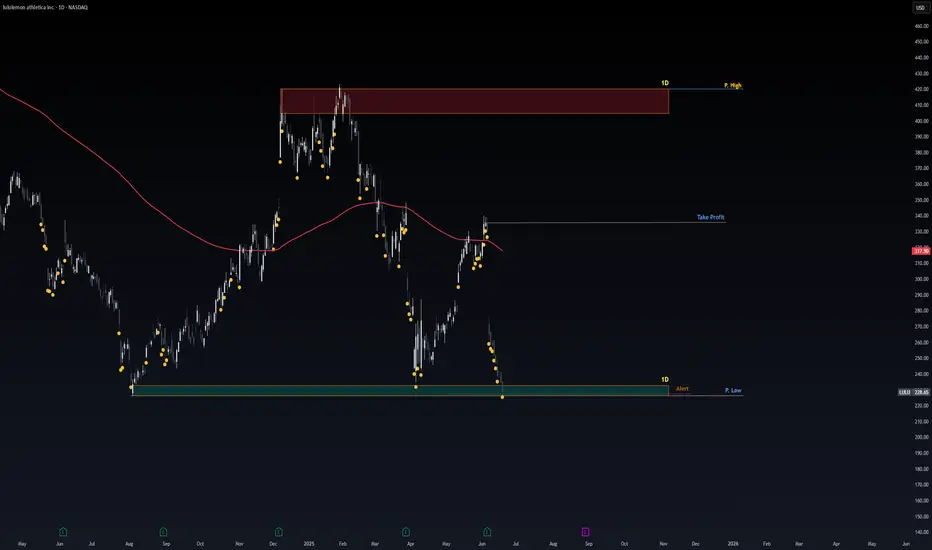
Safe Entry Zone LuLuStock current at SIGNIFICANT Support Level.
P.High's & P.Lows(Previous Highs & Previous Lows) acts as good Support and resistances levels.
1D Green Zone Is Buying Zone.
1D Red Zone is Selling Zone.
Take Profit Line is where you may secure Profit in case any selling Pressure showed-up near the Li
Key facts today
Next report date
—
Report period
—
EPS estimate
—
Revenue estimate
—
12.147 CHF
1.65 B CHF
9.65 B CHF
104.44 M
About lululemon athletica
Sector
Industry
CEO
Calvin R. McDonald
Website
Headquarters
Vancouver
Founded
1998
FIGI
BBG00TDKZPZ5
lululemon athletica, Inc. engages in the business of designing, distributing, and retailing technical athletic apparel, footwear, and accessories. It operates through the following segments: Company-Operated Stores, Direct to Consumer, and Other. The company was founded by Dennis James Wilson in 1998 and is headquartered in Vancouver, Canada.
Related stocks
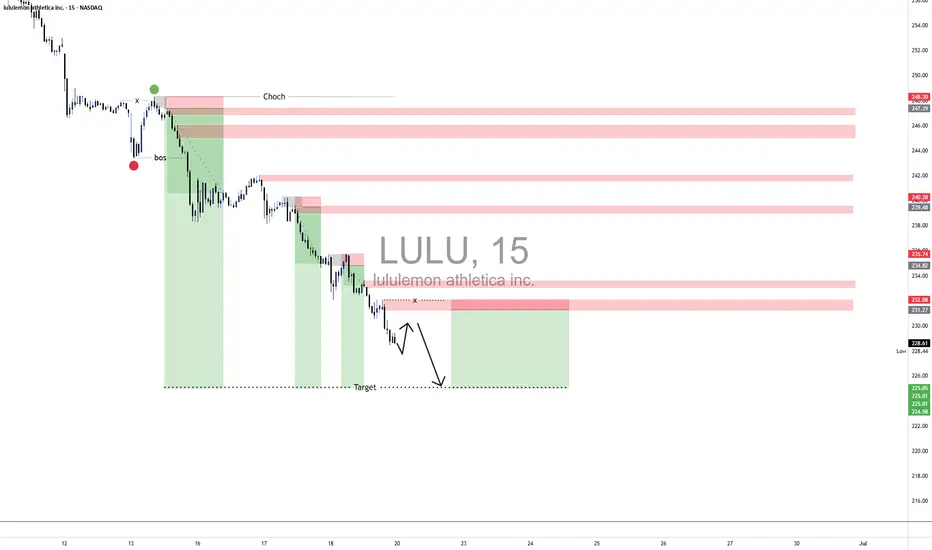
LULU 📉TechnicalAnalysis: LULU – 15-Min Chart (Short Bias)
On the 15-minute timeframe, LULU is currently forming a series of lower highs and lower lows, confirming a short-term bearish market structure. Price recently broke below a key intraday support zone near $243, which had previously held as a short
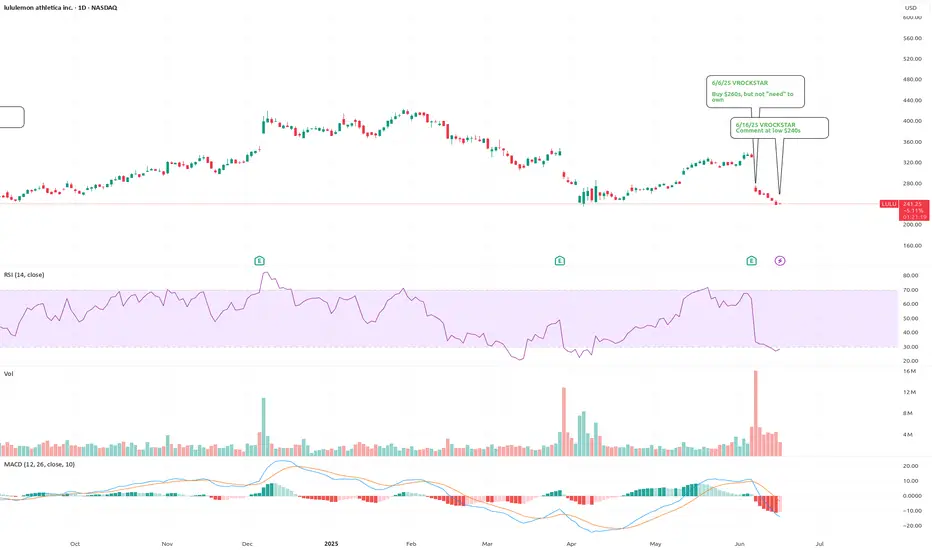
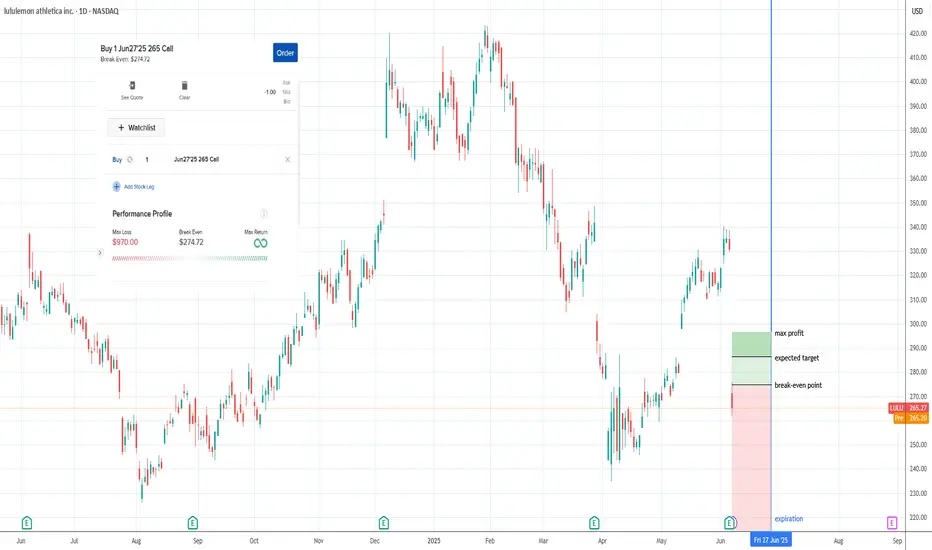
6/16/25 - $lulu - Comment at low $240s6/16/25 :: VROCKSTAR :: NASDAQ:LULU
Comment at low $240s
- see comment from 6/6/25 about why $260 post EPS was "interesting" but not obvious to own ST
- now we're only down a modest ~10% from there, so not much has really changed, except discretionary stocks have further drained. so this is not L
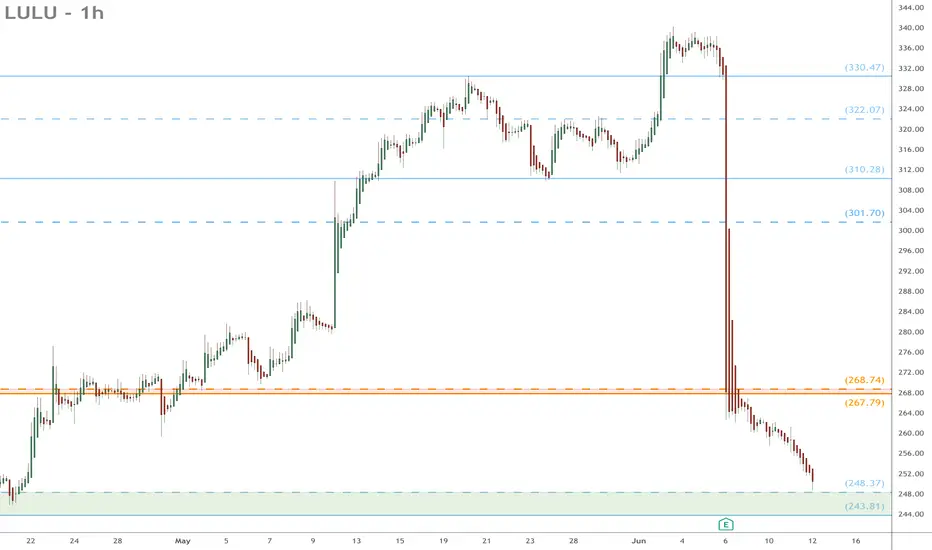
LULU eyes on $243-248: Decent Support to buy after Earnings DumpLULU earnings report caused a severe dip in price.
It is now testing a serious support at $243.81-248.17
Look to hold, or stab below and come back above.
.
Last Plot that gave PERFECT entry and exit:
.
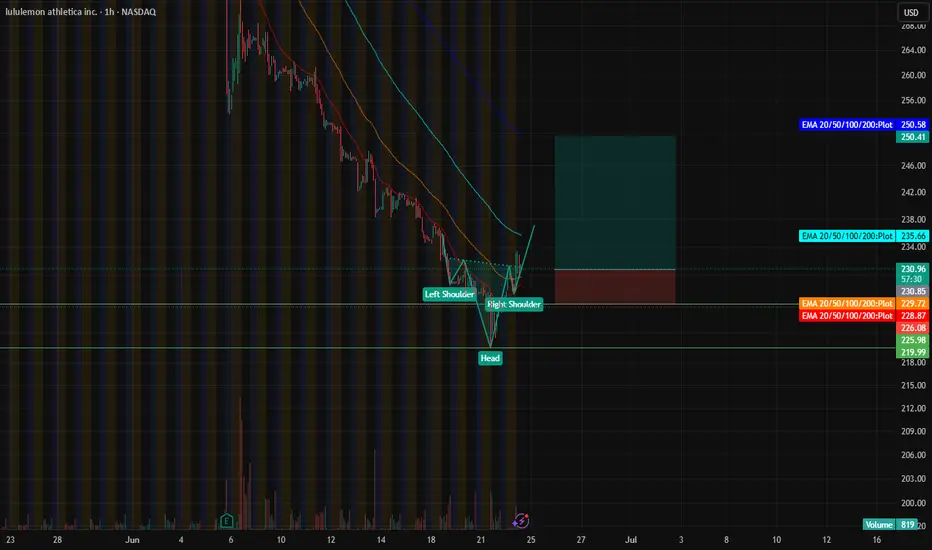
Lulu Long15-Minute Chart: Head and Shoulders Pattern
A head and shoulders pattern has formed on the 15-minute chart, signaling a potential reversal from a short-term downtrend, suggesting bullish momentum may be building.
Daily Chart: Hammer Candlestick & RSI Oversold
The daily chart shows a hammer candle
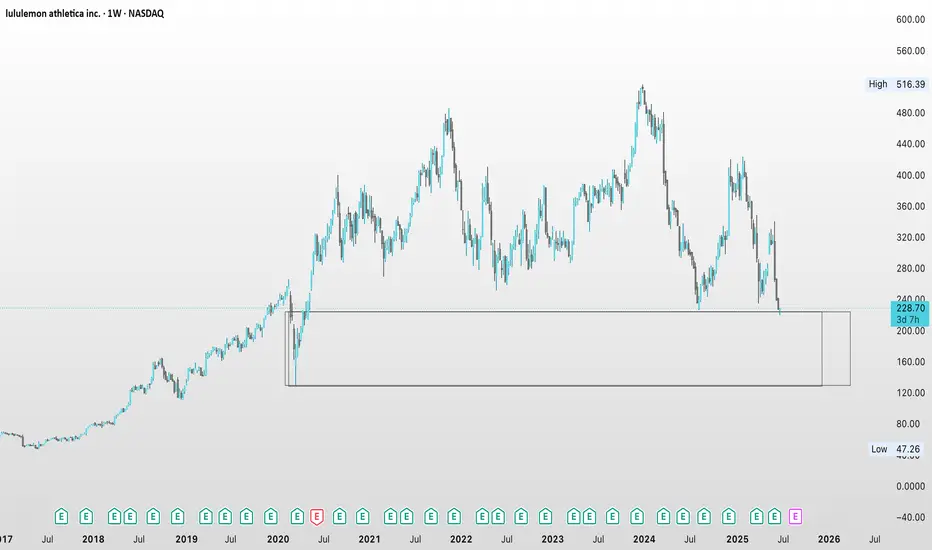
LULU investment ideaprice coming bck to 2020 prices,
mitigation POI at a deeep retracement
even a conservative reaction could go for imbalance
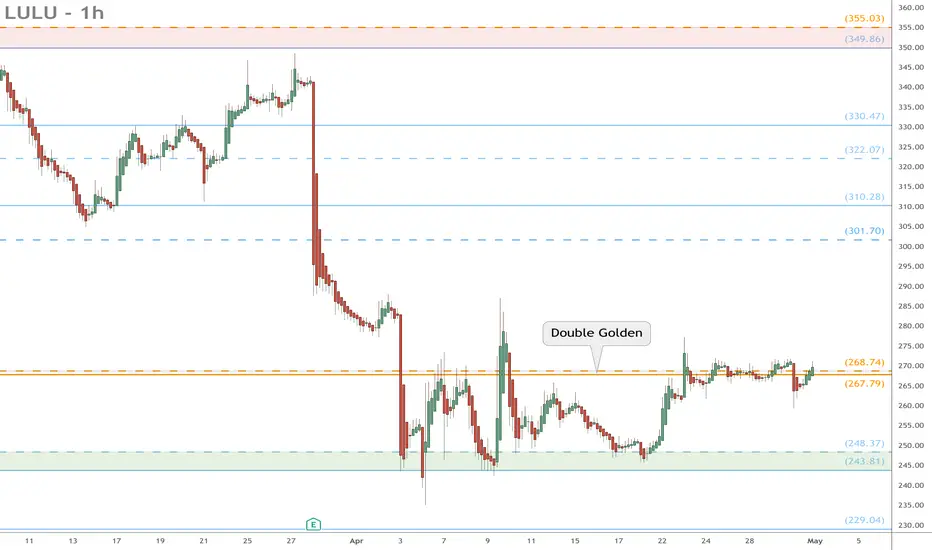
LULU watch $268 (again): Double Golden fibs may Break this timeLULU bounced back into the tight confluence of Goldens.
Golden Genesis at $267.70 and Golden Covid at $268.74.
These mark a major landmark in the lifetime of any asset.
Head and Shoulders PatternLululemon’s chart looks extremely bearish. It’s make or break for this stock. A breakdown of its current support would confirm the break of the neckline in a Head and Shoulders pattern. The 1:1 extension of the move could send the stock price down another 50%, towards $130. Yikes!
The 5 Wave superc

Going to HonoLULULululemon shares fell almost 20% after the company warned tariffs and consumer caution would hurt profits.
Here are some of my bold statements about this:
Tariffs are sector-wide, not Lululemon-specific
Nearly all premium athletic and apparel brands—Nike, Adidas, Under Armour, VF Corp (The
See all ideas
Summarizing what the indicators are suggesting.
Neutral
SellBuy
Strong sellStrong buy
Strong sellSellNeutralBuyStrong buy
Neutral
SellBuy
Strong sellStrong buy
Strong sellSellNeutralBuyStrong buy
Neutral
SellBuy
Strong sellStrong buy
Strong sellSellNeutralBuyStrong buy
An aggregate view of professional's ratings.
Neutral
SellBuy
Strong sellStrong buy
Strong sellSellNeutralBuyStrong buy
Neutral
SellBuy
Strong sellStrong buy
Strong sellSellNeutralBuyStrong buy
Neutral
SellBuy
Strong sellStrong buy
Strong sellSellNeutralBuyStrong buy
Displays a symbol's price movements over previous years to identify recurring trends.
Curated watchlists where 33L is featured.

Frequently Asked Questions
The current price of 33L is 187.420 CHF — it has decreased by −2.46% in the past 24 hours. Watch LULULEMON ATHLETIC stock price performance more closely on the chart.
Depending on the exchange, the stock ticker may vary. For instance, on BX exchange LULULEMON ATHLETIC stocks are traded under the ticker 33L.
33L stock has fallen by −6.96% compared to the previous week, the month change is a −30.84% fall, over the last year LULULEMON ATHLETIC has showed a −32.62% decrease.
We've gathered analysts' opinions on LULULEMON ATHLETIC future price: according to them, 33L price has a max estimate of 407.47 CHF and a min estimate of 142.61 CHF. Watch 33L chart and read a more detailed LULULEMON ATHLETIC stock forecast: see what analysts think of LULULEMON ATHLETIC and suggest that you do with its stocks.
33L stock is 2.30% volatile and has beta coefficient of 1.01. Track LULULEMON ATHLETIC stock price on the chart and check out the list of the most volatile stocks — is LULULEMON ATHLETIC there?
Today LULULEMON ATHLETIC has the market capitalization of 22.22 B, it has decreased by −3.73% over the last week.
Yes, you can track LULULEMON ATHLETIC financials in yearly and quarterly reports right on TradingView.
LULULEMON ATHLETIC is going to release the next earnings report on Aug 28, 2025. Keep track of upcoming events with our Earnings Calendar.
33L earnings for the last quarter are 2.15 CHF per share, whereas the estimation was 2.14 CHF resulting in a 0.60% surprise. The estimated earnings for the next quarter are 2.35 CHF per share. See more details about LULULEMON ATHLETIC earnings.
LULULEMON ATHLETIC revenue for the last quarter amounts to 1.96 B CHF, despite the estimated figure of 1.95 B CHF. In the next quarter, revenue is expected to reach 2.08 B CHF.
33L net income for the last quarter is 260.39 M CHF, while the quarter before that showed 682.25 M CHF of net income which accounts for −61.83% change. Track more LULULEMON ATHLETIC financial stats to get the full picture.
No, 33L doesn't pay any dividends to its shareholders. But don't worry, we've prepared a list of high-dividend stocks for you.
As of Jun 24, 2025, the company has 39 K employees. See our rating of the largest employees — is LULULEMON ATHLETIC on this list?
EBITDA measures a company's operating performance, its growth signifies an improvement in the efficiency of a company. LULULEMON ATHLETIC EBITDA is 2.49 B CHF, and current EBITDA margin is 27.83%. See more stats in LULULEMON ATHLETIC financial statements.
Like other stocks, 33L shares are traded on stock exchanges, e.g. Nasdaq, Nyse, Euronext, and the easiest way to buy them is through an online stock broker. To do this, you need to open an account and follow a broker's procedures, then start trading. You can trade LULULEMON ATHLETIC stock right from TradingView charts — choose your broker and connect to your account.
Investing in stocks requires a comprehensive research: you should carefully study all the available data, e.g. company's financials, related news, and its technical analysis. So LULULEMON ATHLETIC technincal analysis shows the sell today, and its 1 week rating is sell. Since market conditions are prone to changes, it's worth looking a bit further into the future — according to the 1 month rating LULULEMON ATHLETIC stock shows the strong sell signal. See more of LULULEMON ATHLETIC technicals for a more comprehensive analysis.
If you're still not sure, try looking for inspiration in our curated watchlists.
If you're still not sure, try looking for inspiration in our curated watchlists.