Will Nike’s Upcoming Earnings ‘Just Do It’ for Investors?This hasn’t been the greatest year for Nike NYSE:NKE , which will report earnings next Thursday at a time when the stock is down more than 20% year to date. What does technical and fundamental analysis say might happen to the stock from here?
Let’s take a look:
Nike’s Fundamental Analysis
NKE
Next report date
—
Report period
—
EPS estimate
—
Revenue estimate
—
1.781 CHF
2.65 B CHF
38.11 B CHF
1.16 B
About Nike
Sector
Industry
CEO
Elliott J. Hill
Website
Headquarters
Beaverton
Founded
1964
FIGI
BBG006TLSCZ3
NIKE, Inc engages in the design, development, marketing, and sale of athletic footwear, apparel, accessories, equipment, and services. It operates through the following segments: North America; Europe, Middle East & Africa; Greater China; Asia Pacific & Latin America; Global Brand Divisions; Converse; and Corporate. The North America; Europe, Middle East & Africa; Greater China; and Asia Pacific & Latin America segments refers to the design, development, marketing, and selling of athletic footwear, apparel, and equipment. The Global Brand Divisions represents NIKE Brand licensing businesses. The Converse segment designs, markets, licenses, and sells casual sneakers, apparel, and accessories. The Corporate segment consists of unallocated general and administrative expenses. The company was founded by William Jay Bowerman and Philip H. Knight on January 25, 1964 and is headquartered in Beaverton, OR.
Related stocks
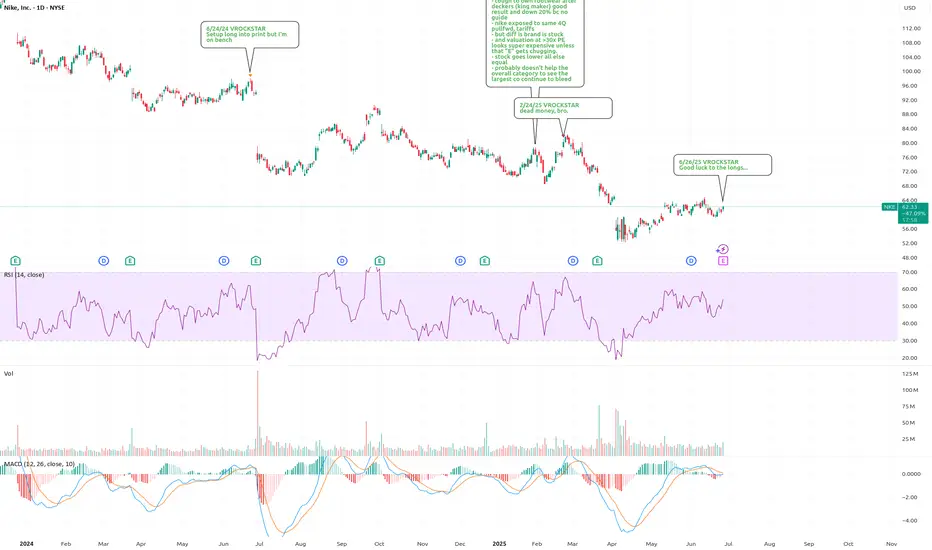
6/26/25 - $nke - Good luck to the longs...6/26/25 :: VROCKSTAR :: NYSE:NKE
Good luck to the longs...
- keeping it small
- but let's be real
- nke still trades dayum near 30x earnings and earnings aren't growing.
- discretionary is impossible to buy
- tariff tylk back, whaddidu think?
- they miss miss miss...
- comps not reporting good r
$NKEAs the Vietnamese Dong weakens against the Dollar, this could benefit $NKE. Cheaper production costs in Vietnam mean stronger margins, giving Nike room to stay competitive and stimulate the market while maintaining profitability. 📉💸👟
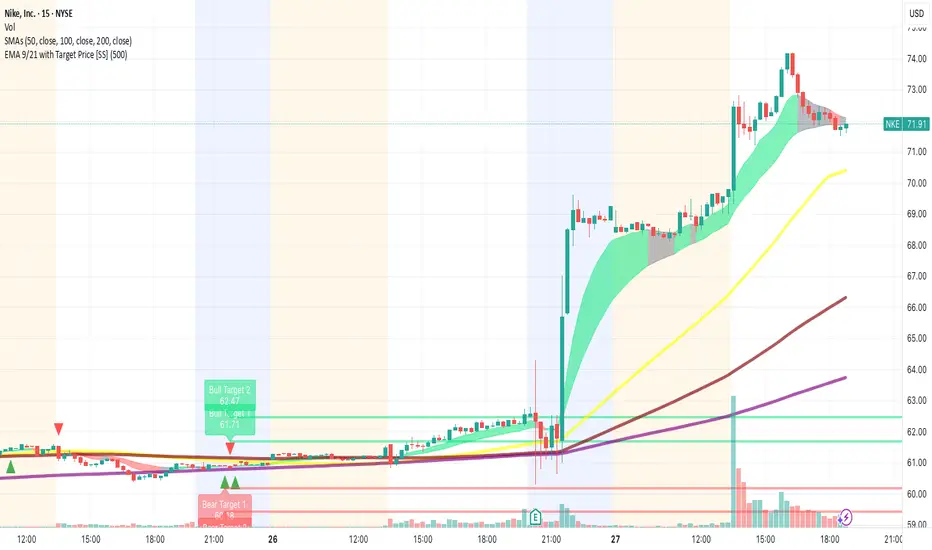
Nike’s Accumulation Zone Signals Bullish Reversal Potential
Current Price: $60.53
Direction: LONG
Targets:
- T1 = $63.25
- T2 = $66.00
Stop Levels:
- S1 = $55.80
- S2 = $52.40
**Wisdom of Professional Traders:**
This analysis synthesizes insights from thousands of professional traders and market experts, leveraging collective intellige
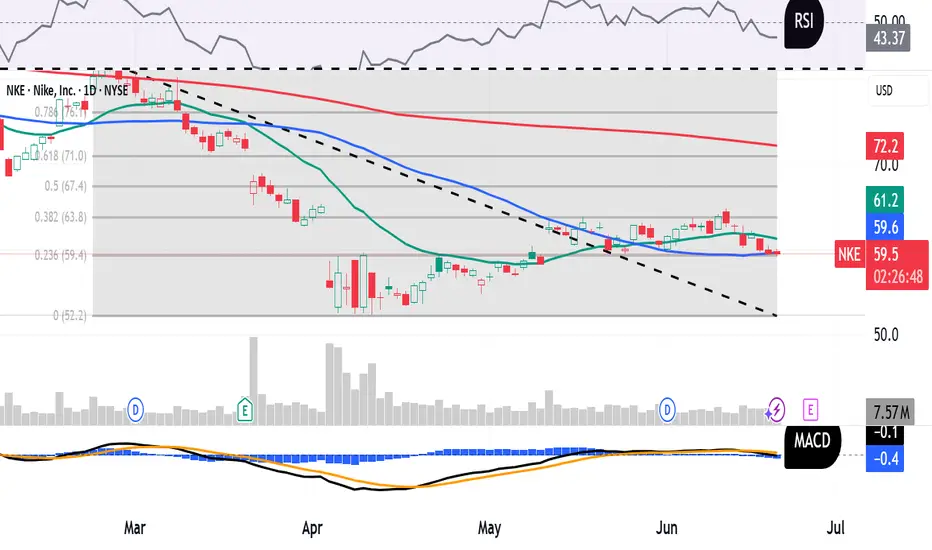
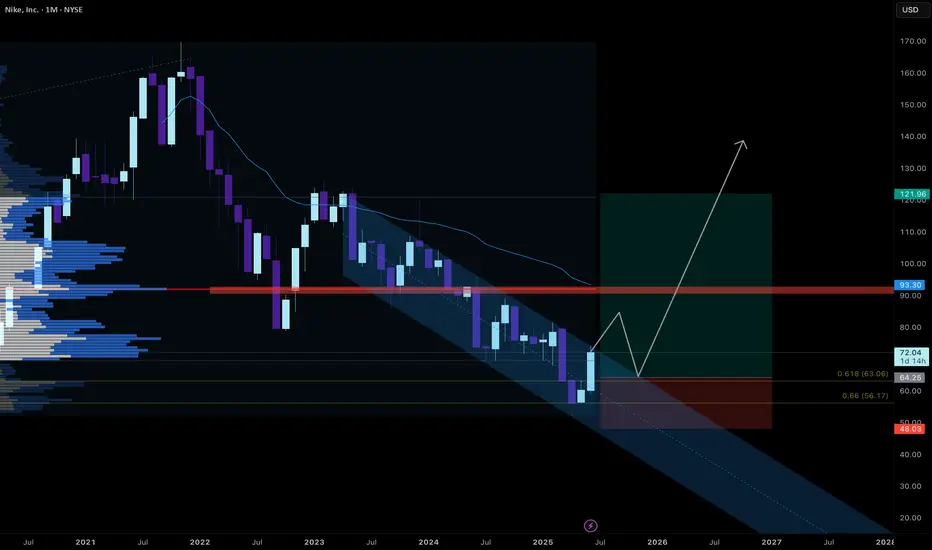
Break of downward sloping channel LongNike has swept liquidity and is now showing a strong bounce to the upside.
Although I didn’t manage to enter the initial long, I am monitoring for a break above the current downward-sloping channel. A clean breakout followed by a retest would provide a more reliable entry point. I’m not aiming to c
Nike hit us hard… and that needs to be said too.Nike hit us hard… and that needs to be said too.
I’m not going to sugarcoat it: we entered a PUT before earnings, and we lost. We had over 20 criteria from our “Eagle Trap” system lined up — high RSI, a sharp rally with no solid fundamentals, declining sales in China and the U.S., weak forward guid
NKE at 52-Week Lows Oversold Giant or Value Trap?Nike is a blue-chip name going through a rough patch. But this recent dip, fueled by disappointing earnings and macro uncertainty, could present a classic oversold opportunity. The stock is now in a high-probability reversal zone where risk/reward becomes extremely attractive.
🎯 Updated Entry Plan:

NKE – EMA Crossover and Bullish Continuation PotentialNIKE (NKE) has completed a clean technical gap fill and is now showing early signs of a trend reversal.
🔍 Key Technical Factors:
✅ Gap Filled: The March-April gap was filled cleanly and held.
✅ EMA Crossover: EMA 9 crossed above EMA 21 → bullish short-term signal.
✅ RSI > 50: Momentum shifting bull

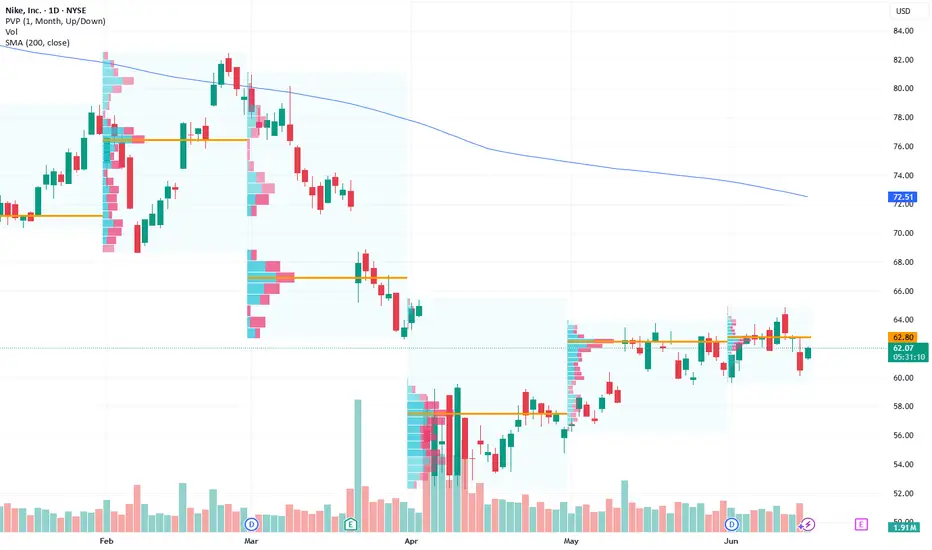
Nike's Pullback Provides a Valuable Long Opportunity
Current Price: $62.80
Direction: LONG
Targets:
- T1 = $64.50
- T2 = $68.00
Stop Levels:
- S1 = $61.00
- S2 = $59.00
**Wisdom of Professional Traders:**
This analysis synthesizes insights from thousands of professional traders and market experts, leveraging collective intellige

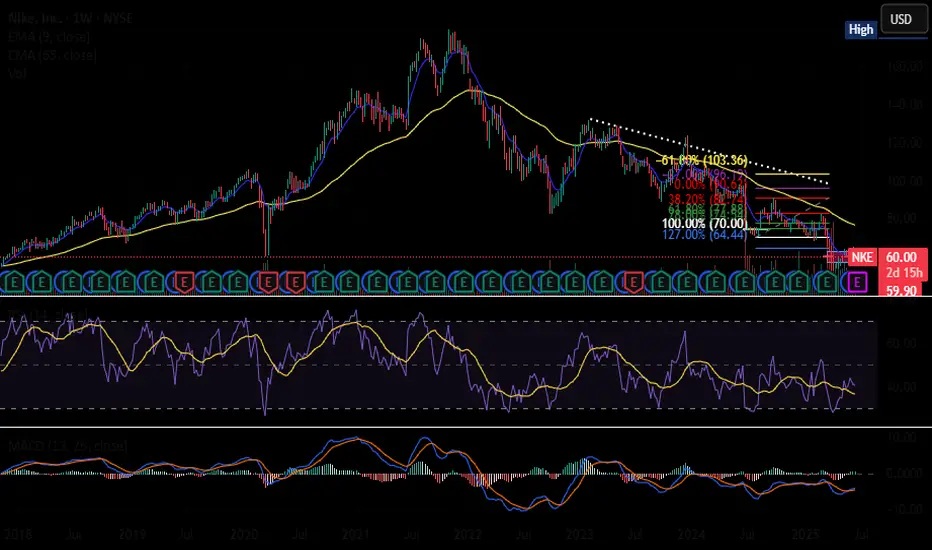
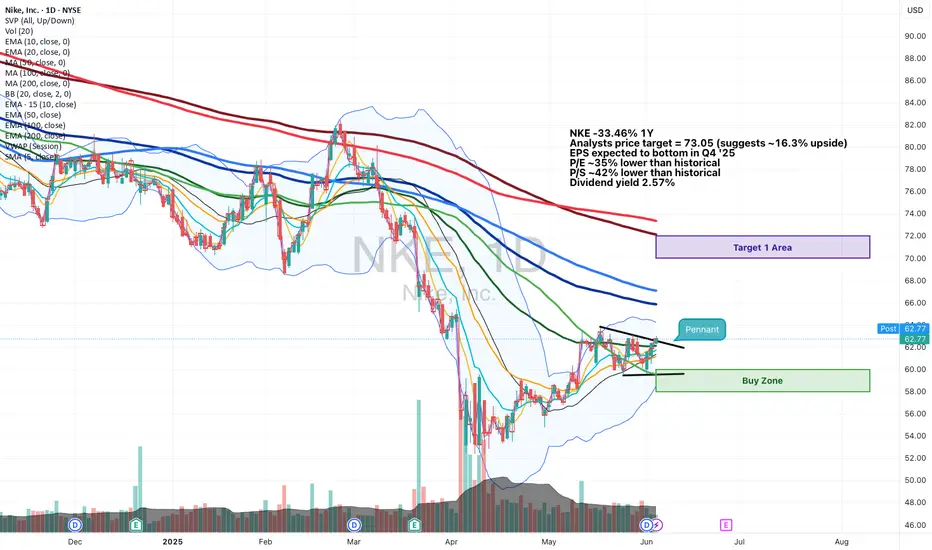
Nike (NKE) Long Term Buy - Pennant SetupNKE -33.46% 1Y
Analysts price target = 73.05 (suggests ~16.3% upside)
EPS expected to bottom in Q4 '25
P/E ~35% lower than historical
P/S ~42% lower than historical
Dividend yield 2.57%
Buy Zone = 58-60
Target 1 Area = 70-72
See all ideas
Summarizing what the indicators are suggesting.
Neutral
SellBuy
Strong sellStrong buy
Strong sellSellNeutralBuyStrong buy
Neutral
SellBuy
Strong sellStrong buy
Strong sellSellNeutralBuyStrong buy
Neutral
SellBuy
Strong sellStrong buy
Strong sellSellNeutralBuyStrong buy
An aggregate view of professional's ratings.
Neutral
SellBuy
Strong sellStrong buy
Strong sellSellNeutralBuyStrong buy
Neutral
SellBuy
Strong sellStrong buy
Strong sellSellNeutralBuyStrong buy
Neutral
SellBuy
Strong sellStrong buy
Strong sellSellNeutralBuyStrong buy
Displays a symbol's price movements over previous years to identify recurring trends.
US654106AG8
NIKE 16/46Yield to maturity
6.63%
Maturity date
Nov 1, 2046
NKE4971170
NIKE, Inc. 3.375% 27-MAR-2050Yield to maturity
6.54%
Maturity date
Mar 27, 2050
NKEB
NIKE 15/45Yield to maturity
6.29%
Maturity date
Nov 1, 2045
NKEA
NIKE 13/43Yield to maturity
6.23%
Maturity date
May 1, 2043
NKE4971169
NIKE, Inc. 3.25% 27-MAR-2040Yield to maturity
5.91%
Maturity date
Mar 27, 2040
NKE4971168
NIKE, Inc. 2.85% 27-MAR-2030Yield to maturity
4.36%
Maturity date
Mar 27, 2030
US654106AF0
NIKE 16/26Yield to maturity
4.31%
Maturity date
Nov 1, 2026
NKE4971167
NIKE, Inc. 2.75% 27-MAR-2027Yield to maturity
4.03%
Maturity date
Mar 27, 2027
See all NKE bonds
Curated watchlists where NKE is featured.


Frequently Asked Questions
The current price of NKE is 57.643 CHF — it has increased by 17.57% in the past 24 hours. Watch NIKE INC stock price performance more closely on the chart.
Depending on the exchange, the stock ticker may vary. For instance, on BX exchange NIKE INC stocks are traded under the ticker NKE.
NKE stock has risen by 18.68% compared to the previous week, the month change is a 10.62% rise, over the last year NIKE INC has showed a −31.54% decrease.
We've gathered analysts' opinions on NIKE INC future price: according to them, NKE price has a max estimate of 96.05 CHF and a min estimate of 30.42 CHF. Watch NKE chart and read a more detailed NIKE INC stock forecast: see what analysts think of NIKE INC and suggest that you do with its stocks.
NKE stock is 16.38% volatile and has beta coefficient of 0.92. Track NIKE INC stock price on the chart and check out the list of the most volatile stocks — is NIKE INC there?
Today NIKE INC has the market capitalization of 85.11 B, it has decreased by −3.25% over the last week.
Yes, you can track NIKE INC financials in yearly and quarterly reports right on TradingView.
NIKE INC is going to release the next earnings report on Sep 30, 2025. Keep track of upcoming events with our Earnings Calendar.
NKE earnings for the last quarter are 0.12 CHF per share, whereas the estimation was 0.11 CHF resulting in a 7.45% surprise. The estimated earnings for the next quarter are 0.23 CHF per share. See more details about NIKE INC earnings.
NIKE INC revenue for the last quarter amounts to 9.13 B CHF, despite the estimated figure of 8.83 B CHF. In the next quarter, revenue is expected to reach 8.80 B CHF.
NKE net income for the last quarter is 173.66 M CHF, while the quarter before that showed 717.28 M CHF of net income which accounts for −75.79% change. Track more NIKE INC financial stats to get the full picture.
Yes, NKE dividends are paid quarterly. The last dividend per share was 0.33 CHF. As of today, Dividend Yield (TTM)% is 2.14%. Tracking NIKE INC dividends might help you take more informed decisions.
NIKE INC dividend yield was 2.59% in 2024, and payout ratio reached 72.69%. The year before the numbers were 1.53% and 38.91% correspondingly. See high-dividend stocks and find more opportunities for your portfolio.
Like other stocks, NKE shares are traded on stock exchanges, e.g. Nasdaq, Nyse, Euronext, and the easiest way to buy them is through an online stock broker. To do this, you need to open an account and follow a broker's procedures, then start trading. You can trade NIKE INC stock right from TradingView charts — choose your broker and connect to your account.
Investing in stocks requires a comprehensive research: you should carefully study all the available data, e.g. company's financials, related news, and its technical analysis. So NIKE INC technincal analysis shows the buy rating today, and its 1 week rating is buy. Since market conditions are prone to changes, it's worth looking a bit further into the future — according to the 1 month rating NIKE INC stock shows the sell signal. See more of NIKE INC technicals for a more comprehensive analysis.
If you're still not sure, try looking for inspiration in our curated watchlists.
If you're still not sure, try looking for inspiration in our curated watchlists.