Setup Saturday Backtesting Templates Today I will be going over a setup that I am finding and am liking. It is a mean reversion; Low of the Day Buy Setup to take out the High of Day.
I want to trade like Mcdonald's with each setup being a cookie cutter formula. It is either there, or it isn't. I don't want to guess direction or trade movement. I want a simple setup that repeats itself regularly.
I am going over my playbook of setups and simplifying my entire process to 3-5 buys and 3-5 sells.
Today's setup is LOD Range Back to HOD:
This setup has a certain behavior it follows for each of the "sections" of the setup
1. Opening of the Daily Candle
2. Formation of the Initial High of Day
3. The Dump
4. Setting up of the Low of Day
5. The Entry
6. The Pump
7. Where to Place Stop
8. Where to Place Target
I have given multiple examples of the same setup with minor variations and across different instruments. This is a New York setup that occurs roughly an hour or two after it NY opens. This is not something that occurs in Asia or London.
In Summary:
This is a range trade, mean reversion that takes place late in the NY session. It requires the entire day to setup and has specific parts that behave the same. Look for the initial high of day to form and the dump prior to NY. Wait until NY puts in the Low of Day and enter with small doji candles. Target the High of Day.
YMH2018 trade ideas
YMUjust a play idea that could happen.
remember, the market will do what it wants.
i trade price action; utilizing pivots and sessions indicators
my charts are alot less messy when im trading
overall, i see bullish for YMU but anticipating a possibly deep pullback.
thoughts on this idea?
YM : Short levelThe level has been activated, so you can short it. I have slightly edited it since last time. It is best to scalp or pip it; I cannot promise any significant movement. Be careful when trading on news or at market close/open.
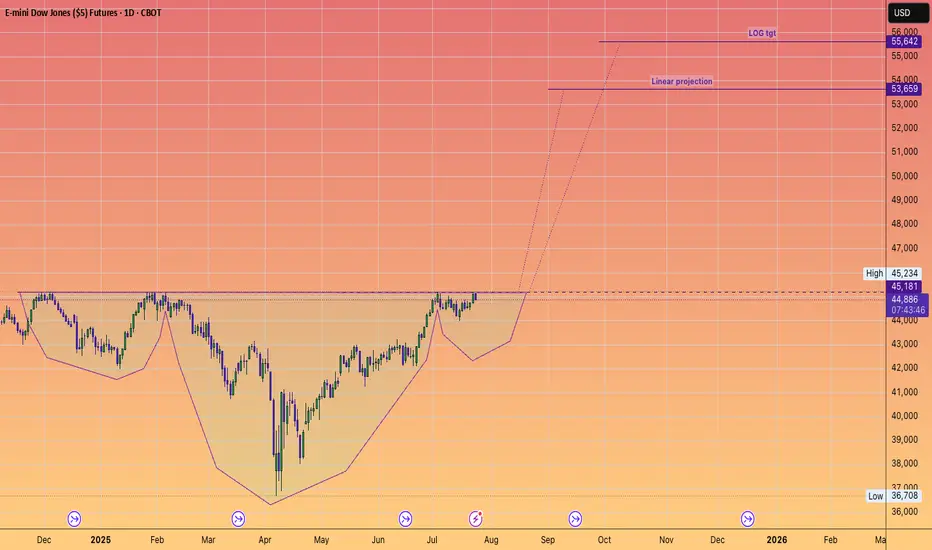
DOW JONES to 55,642#InverseHead&Shoulders
Projects record new highs.
Another stepping stone to our long held forecast of 64,000
Why?
Because AI will significantly contribute to an EXPANDING #GDP
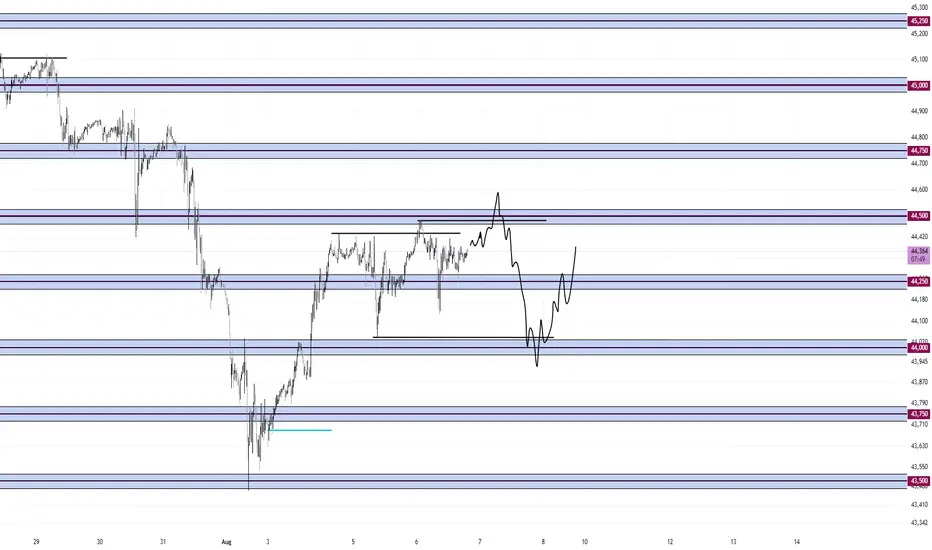
Mean Reversion Around 250. Buy at 00's and Sell 500I can see price mean reversion around 250. Therefore, buy the lows and sell the highs.
500 as resistance and 00's as support.
So far, the peak formation is at the low of August, therefore, the trend is bullish.
I am expecting a run of the high then a dump to 44,000 before the continuation of the bull trend
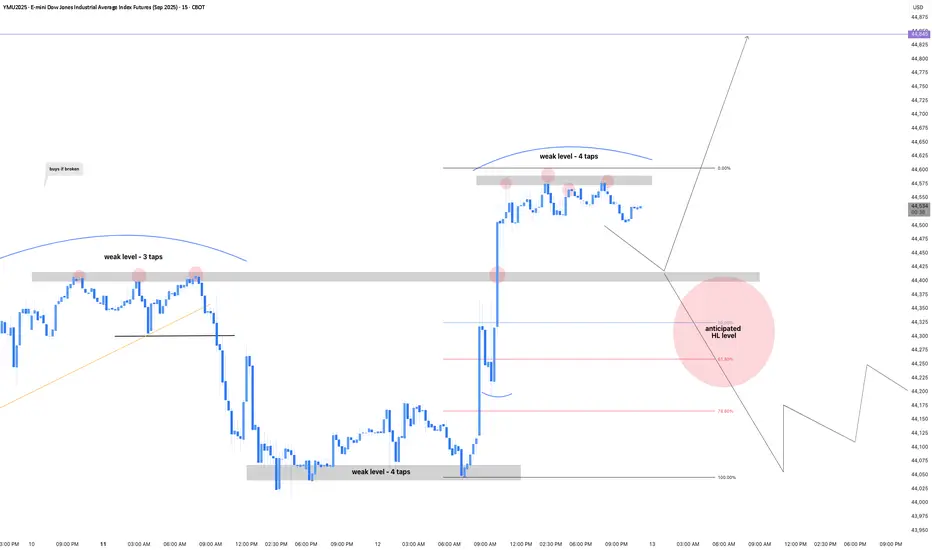
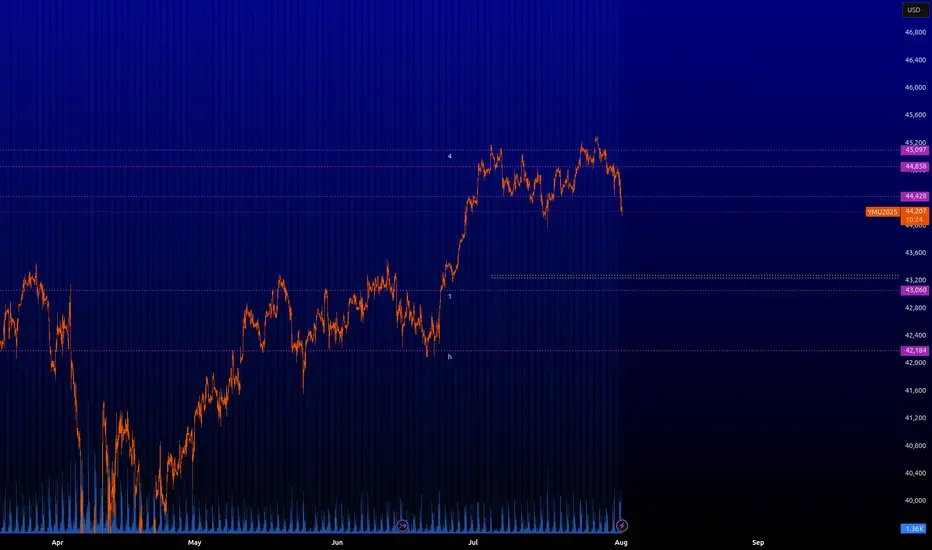
Dow Futures (YM) Nearing Final Push Before Significant RetreatThe Dow Futures (YM) cycle, initiated from the April 2025 low, has reached a mature phase and could conclude soon. We anticipate one final push higher to complete the impulsive cycle from that low. As shown on the one-hour chart, wave (3) of this impulse peaked at 45,312. The subsequent wave (4) pullback concluded at 43,467, forming a zigzag Elliott Wave structure. From wave (3), wave A dropped to 44,418, wave B rallied to 44,852, and wave C fell to 43,467, finalizing wave (4). The Index has since turned upward in wave (5), but it must surpass the wave (3) high of 45,312 to eliminate the possibility of a double correction.
Currently, wave (5) is unfolding as a lower-degree impulse. From wave (4), wave ((i)) reached 43,864, followed by a wave ((ii)) pullback to 43,542. The Index then advanced in wave ((iii)). From wave ((ii)), wave (i) hit 43,997, and wave (ii) corrected to 43,881. We expect a few more highs before wave 1 of (5) completes. A wave 2 pullback should follow, but the Index will likely resume its ascent afterward. As long as the pivot low at 43,467 holds, dips should attract buyers in 3, 7, or 11 swings, supporting further upside in the near term.

Monday Three Session Pump and Dump Sell DayI will be waiting for around an hour or so after NY opens to pump up into the monthly open and 250 level for the dump back down to the daily open
My bias for the next two weeks are bearish.

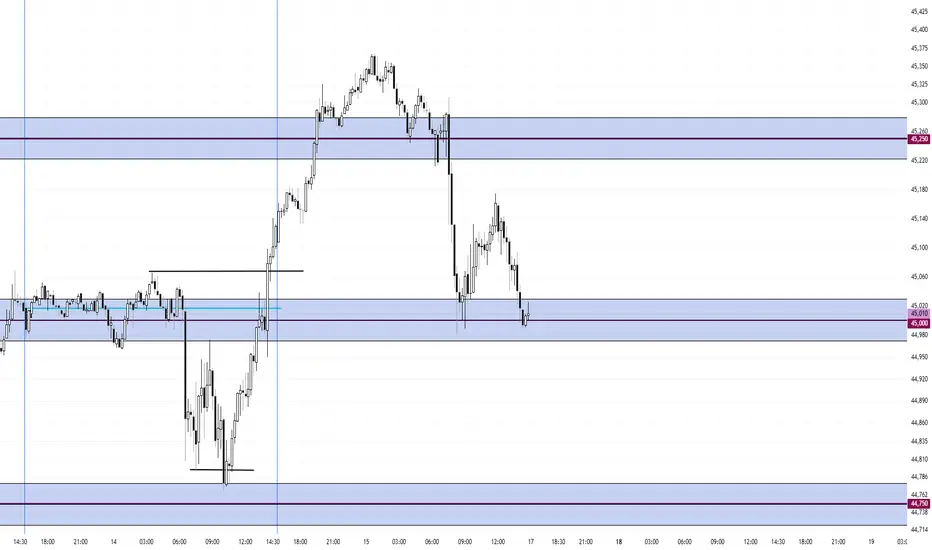
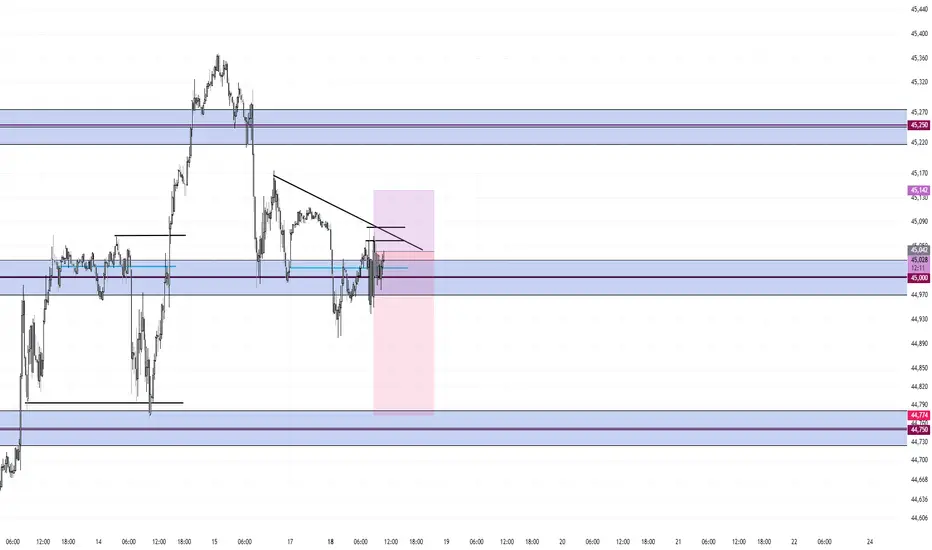
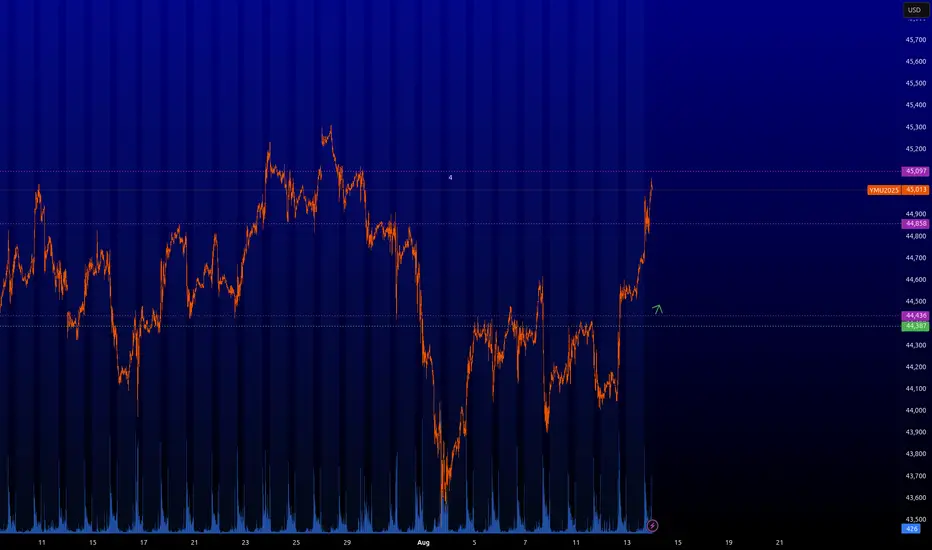
Mean Reversion Around 00's Short Down to 750I am short at 45,042 after the close of a fat green bar. My bias is down and so I sell into bull bars.
Price is currently mean reverting around 45,000 with the peak formation high above 250. I am looking for price to go down to the next level at 750.
I am using a 100 tick stop and a 265 tick target
YM-DOW JONES-PREMARKET ANALYSIS-WEEKLY SELLMarket reacted off of higher time frame resistance, taking out previous week of July 28th liquidity, expecting sell off for the upcoming week.

Weekly Outlook. Index Triad. $ES $NQ $YM. 17.08.2025, SundayCME_MINI:ES1!
CME_MINI:NQ1!
CBOT_MINI:YM1!
Looking for a Weekly Power of Three on NQ ES and YM. A push down towards discount levels and again a massive push up towards new All Time Highs

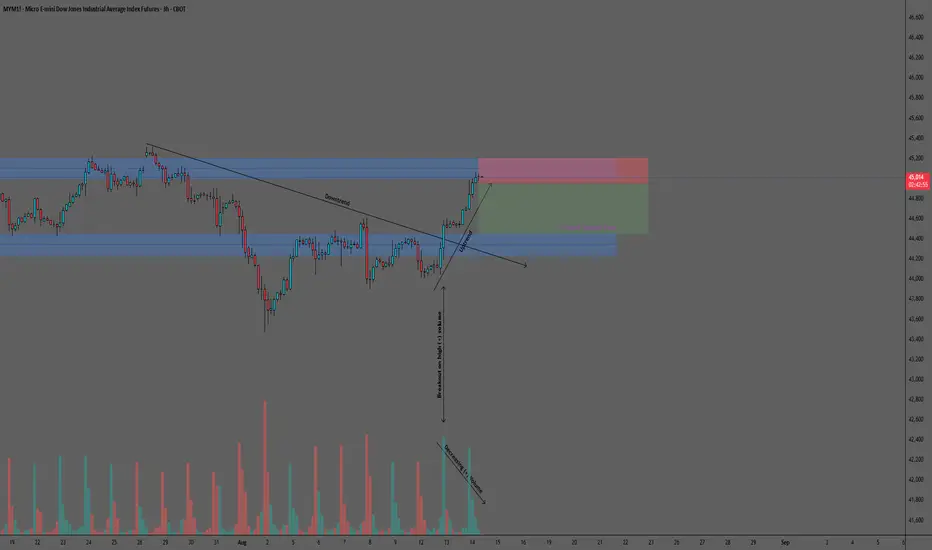
MYM (Micro Dow Jones Index Futures) Trade Setup – 3H TimeframeMYM: Bearish Setup at Major Resistance with Fading Bullish Momentum
MYM has recently broken above the 44,230–44,450 support-turned-resistance zone and the downtrend line originating from its July 28, 2025 all-time high. This bullish move, triggered in part by the August 12 major news release, extended into the 45,000–45,200 resistance area—a historically strong supply zone.
The 3-hour chart highlights that, while the breakout was fueled by strong initial volume, the subsequent advance toward resistance has been accompanied by gradually declining positive volume. This pattern suggests waning buying pressure and a potential shift in control toward sellers at current levels.
Illustrative Setup: A Sell Stop order at 44,960 positions the entry just below the psychological 45,000 mark, aiming to capture a reversal from the current resistance zone. A Stop Loss at 45,200 is placed above the upper boundary of resistance, providing a clear invalidation point for the bearish thesis. The Take Profit target at 44,450 aligns with the top of the nearest support zone (44,230–44,450), offering an attractive 2.13:1 reward-risk ratio.
Key considerations: The confluence of a major resistance zone and fading bullish volume provides multiple technical factors supporting a pullback scenario. However, given the psychological weight of the 45,000 level, some consolidation may occur before any decisive move. Traders should closely monitor price behavior at resistance for confirmation and remain mindful of broader market sentiment.
This analysis is provided solely for educational and entertainment purposes and does not constitute any form of financial or investment advice. Always manage your risk and trade responsibly.
YM : Long levelThe level has been activated, so you can buy it. I have slightly edited it since last time. It is best to scalp or pip it; I cannot promise any significant movement. Be careful when trading on news or at market close/open.
YM : Long levelThe level has been activated, so you can buy it. I have slightly edited it since last time. It is best to scalp or pip it; I cannot promise any significant movement. Be careful when trading on news or at market close/open.
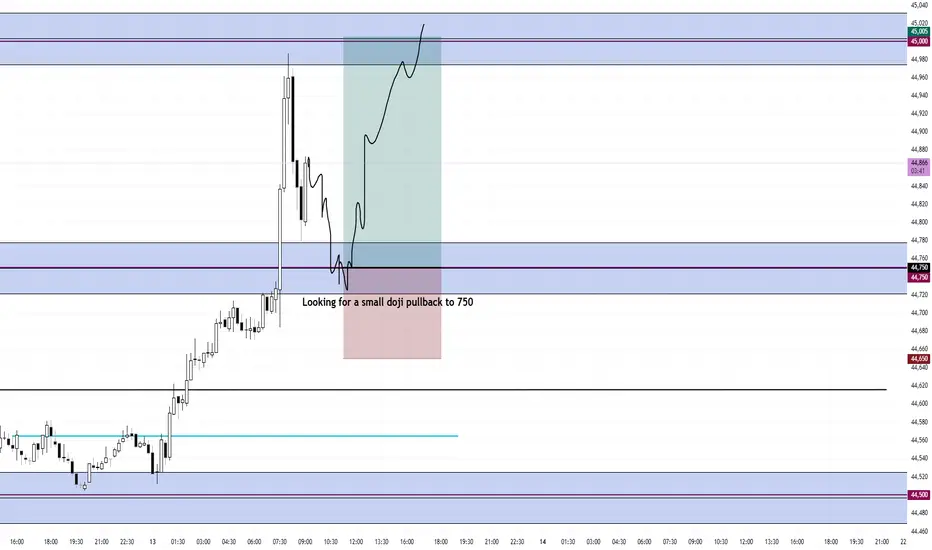
Pullback to 750 with a doji candle. Long for 250 ticksI am waiting for the smallest doji candle I can find pulling back into 750 for the Long trade back up to 45k.
I am not chasing this current candle because it is suspended above the numbers out in no mans land
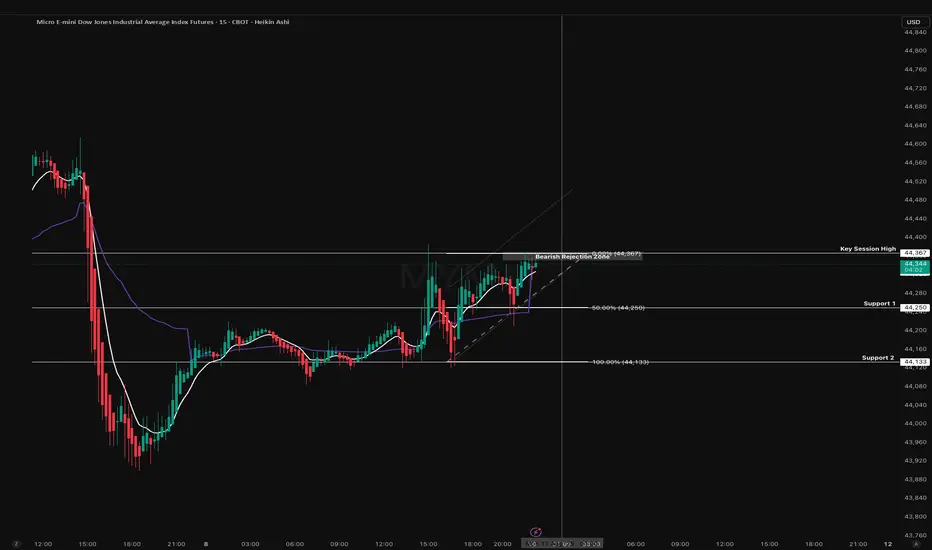
MYM Tokyo Open Battle Line: 44,367 Under SiegeHeading into the Tokyo open on MYM, price is pressing against the 44,367 resistance a level that has now rejected twice intraday.
From a structural standpoint, we’re trading within a rising short-term trend line, but momentum into this high has been relatively shallow, suggesting a potential fade setup. On the bearish side, a rejection from 44,367 would likely send price back to the 50% retracement at 44,250, with a further extension to the 100% retrace at 44,133 if sellers maintain control.
This aligns with the repeated supply reaction and the lack of impulsive buying volume I’m assigning this path a 65% probability. On the bullish side, a decisive break and sustained hold above 44,367 opens the door for continuation into the next liquidity pocket (44,420–44,450), targeting prior volume imbalance fill. This scenario requires follow-through during the typically thinner Tokyo session, so I’m giving it a 35% probability. In short I’m leaning bearish unless we see a clean breakout and hold above the high, at which point the bias flips long.
Asia Range Breakout - The trap and the entryDescription:
This chart illustrates a textbook Asia Session Range breakout, highlighting both the manipulative trap and the ideal entry based on the SquawkTradeFX strategy.
🔹 Asia Session Range (Grey Box):
This tight consolidation forms overnight during the Asia session.
Price oscillates within a narrow high/low range, creating the trap zone.
This is the “wick zone” of the eventual daily candle.
🔹 The Trap — Liquidity Sweep:
Notice how price first fakes a breakout to the upside, breaking above the Asia High.
This is a liquidity grab, targeting early breakout buyers and triggering their stop-losses.
🔹 The Confirmation & Entry:
After the upside trap, price quickly reverses, sweeping back down.
Momentum increases and volume picks up as price breaks below the Asia Low.
This break signals a true shift in directional intent and offers a high-probability entry as the daily body forms.
🟢 Entry Zone:
Entry is taken on the bearish breakout of the Asia Low after the sweep.
Ideally confirmed with strong bearish candle structure and volume from the London or NY session.
📌 Why This Matters:
This setup exemplifies the SquawkTradeFX principle:
“Let the traps spring first — then strike with confirmation.”

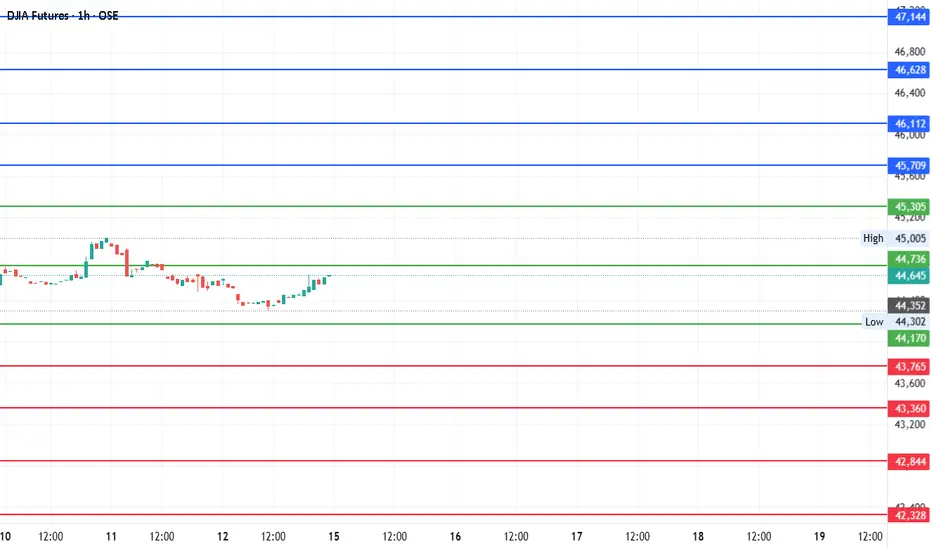
#DJI Futures Outlook: Key Levels to Watch Around Pivot 44,736Date: 14-07-2025
📊 Current Price: 44,645
📍 Pivot Point: 44,736.00
🔼 Upside / Bullish Scenario
If the price sustains above the pivot point (44,736), it could target the following resistance and bullish targets:
Immediate Resistance: 45,305.40
Target 1: 45,708.70
Target 2: 46,112.00
Target 3: 46,628.00
Target 4: 47,144.00
Bullish Bias Trigger: A break and hold above 45,305.40 increases confidence in these targets.
🔽 Downside / Bearish Scenario
If the price moves and holds below the pivot, the focus shifts to support levels and bearish targets:
Immediate Support: 44,170.04
Target 1: 43,765.02
Target 2: 43,360.00
Target 3: 42,844.00
Target 4: 42,328.00
Bearish Bias Trigger: A break below 44,170.04 opens the door to these downside levels.
#DowJones #TradingView #StockMarket #Investing #Trading #DJIFutures
#PivotPoints #DowJones #MarketOutlook #FuturesTrading
YM : Key levelsHere are the key levels that the market will be interested in. From the green zone it is ideal to look for longs. As it will be possible to enter somewhere by limitation and take some profit, I will inform you.
⚠️ VOLATILITY WARNING ⚠️
Trading around major news can be extremely unpredictable. Trade responsibly!
Peak Formation High Into Double Zero's Dump to Monthly OpenLooking for a peak formation high to form under the double zeros.
The market is most likely targeting the liquidity sitting around the monthly open.
I don't see any support until the market takes out some of these lows. Maybe at 44,250.
Highlighted in red brush is every peak formation high formed this month.
Dow Jones Monday Gap and Rally Long Trade EntryI am going for a gap up and rally idea. Extremely bullish bias. I am already triggered in Long at 45,252
stop is 75 ticks
target is 180 ticks
This is my one trade for the day.
Same idea as Sunday May 11th where it too gapped up at the open over 1% and right into 250 for the rally all day
Today's action

TOP DOWN ANALYSIS-DOW JONES-YM-LONGS-WEEKLY OVERVIEWPrice is at a key level of resistance, expecting a reaction off the 45,084 level to the downside, or a breakout to the upside, creating a new high.

Range Bound Low of Day Buy (If Presented)Price is mean reverting around 45,000 and also mean reverting around today's open. I will be waiting for a mean reversion play under the low of day targeting the high of day.
I will be waiting for a small entry candle, a small doji. I did not take this first run up because the entry vs stop would have been too large. I believe the first mouse in will get dunked on.
Once entered, I will use a 75 tick stop and a 190 tick target for a 2.5 to 1

dow for buyDow Jones
buy now signal
trend changed .........................................
............................
thanks
