Stablecoins will Supercharge Cryptos AdoptionCME: Micro Bitcoin Futures ( CME:MBT1! ), #microfutures
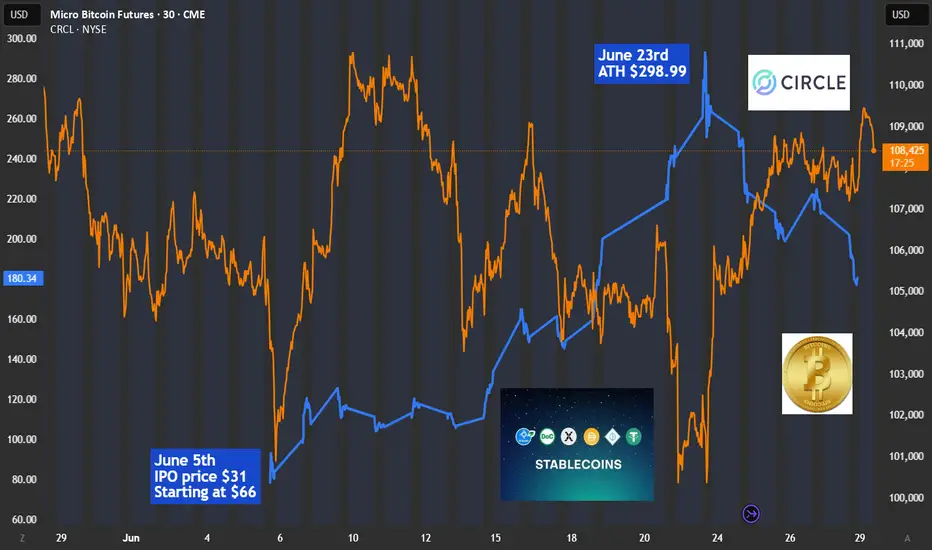
On June 5th, Circle Internet Group ( NYSE:CRCL ), issuer of the #USDC #stablecoin, debuted its initial public offering at $31 per share. By June 23rd, NYSE:CRCL prices peaked at $298.99, up nearly ten folds in just 13 trading days.
At Friday's closing of $180.43, Circle has a market cap at $40.2 billion. Wall Street gave a mindboggling price earnings ratio of 234, based on Circle’s $0.77 earnings per share.
How to Invest in Stablecoins
Stablecoins are cryptocurrencies that aim to maintain price stability. Both USDC and #USDT (issued by #Tether) peg their value to the US dollar. Paying $1 for 1 stablecoin, you will get exactly $1 back in one month, one year, or ten years. Unlike buying Bitcoin, there is no investment return for holding stablecoins. So why would anyone want them?
Because stablecoins are not investment instruments, instead, they are payment methods. Like PayPal and Apple Pay, USDT and USDC enable users to move money fast and cheaply globally, but now in the crypto world.
How do stablecoin issuers make money? They generate revenue through interest on reserves, transaction fees, lending, and partnerships with financial institutions.
• The biggest source of revenue is interest income. When it comes to stablecoin issuers, size matters, and the Fed matters.
• Based on a study by Artemis, Castle Island Ventures, and Dragonfly on May 29th, USDT and USDC have a combined market capitalization of over $214 billion.
• With the Fed Funds rate averaging above 5% last year, the $214 billion reserve investing in Treasury and other high-quality bonds could yield at least $12 billion between Tether and Circle.
• Tether reported 2024 profit of $13 billion, while Circle generated $1.68 billion last year.
Investing in stablecoins means buying Circle stock, not converting cash into USDC. The difference is like buying Apple stock vs. adding money in your Apple Pay account.
Headwinds and Tailwinds
On June 17th, the US Senate passed the GENIUS Act of 2025. It establishes a regulatory framework for the $250 billion market for stablecoins. “Stablecoins are a paradigm-shifting development that can bring our payment system into the 21st century", declared Sen. Bill Hagerty of Tennessee, who introduced the bill.
With regulatory certainty, real-world utility and adoption will quickly follow. The future for stablecoins is very bright, and I expect the market size to double soon. However, market leaders Tether and Circle both face strong headwinds going forward.
• Real world utility brings in fierce competition. Big banks and credit card issuers will create their own stablecoins to keep customers on the book. This will slow down Tether’s and Circle’s efforts to attract mainstream financial investors.
• I expect the Fed to cut interest rates by a lot during the remaining 3-1/2 years of the Trump Administration. Some cuts will happen under the current Fed Chair. A lot more will come by his successor beginning June 2026. Lowering interest rates by 100-200 basis points will cripple stablecoin issuers’ main income.
In my opinion, the high dependency in growth and interest rate policies make NYSE:CRCL a very risky investment at the current lofty valuation.
Bullish Signal for Bitcoin
In the past, stablecoins were mainly used by crypto investors. Going forward, mainstream investors will find compelling offerings from their banks, stockbrokers and credit card companies. When mainstream financial intermediaries begin making serious inroad into cryptos, there will be a paradigm shift.
In my opinion, the new development in stablecoins will supercharge the growth of crypto market size. Bitcoin, being well established as a Digital Gold, will benefit the most from the global asset reallocation to cryptocurrencies.
An investor sharing a bullish view on bitcoin could explore the CME Micro Bitcoin Futures ( LSE:MBT ).
Last Friday, the August MBT contract (BTCQ5) was settled at 108,640. Each contract has a notional value of 0.1 bitcoin, or a market value of $10,864. To buy or sell 1 contract, trader is required to post an initial margin of $2,598. The margining requirement reflects a built-in leverage of 4-to-1, which is more cost-effective that buying bitcoins from any ETF fund.
A long MTC strategy with a stop-loss would enhance the returns while limiting the potential losses. Below is a hypothetical trade for illustration purposes only:
On Day T+0, buy 1 BTCQ5 at 108,640 and set a stop loss at 105,000
• The portfolio value is 10,864
• Upfront margin is $2,598
Rising Bitcoin Scenario: On Day T+N, Bitcoin goes up 20% to $130,368
• Futures gain will be $2,172.8 (= (130368-108640) x 0.1)
• Investment return will be +86.6% (= 2172.8 / 2598), excluding transaction fees
• This compares to a 20% gain with bitcoin ETF, with no leverage
Falling Bitcoin Scenario: On Day T+N, Bitcoin drops 20% to $86,912
• With a stop-loss at 105,000, losses will be capped at $364 (= (108640-105000) x 0.1)
• Investment return will be -14% (= -364 / 2598)
• This compares to a 20% loss with bitcoin ETF, with no stoploss provision
Happy Trading.
Disclaimers
*Trade ideas cited above are for illustration only, as an integral part of a case study to demonstrate the fundamental concepts in risk management under the market scenarios being discussed. They shall not be construed as investment recommendations or advice. Nor are they used to promote any specific products, or services.
BTCK2025 trade ideas
Strategy H2 2025. BTC Airless Plot Near $100'000 Choking PointOver the past 6 months, Bitcoin (BTC) has demonstrated a very mixed up/down performance, marked by significant price fluctuations, appreciation and volatility.
From late December 2024 to June 2025, BTC's price rose from approximately $92,000 to around $108,000, representing a gain of about 17.26% over this period.
On the other hand. the price fluctuated between last price in 2024 $92,000 and BTC' low near $74,491 achieved in early April 2025, posting the similar, nearly 20 percent year-to-date decline.
Bitcoin's price trajectory during this time was influenced by several factors. Early in 2025, BTC reached a new all-time high near $109,000 but faced a pullback triggered by profit-taking and macroeconomic uncertainties, dropping nearly 30% to about $74,000 by April. This decline was short-lived, as Bitcoin quickly rebounded by roughly 24%, climbing back to mid-$90,000 levels and eventually surpassing $100,000 again by June, signaling wide range fluctuations are getting for longer.
The technical setup suggests that Bitcoin is poised for further swings around $100'000 choking point.
In summary, Bitcoin’s performance over the last six months has been characterized by sharp correction, mixed technical buy and sell signals, with no any solid fundamental support from institutional investors.
These factors collectively indicate a mixed outlook for BTC, with further price fluctuations in wide range, as a mid-term pricе action perspective for H2 2025 and for longer.
Similar like a year ago 52-week SMA could be considered as major support level.
--
Best wishes,
@PandorraResearch Team 😎
Bitcoin UpdateWe’re back looking at the #Bitcoin chart. While BTC stays above the 55-day MA (currently at 101,116), we remain overall bullish. But here’s the catch:
🔍 What I’m watching:
• The MACD is still below zero — no clear buy signal yet.
• The RSI is encouraging (above 50), but…
• 📉 No surge in volume = caution.
• DMI also not giving a strong green light.
👉 So, we might need more consolidation before the next leg higher. Patience is key!
If BTC clears these highs?
🎯 I’d target ~114,000 (top of the long-term channel since 2021).
For now, staying positive but waiting for that volume confirmation. 💪
Disclaimer:
The information posted on Trading View is for informative purposes and is not intended to constitute advice in any form, including but not limited to investment, accounting, tax, legal or regulatory advice. The information therefore has no regard to the specific investment objectives, financial situation or particular needs of any specific recipient. Opinions expressed are our current opinions as of the date appearing on Trading View only. All illustrations, forecasts or hypothetical data are for illustrative purposes only. The Society of Technical Analysts Ltd does not make representation that the information provided is appropriate for use in all jurisdictions or by all Investors or other potential Investors. Parties are therefore responsible for compliance with applicable local laws and regulations. The Society of Technical Analysts will not be held liable for any loss or damage resulting directly or indirectly from the use of any information on this site.

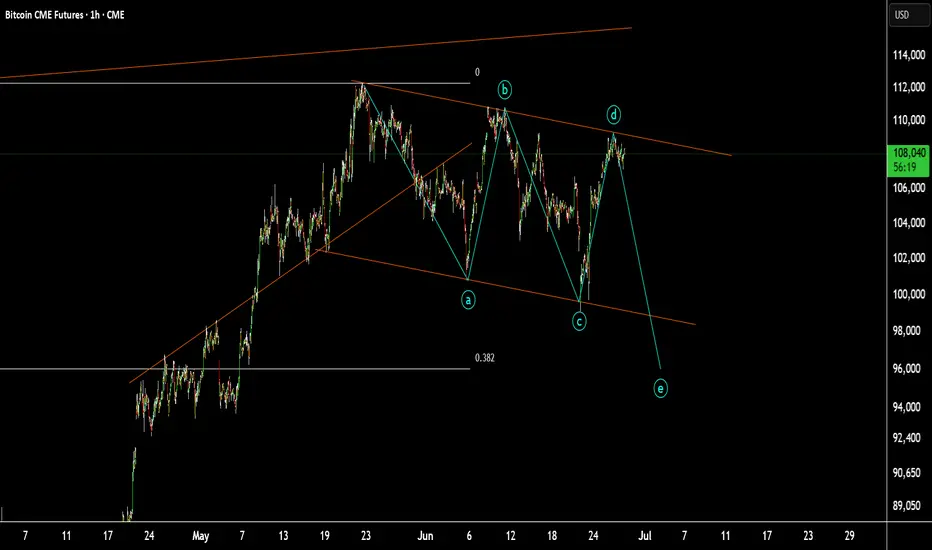
BTC CMECRYPTOCAP:BTC CME :
If it couldn't break the channel it will be drop to 95k or fib 0.382.
so it's better to be careful guys.
Mastering Bitcoin Trends with the 55-Week Moving AverageMastering Bitcoin Trends with the 55-Week Moving Average: A KISS Approach to Trading
I want to emphasize the KISS principle—and provide an example of using the 55-week moving average (MA) on the Bitcoin chart. This is a great demonstration of how simple tools, when applied with consistency and insight, can be incredibly powerful.
Here’s a breakdown of how and why the 55-week MA has proven effective as a trend-following and risk-management tool for Bitcoin:
________________________________________
✅ 1. Trend Identification (Bull vs Bear Mode)
• Above the 55-week MA: Historically, Bitcoin has shown strong bullish momentum when it closes consistently above this level.
• Below the 55-week MA: When the price dips and stays below, it tends to coincide with bear markets or extended corrective phases.
• Why 55 weeks? It captures just over a year’s worth of price data, which filters out shorter-term noise and gives a solid picture of the macro trend.
________________________________________
✅ 2. Mean Reversion
• During bullish trends, pullbacks to the 55-week MA have often acted as dynamic support.
• This allows traders to buy the dip confidently when price retraces to that average, assuming the longer-term uptrend remains intact.
________________________________________
✅ 3. Position Management (Adds & Stops)
• Adding to positions: When Bitcoin bounces off the 55-week MA, that point becomes a high-probability area to add to existing longs.
• Stop placement: If you enter on a bounce off the MA, a stop just below it (on a closing weekly basis) can define your risk clearly.
________________________________________
✅ 4. Simplicity and Objectivity
• No indicators, no oscillators, no complex systems—just price and one moving average.
• This eliminates analysis paralysis and helps you stay focused and consistent with your trading decisions.
________________________________________
Example Summary (Past Behaviour):
• 2016–2017 bull market: Price remained consistently above the 55-week MA. Dips to it were prime buying opportunities.
• 2018 bear market: Clear breakdown and failure to reclaim the 55-week MA—early signal of sustained weakness.
• 2020–2021 bull market: Once reclaimed, it held beautifully on corrections, validating bullish momentum.
• 2022 crash: Consistent failure to hold above it confirmed bearish environment.
________________________________________
🧠 Final Thoughts:
You don’t need 20 indicators when one well-chosen line does the job across multiple dimensions: trend-following, mean reversion, and risk control. The 55-week MA, when applied to Bitcoin, respects the KISS principle to perfection—clean, visual, effective.
Disclaimer:
The information posted on Trading View is for informative purposes and is not intended to constitute advice in any form, including but not limited to investment, accounting, tax, legal or regulatory advice. The information therefore has no regard to the specific investment objectives, financial situation or particular needs of any specific recipient. Opinions expressed are our current opinions as of the date appearing on Trading View only. All illustrations, forecasts or hypothetical data are for illustrative purposes only. The Society of Technical Analysts Ltd does not make representation that the information provided is appropriate for use in all jurisdictions or by all Investors or other potential Investors. Parties are therefore responsible for compliance with applicable local laws and regulations. The Society of Technical Analysts will not be held liable for any loss or damage resulting directly or indirectly from the use of any information on this site.

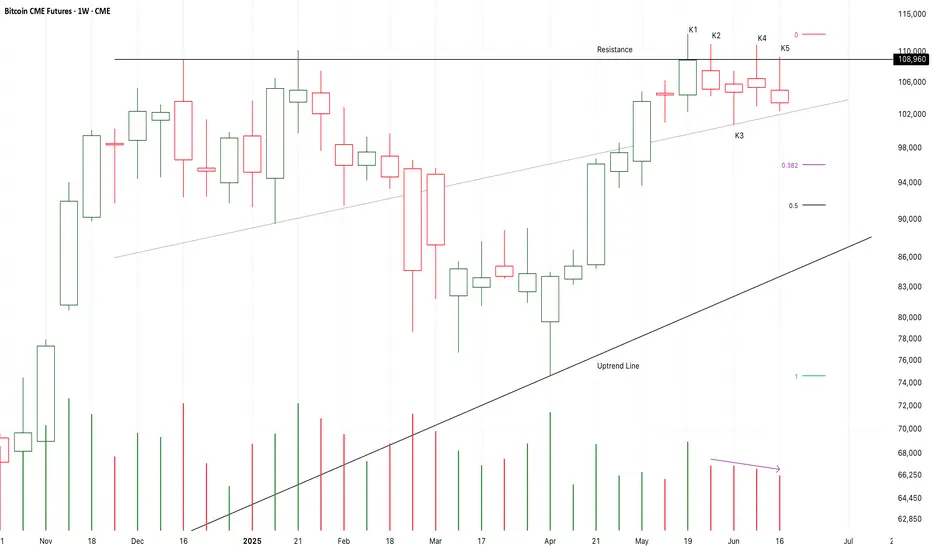
Chart Pattern Analysis Of Bitcoin
K5 close below K2,
It verified the resistance or the bear gap at K2.
It seems that the following candles will fall to test 0.382-0.5fib area.
I will try to buy it there.
I don’t think the three years bull market will be terminated here,
I am expecting another bull run to test or break up the resistance again.
On the other hand,
If K6 or the following candles finally close below 0.5fib line or the uptrend line,
A potential double top bear market will finally come up.
Long-96888/Stop-95888/Target-115K
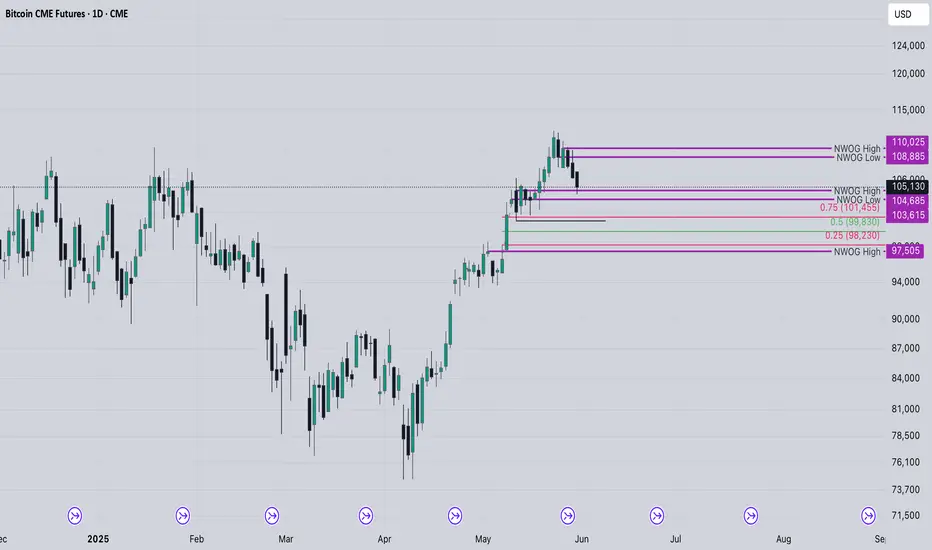
BTC short term I expect to see the retest of the highlighted area such as the 100k$ level, where we left the closest imbalance unfilled after taking the highs and not spooling higher, I assume we receive some kind of distribution during the summer in the range from ATH to the marked levels, after which we would have to see whether the structure will allow us for the continuation of the trend if it shows strong reaction and just wicks through the highlighted levels
Generally, I think we are close to the pivot point but still have some time for other assets to show if they want to perform, when everyone will be buying in the range which likely be part of the distribution for BTC, I refrain from any long term investments or long speculations. Might trade some swings though if the range offers such.
If we continue going higher conservatively looking I think 120-130 k will be the maximum we can spool towards
Bitcoin Under Pressure but Eyeing BreakoutThe market remains bullish, but the price has been strongly rejected multiple times in the
108.980 – 108.085 zone. We'll have to see how it reacts.
In my view, Bitcoin appears to be setting up to break through the resistance zone between 114.130 and 109.520. If it manages to break above, we could see higher price levels ahead.
⏱ Keep an eye on the market in real time.
BITCOIN (BTC) Analysis For The WeekI've been studying BTC and others and want to share my analysis. Trading involves probabilities, so it's essential to be confident and prepared. Study the market thoroughly before trading with real money.
Let's test strategies this week. You may use a live account if you have capital, and manage your stop losses carefully. Next week, I'll provide more details on entry points and stop losses. Wait for trades at specified levels and avoid positions in the middle to minimize losses. Be patient and trade from one edge to the other.
Good luck and make money.
For one-on-one sessions: $20k per person. You'll learn weekly, monthly, and yearly calculations. Weekly subscriptions are also available for $500 per person.
ETH: Buying in the DipCME: Micro Ether Futures ( CME:MET1! ), #microfutures
On May 22nd, #Bitcoin reached a new all-time high of $111,814. The king of cryptos rallied as bullish sentiment built up behind the most pro-crypto U.S. administration. As of last Friday, bitcoin realized a one-year return of +90.8%. For comparison, holding S&P 500 only yields 11.8% for a year, even after the US stock index made its ATH last week.
Meanwhile, #Ethereum, second only to Bitcoin in the cryptocurrency world, experienced a dramatic decline in 2025. ETH is currently trading around $2,500, down 40% since December. It is a far cry from its ATH of $4,815 on November 9, 2021.
Why Is Ethereum (ETH) Falling?
The most significant challenge facing Ethereum is the proliferation of Layer 2 scaling solutions. Networks such as Arbitrum, Base, and Optimism were developed to address Ethereum's scalability issues, but they've created a revenue problem for the main chain.
When users conduct transactions on these Layer 2 networks, transaction fees flow to third-party organizations rather than to the Ethereum network itself. Revenue diversion has weakened Ethereum's economic model.
Ethereum could counter the revenue erosion by implementing a fee on Layer 2 transactions. However, it would undermine the very purpose of these networks. Layer 2 solutions were designed specifically to reduce transaction costs by processing operations off-chain and submitting only batched results to the main network. Adding fees would increase costs and diminish their competitive advantage.
Increased competition in the blockchain space has further eroded Ethereum’s dominance. Investors have been withdrawing funds from Ethereum and redirecting them to competing projects with potentially better returns or technological advantages.
Future Outlook
Ethereum’s path forward appears challenging. While the platform still hosts thousands of decentralized applications and maintains a large developer community, its economic model is under pressure from multiple directions. Without finding new ways to generate value, Ethereum may continue to lose market share to more nimble competitors.
The platform’s supporters point to upcoming technical improvements and the maturation of the proof-of-stake consensus mechanism as potential catalysts for recovery. The recent approval of staking enabled ETF for Ethereum in Hong Kong is one of the ways forward. However, with increasing competitive pressures, Ethereum faces an uphill battle to reclaim its former status as the undisputed leader in smart contract platforms.
While the future remains challenging, Ethereum still has upside potential at the current price level. As ETH dropped below $1,500 in April, bargain hunters came in to scoop it up. As a result, ETH had a spectacular rebound of 70% in the last three months, outrunning Bitcoin’s 25% gain for the same period.
There are over 17,000 cryptocurrencies in existence, according to Coin Gecko. However, only a handful of them have proven to have a lasting investment value. We could refer to Bitcoin and Ethereum as the digital form of Gold and Silver. Historical trend shows that the spike in gold prices would likely prompts investors to buy silver at a lower cost, helping maintain a stable Gold/Silver price ratio. The same could be true for the BTC/ETH relationship.
For extensive reading, please refer to my Editors’ Picks, The Gold-Silver Ratio Explained, published on TradingView on April 28th.
Recent regulations on #stablecoins in the US and Hong Kong are good news to the crypto space. It legitimates crypto offerings from mainstream financial institutions. Bitcoin is positioned for another big lift as investors reallocate assets into cryptos.
On July 4th, President Trump signed into law the “Big and Beautiful Bill”. Above all, this massive package funds deficit spending and raises the national debit by $5 trillion. While we will carry the debt burden for many years, in the short run, injecting huge liquidity into the economy and the financial market would pop up asset prices.
The latest CFTC Commitments of Traders report shows that, as of June 24th, the total open interest for Micro Ether futures are 128,500 contracts.
• Leverage Fund has 94,167 in long, 112,442 in short, and 1,854 in spreading
• The long-short ratio of 0.84 does not provide a good indication of what the “Smart Money” views about Ethereum.
In summary, I hold the view that ETH may regain ground above 3,300 before year end. Investors sharing this bullish view could explore CME’s Micro Ether Futures ( NYSE:MET ).
Long Futures with Stop Loss
Last Friday, the August Ether Futures contract (METQ5) was settled at 2,518. Each contract has a notional value of 0.1 ETH, or a market value of $251.8. To buy or sell 1 contract, a trader is required to post an initial margin of $84. The margining requirement reflects a built-in leverage of 3-to-1. It’s cost-effective to invest with CME MET futures, vs. buying ETH from the spot market.
Let’s use a hypothetical trade to illustrate how the long futures with stop loss strategy would compare with buying spot ETH.
Hypothetical Trade:
• Buy 1 METQ5 contract at 2,518, and set a stop loss at 2,400
• Trader pays $84 for initial margin
High Price Scenario: Ethereum rises to $3,000
• Futures gain will be $48.2 (= (3000-2518) x 0.1)
• Futures return will be +57.4% (= 48.2 / 84)
• This compares to a 19.1% for investing in spot ETH. (= (3000 /2518) – 1)
Low Price Scenario: Ethereum drops to $2,000
• Futures stop loss at 2,400, and the maximum loss is $11.8 (= (2518-2400) x 0.1)
• Futures return will be -14% (=11.8 /84)
• This compares to a 20.6% loss for investing in spot ETH. (= (2000 /2518) – 1)
The above scenarios show that
• When ETH goes up, futures will have higher returns due to its leverage nature.
• When ETH falls, the stoploss will kick in to reduce losses.
Happy Trading.
Disclaimers
*Trade ideas cited above are for illustration only, as an integral part of a case study to demonstrate the fundamental concepts in risk management under the market scenarios being discussed. They shall not be construed as investment recommendations or advice. Nor are they used to promote any specific products, or services.
CME Real-time Market Data help identify trading set-ups and express my market views. If you have futures in your trading portfolio, you can check out on CME Group data plans available that suit your trading needs tradingview.sweetlogin.com

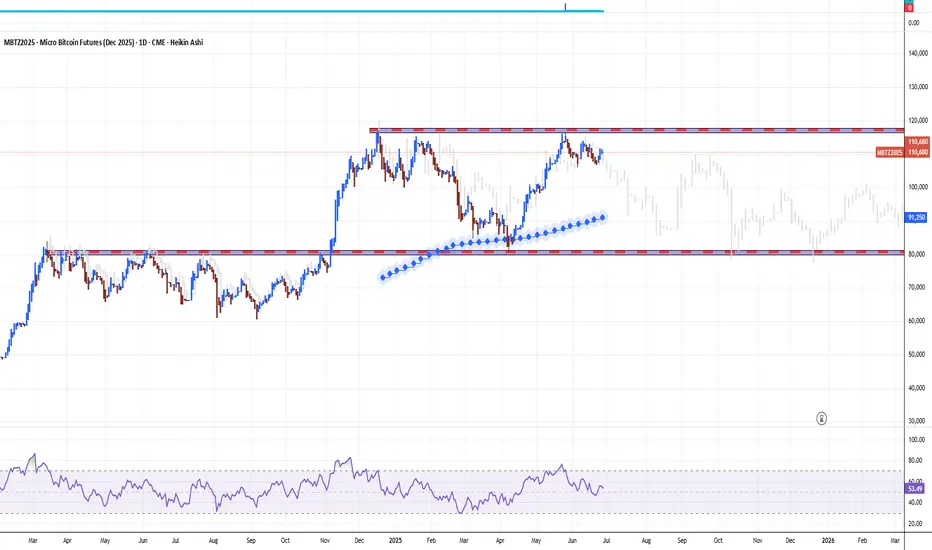
MBT! - Risk reward in favour for longs!After taking continuous supports from AVWAP there is bullish bias in Bitcoin. We remain in a higher high, higher low structure on every time frame from D to H1. Each pivot breakout(marked in green) will be opportunity to add more to your positions.

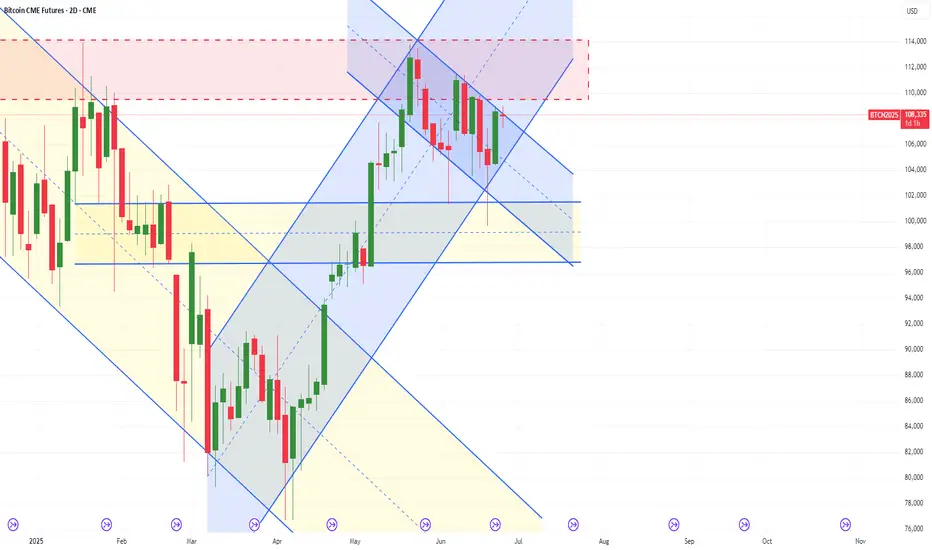
Bitcoin Symmetrical Triangle & another pattern formingBTC is currently trading in a Symmetrical Triangle formation.
This is generally a continuation pattern.
There's also a longer term BTC pattern FORMING.
Do you see it?
Inverse Head & Shoulder.
But it is a ways off, time will tell.
Bitcoin Crypto
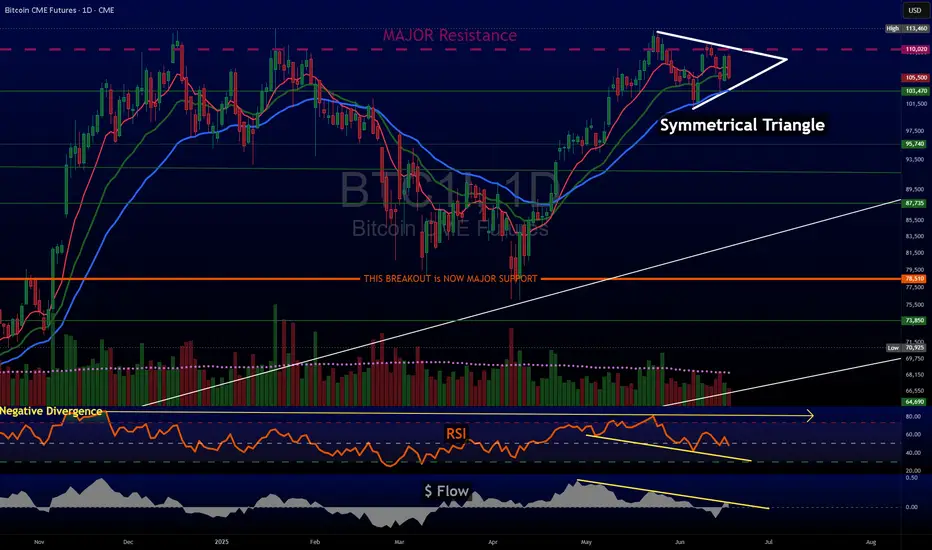
Chart Pattern Analysis Of Bitcoin
There are 4-5 candles consolidate around the resistance,
And the demands keep decreasing.
Compared to K3,
the demand at K4 increased, but it failed to close upon K3.
If K5 is a doji candle close at low price area,
Or,If K5 starts with a bear gap to close below K4,
It is likely that the following candles will fall to test 0.5fib area.
I will try to buy it there.
But now, I will cut off at least half of my long positions if I bought it earlier.
On the other hand,
It is also possible that K5 break up K4 and even close upon it.
That case will be out of my ability to take profit from it.
Short-107444/Stop-108444/Target-92K

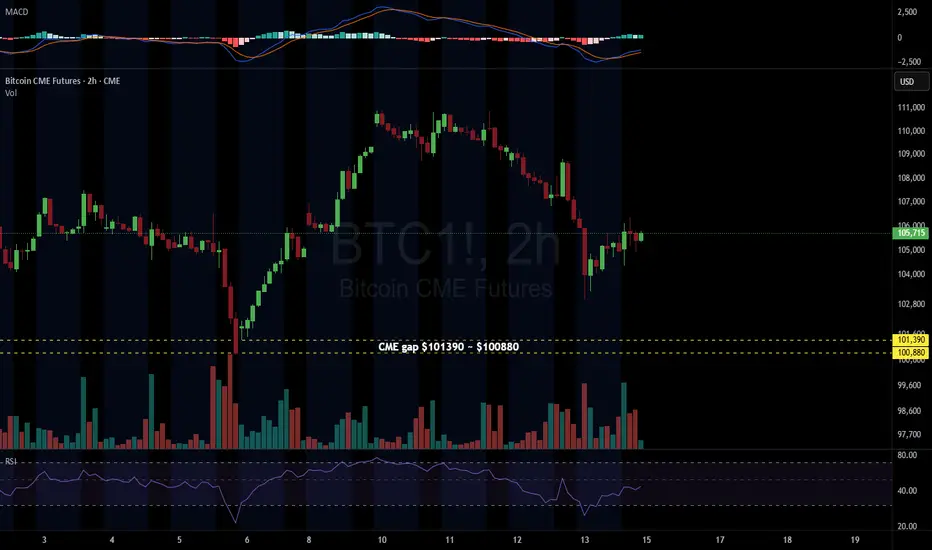
BTC 2H#BTC
All Eyes on the CME Gap: $101,390 – $100,880 📉
Given the heightened geopolitical tensions between Iran and Israel, market volatility remains elevated.
🎯 There’s a strong probability this gap will be filled.
⚠️ Trade cautiously and always use a stop-loss to protect your capital.
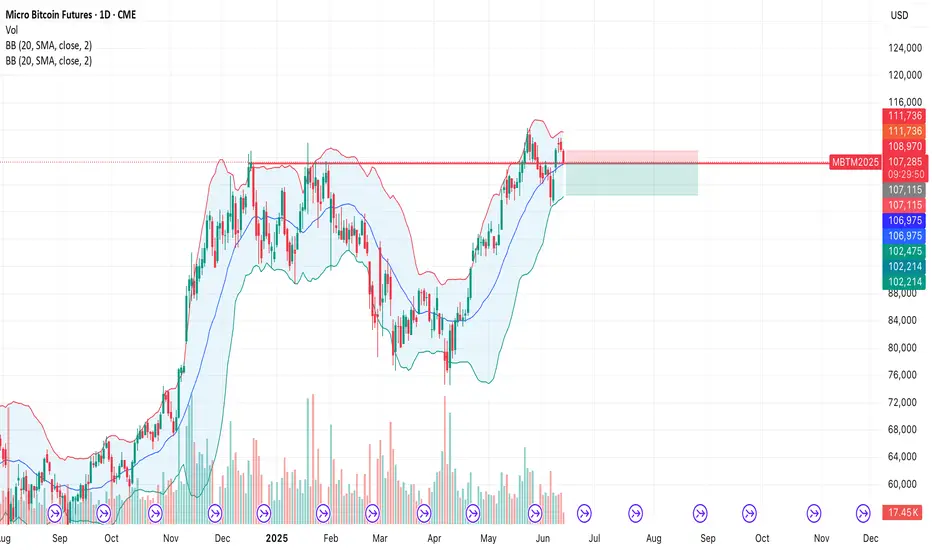
Micro Bitcoin Futures-MBTCME:MBT1! I’ve entered a short position on Micro Bitcoin Futures (MBT1!) based on a potential mean reversion setup.
Price recently touched the upper Bollinger Band and met resistance near the 109–110 zone. Given the overextension and slowing momentum, I’m anticipating a pullback toward the lower band, aligning with previous support around 102.7.
Entry: 107,400
Target: 102,740 (+4.33%)
Stop-Loss: 109,255 (−1.73%)
Risk/Reward Ratio: 2.5
This setup is driven by the classic Bollinger Band strategy – shorting near the upper band with confirmation from resistance and aiming for a reversion to the mean. Let’s see how this plays out.
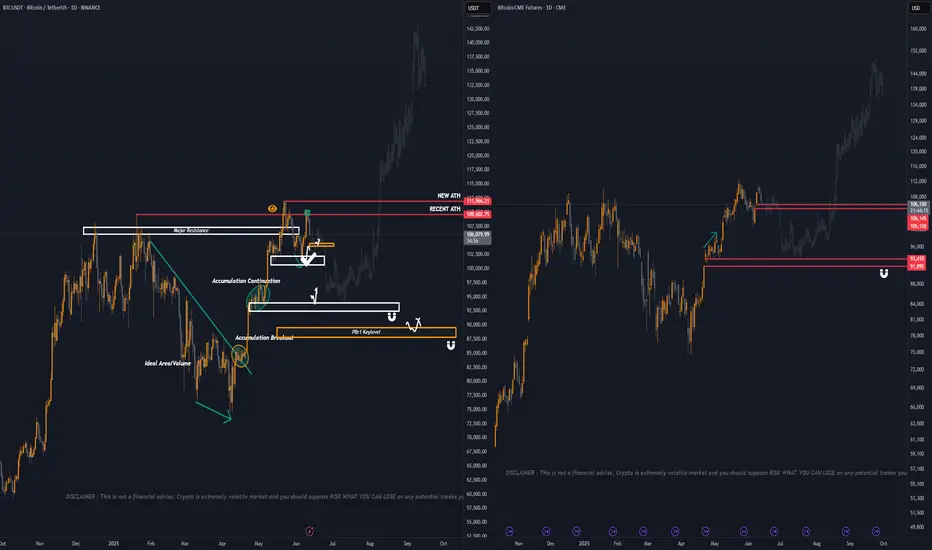
Bitcoin Update + Bitcoin CME Gap CONFLUENCE
POSTING FOR AWARENESS NOT TO PANIC Y'ALL, True trader will be optimistic as always and can play both sides of market. 💯
Just incase PBr1 won't hold as aggressive bounce base on my recent update, Since nandun ang possible aggressive volume sa short term PBr1 for possible breakout sa ATH i just want to tell you ahead if ever market will not respect short term PBr1 — Two Major Support are waiting below
— First, 94k range area
— Second, Base my own strat overall structure PBr1 support 88k - 89.5k range area
will just drop this idea just incase may possible waiting area na kayo for confluence sa possible DCA or if you have a decent short swing also pwede maging confluence for your exit points.
📍 PINNED, always remember BITCOIN is just one of our major coin confluence to our altcoins trades. Trade base price action not emotion.
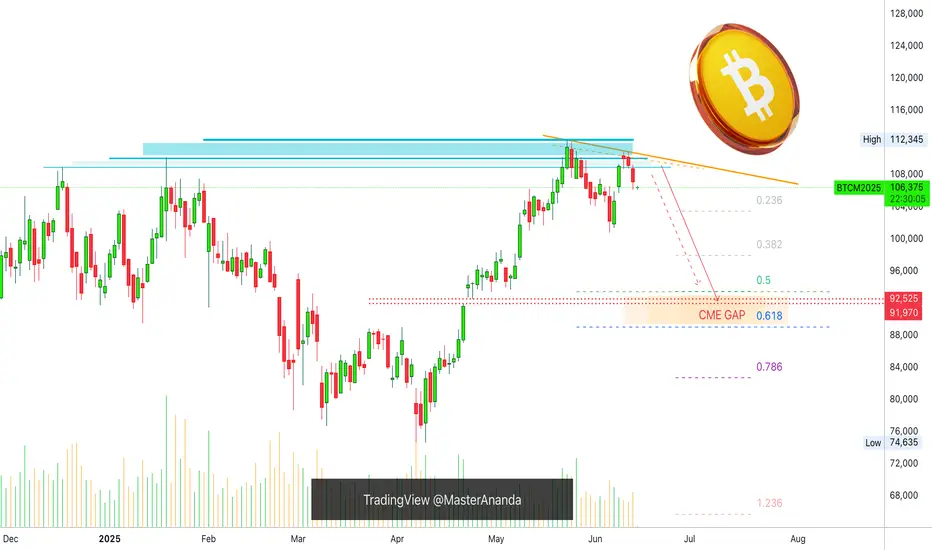
5 Bearish Signals —Bitcoin CME Gap (91,970 - 92,525)Bitcoin's bearish bias is confirmed clearly. Bearish signals are starting to pile up one on top of the other, let's recap those real quick:
1) Bitcoin is trading below its December 2024 high, it's January 2025 peak price and the recent 22-May all-time high. Trading below these levels open the doors for a move downward.
2) Recent lower high. 10-June closed lower compared to 22-May. This is a local lower high.
3) Overall low volume. Total volume decreasing since January 2025. No strong buying activity.
4) Sustained growth. Bitcoin grew straight up for 45 days. It is normal to see a retrace after sustained growth.
5) CME Gap. This is the latest signal that came to my attention and this gives further strength to the bearish case. The GAP sits between $91,970 and $92,525.
It is likely that Bitcoin will move lower before producing a new all-time high. Bitcoin is not likely to move below 80K. This is very unlikely.
Most likely Bitcoin will find support above 90K and if it moves below 90K this might be a brief occurrence lasting only a few hours or a few days at max. When all is set and done, we will continue to see long-term growth based on a bullish structure of higher highs and higher lows. The 7-April bottom will remain untouched.
Namaste.
ETH ShortETH & BTC have similar POIs but BTC approaching much sooner. I think BTC could go higher, allowing ETH to push into the zone and simultaneously creating BOS for BTC which would then turn into another opportunity (for Buys) later

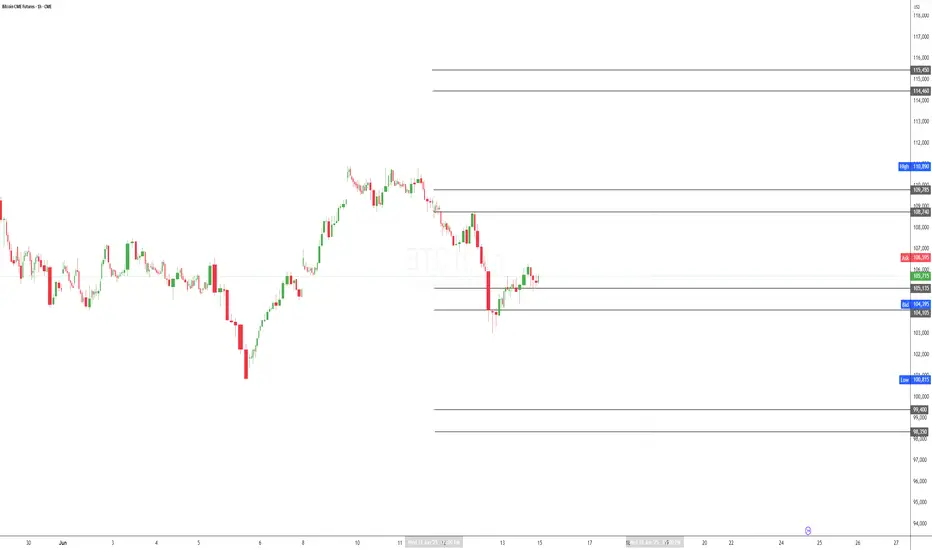
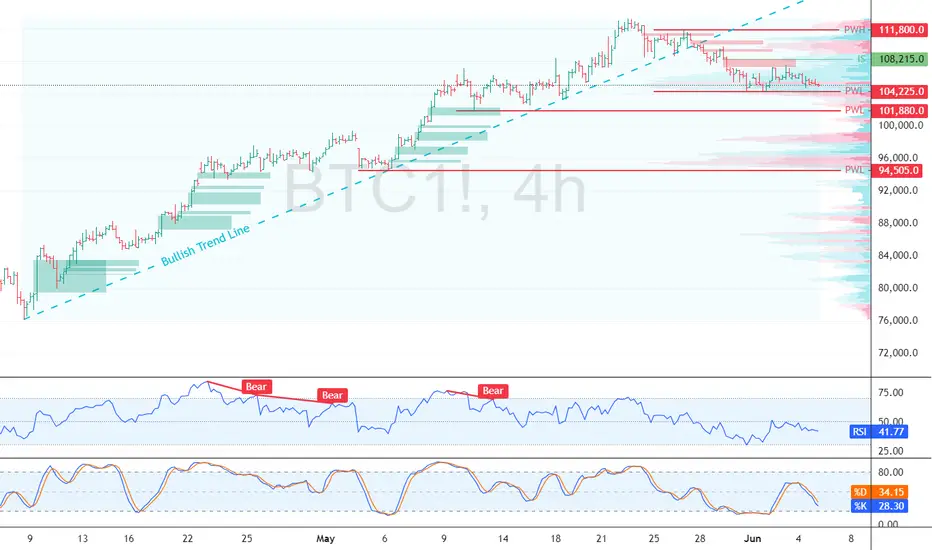
Bitcoin’s Bearish Signal: Key Levels to WatchFenzoFx—Bitcoin consolidates near $104,225 after breaking below the bullish trendline, signaling a possible break of structure. This level acts as immediate support, and a bearish wave could form if BTC closes below it, targeting the $101,880 demand zone.
The bearish outlook remains valid unless Bitcoin surpasses $108,215. If broken, price could rise toward $111,800.
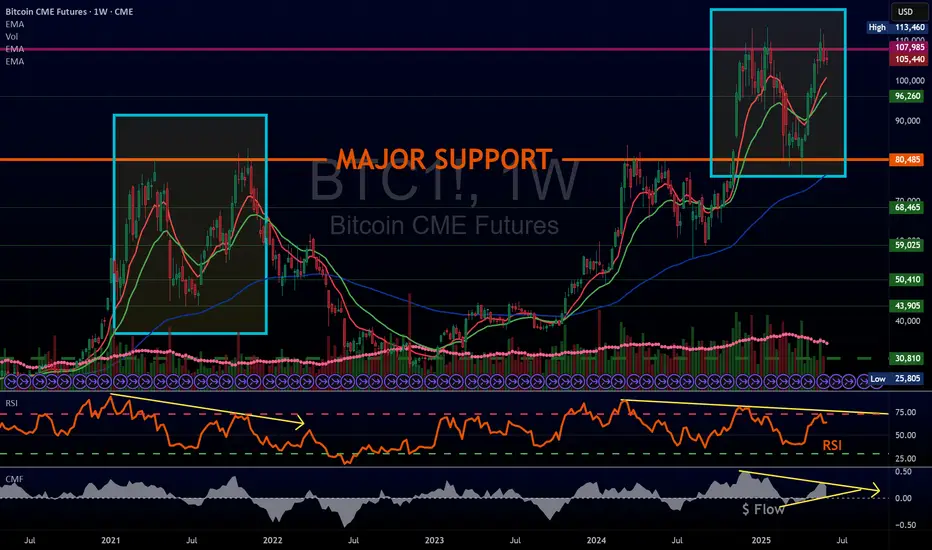
2/2 Bitcoin looks similar to 2021Post 2 of 2
#Bitcoin is trading similarly to 2021.
Major difference? The move is more ORGANIZED today.
Volume is substantially more.
Did #BTC top, like really top?
We want to say no, but things can change!
Current:
$ Flow is much weaker vs December 24 top.
RSI is lower as well.
It looks like CRYPTOCAP:BTC will likely break 100k again, 95k IMO.
80k = IMPORTANT AREA!
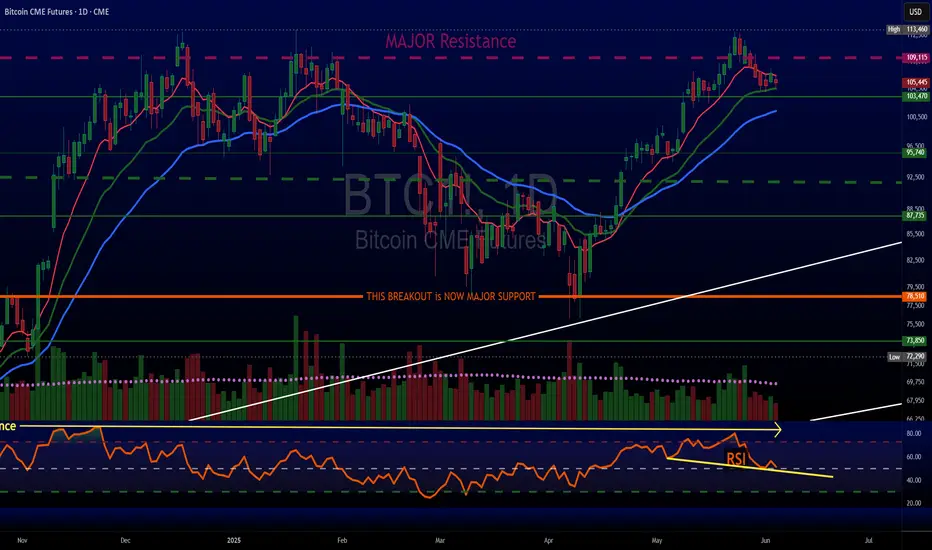
1/2 Bitcoin call was good, so far, short term top in placeNot long after our post May 20th we began to sell some CRYPTOCAP:BTC ETF's. It was a good call, still have some, & we believe #Bitcoin still has consolidation in order.
We're waiting to see how the #BTC RSI reacts & wow it reacts to the Green Moving Avg.
Selling volume is light & this means that there is a LACK of BUYERS, at least for now.
#crypto
Please see our profile for more info on posts.
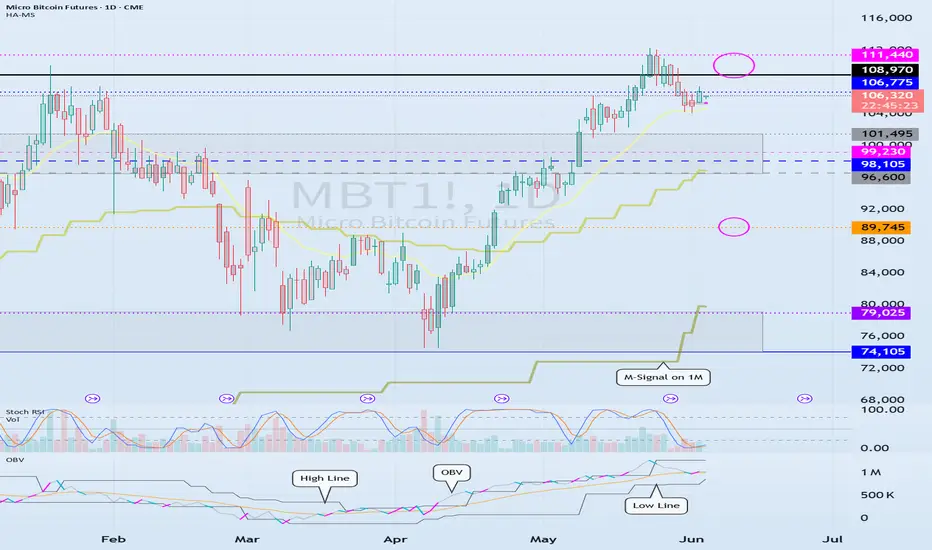
Check support near 106775
Hello, traders.
If you "Follow", you can always get new information quickly.
Have a nice day today.
-------------------------------------
(MBT1! 1D chart)
The prerequisite for the previous ATH to rise above is that the OBV must rise above the High Line and remain there.
Accordingly, the key is whether it can be supported and rise near 106775.
If it fails to rise, it is likely to fall to the 96600-101495 area.
The 96600-101495 area is an important support and resistance area for continuing the uptrend.
Therefore, if it falls in the 96600-101495 area, it is likely to fall sharply.
If it falls,
1st: Around 89745
2nd: M-Signal indicator on the 1M chart or 74105-79025
You should check for support near the 1st and 2nd areas above.
Therefore, the 96600-101495 area can be seen as an important support and resistance area.
-
(30m chart)
It played the role of support and resistance by touching the area around 105385 several times.
It is expected to determine the trend again when it meets the M-Signal indicator on the 1D chart.
-
Thank you for reading to the end.
I hope you have a successful trade.
--------------------------------------------------
- Here is an explanation of the big picture.
(3-year bull market, 1-year bear market pattern)
I will explain the details again when the bear market starts.
------------------------------------------------------
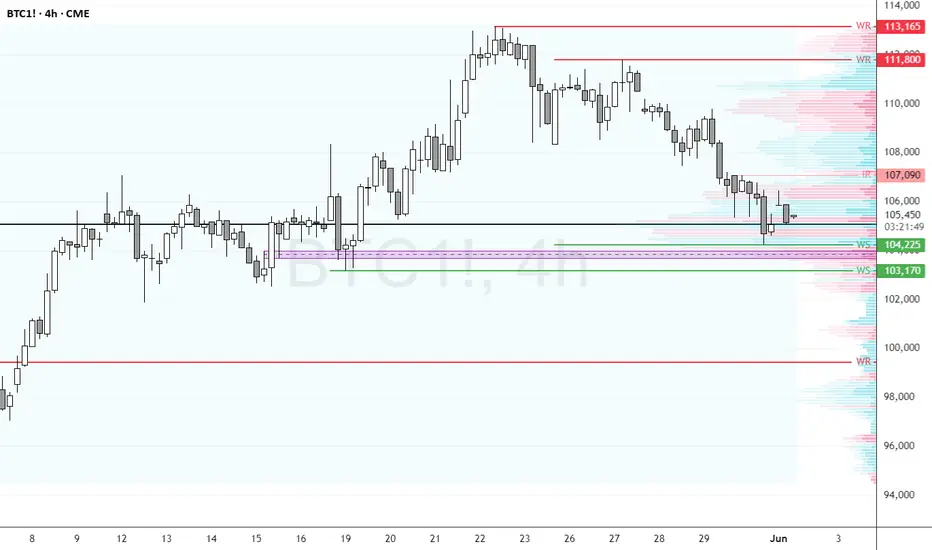
BTC Faces Critical Resistance—Breakout or Further Decline?FenzoFx—Bitcoin continues its bearish trend after hitting its 2025 all-time high at 113,165. BTC/USD is currently trading near $105,400, a high-volume area where price could either bounce or break lower.
The key resistance level rests at $103,170, supported by a bullish Fair Value Gap. If price holds above this zone, Bitcoin could rise toward $107,090.
However, a close below $103,170 would invalidate the bullish outlook, with the next bearish target at $99,435.