S&P 500 (ES1): Post FOMC, Buyers Pushing Back To The Highs!In this video, we will analyze the following FX market for July 31 - Aug 1st.
S&P 500 (ES1!)
In the Weekly Forecast for the S&P 500, we highlighted:
- price is bullish, and expected to go higher. It did move to ATH before pulling back.
- the sell side liquidity under the ascending lows would draw price.... which it did.
- the Area of Fair Value below the lows, with the Demand Zone as the potential level where a
a high probability long could setup.... which was spot on!
Did you benefit from the forecast? Let me hear from you if you did, in the comment section.
Enjoy!
May profits be upon you.
Leave any questions or comments in the comment section.
I appreciate any feedback from my viewers!
Like and/or subscribe if you want more accurate analysis.
Thank you so much!
Disclaimer:
I do not provide personal investment advice and I am not a qualified licensed investment advisor.
All information found here, including any ideas, opinions, views, predictions, forecasts, commentaries, suggestions, expressed or implied herein, are for informational, entertainment or educational purposes only and should not be construed as personal investment advice. While the information provided is believed to be accurate, it may include errors or inaccuracies.
I will not and cannot be held liable for any actions you take as a result of anything you read here.
Conduct your own due diligence, or consult a licensed financial advisor or broker before making any and all investment decisions. Any investments, trades, speculations, or decisions made on the basis of any information found on this channel, expressed or implied herein, are committed at your own risk, financial or otherwise.
ESU2016 trade ideas
07/29/25 Trade Journal, and ES_F Stock Market analysis EOD accountability report: +734
Sleep: 5 hours
Overall health: Been struggling with sleep due to heat waves
VX Algo System Signals from (9:30am to 2pm)
— 8:00 AM Market Structure flipped bearish✅
— 9:30 AM VXAlgo NQ X3 Buy Signal✅
— 9:36 AM Market Structure flipped bullish on VX Algo X3! ❌
— 11:49 AM VXAlgo ES X1 Buy signal✅
— 11:59 AM VXAlgo NQ X1 Buy Signal❌
What’s are some news or takeaway from today? and What major news or event impacted the market today?
Today was one of the few short the resistance day and refreshing to see after we been grinding ATH (all time highs)
News
— 1:30 PM
🇺🇸🇨🇳 *CHINA SAYS IT AGREES WITH US TO EXTEND TARIFF TRUCE
What are the critical support levels to watch?
--> Above 6395= Bullish, Under 6374= Bearish

This is a focus the Index marketIt's Sunday and you might want to look at the S&P when the Market opens later tonight. For 2 days the S&P went lower and I think you can categorize this as an expanding Market and it's very tradable. You can even miss the trade on Thursday and still make a good return on Friday. Also I would call this a spike pattern and my assumption is that the market had a range on the first day that was Thursday and then it doubled the range on Friday. There's very good volatility in the S&P and I believe there is an order to it that can help you find trades that otherwise leave you with no options when they really do exist. At the end of the video I put on a range box by definition it can't be a perfect box because I need a little bit more information probably on Monday but it might be Tuesday..... And it doesn't always work but if you take this approach to the market and if you use the tools that I work with including 2 bar reversals and you're willing to Short because sellers are who are making money on the S&P on Thursday and Friday and possibly own Monday. Most Traders will never short .... And they will miss tremendous opportunity. I will follow up on this Market on Monday or Tuesday.

Choppy all day till 11AM PTLooks like it'll be one of those days until 11 :(
What are your thoughts?
Call trade nasdaq? Curious to know how other sectors are. I only track Mes
Time to catch its breathAfter the break to lower prices in the daily S&P 500 chart, the expectation for Monday is for the market to stop and catch its breath which means are not looking for a big day down on Monday but rather a sideways so only slightly lower move without new fundamental information to stimulate the market.

ES bearish sentiment for Monday aug 4thIll be watching for a bearish set up to form around the bearish 4 hr fvg to take out previous month low

SP500 ShortSP500 is now net short on the regression break.
I am short the Russell2000 from last week and I am considering this trade into Summer.

SP500 E-Mini Futures will pump to 6,442.00 and then dump hardSP500 E-Mini Futures is showing in the lower timeframes a possible continuation at least more 6,30% reaching the 6,442.00 mark and at the same time with some bearish divergences in the higher time frames that if the price gets there could iniate a pullback between 30% and 40% to bring the price back slight below 4,000.00 at the end of next year possibly.
Friday's support clearly shown This is why I use the Accurate Swing Trading System (Ceyhun). Look at it in default configuration on this daily MES1! chart. I drew the red horizontal lines where the indicator line is "flat". That is what I am trying to show you. An "Emergent Quality" of the indicator. I note the line at 6,241 and the LOD at 6239.50. ( line at 6318 failed to support the price) My experience with it says it's better than Fibonacci, Camarilla etc. Where do we go from here?.....The market will show us....Let the Ceyhun show you support and resistance on shorter term charts....You will be glad you did. Happy Trades. DAP

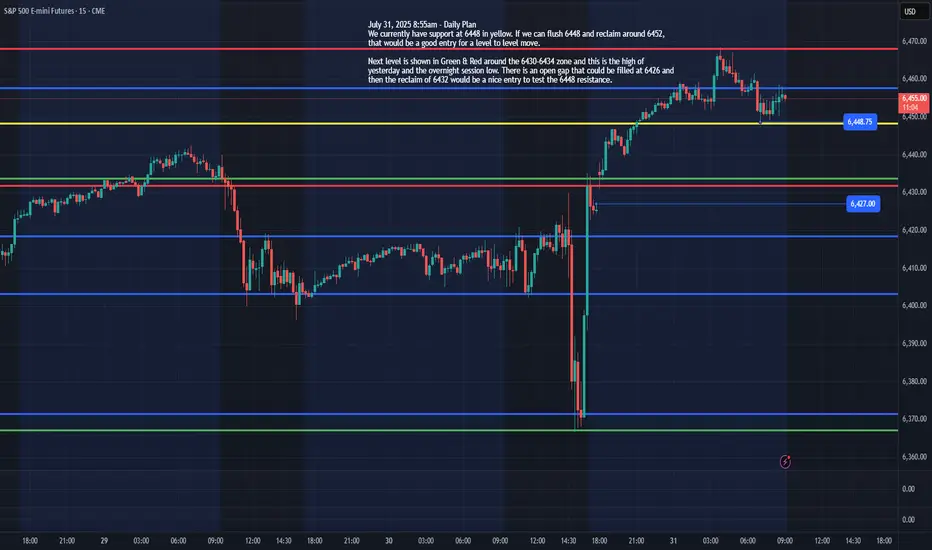
ES - July 31st Daily PlanJuly 31, 2025 8:55am - Daily Plan
We currently have support at 6448 in yellow. If we can flush 6448 and reclaim around 6452, that would be a good entry for a level-to-level move and target 6460, 6468.
Next level is shown in Green & Red around the 6430-6434 zone, and this is the high of yesterday and the overnight session low. There is an open gap that could be filled at 6426 and then the reclaim of 6432 would be a nice entry to test the 6448 resistance, could then continue to move higher to 6460, 6468+.
Those are the areas I will be looking to grab some points today!
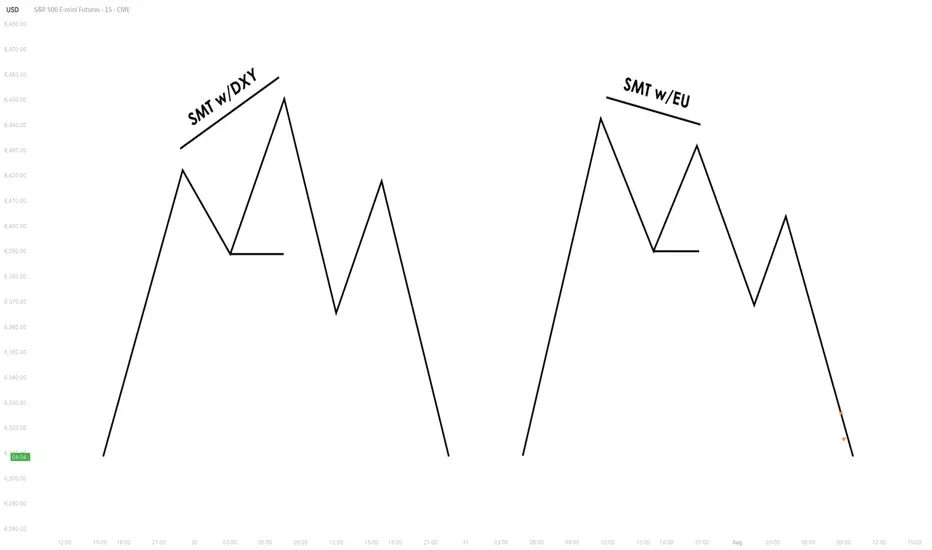
Understanding SMT Divergence In Trading1. Definition and Importance
SMT (Smart Money Technique) Divergence refers to a trading concept that involves identifying discrepancies between the price movement of correlated markets or instruments.
These discrepancies can signal potential market reversals or price manipulation. Specifically, it focuses on the divergence between price movements and indicators (like volume, momentum, or oscillators) in markets that typically move in sync.
In SMT Divergence, traders look for situations where two or more correlated instruments (like
Forex pairs, indices, or bonds) are moving in opposite directions. This "divergence" signals that
there may be a shift in market sentiment, liquidity manipulation, or an opportunity for price
correction.
The importance of SMT Divergence lies in its ability to detect hidden market dynamics that are
often manipulated by institutional players. By understanding these divergences, traders can
gain insights into potential market moves and position themselves accordingly.
2. The Relationship Between Correlated Markets
Understanding these relationships is crucial for identifying SMT Divergence:
Forex Pairs : Many Forex pairs have direct correlations. For example, EUR/USD and USD/JPY are often correlated in the sense that when the USD strengthens, both pairs may exhibit price movement in the same direction (EUR/USD decreases, USD/JPY increases). SMT
Divergence occurs when these pairs move in opposite directions, indicating that something
unusual is happening in the market (e.g., liquidity manipulation or market anticipation).
Indices : Stock market indices (like the S&P 500 or Dow Jones) and related instruments like futures or ETFs can show correlation. A divergence in these indices might indicate potential
trends or reversals, signaling that institutions are positioning themselves for a move in one
direction, and the market is showing resistance.
Bonds : The relationship between bond yields and currency pairs, for instance, can also show correlations. When bond yields move in one direction, certain currency pairs should
generally follow suit. Divergence in this relationship can reveal clues about market
intentions, such as shifts in interest rates or macroeconomic sentiment.
Commodities and Stocks : Commodities like oil and gold can often correlate with indices or specific stocks. For example, if oil prices rise and an energy sector index doesn’t move in the
same direction, this could be a sign of market inefficiencies or institutional positioning.
3. SMT Types
3.1. Bullish SMT Divergence
Bullish SMT (Smart Money Technique) Divergence occurs when one correlated asset forms a
higher low while another makes a lower low. This indicates that one market is showing hidden
strength, suggesting a potential reversal to the upside.
How to Spot Higher Lows in One Asset While the Other Makes Lower Lows:
1. Identify Two Correlated Markets – Choose two assets that typically move together, such as EUR/USD and GBP/USD or NASDAQ and S&P 500.
2. Look for Divergence – Observe when one asset makes a new lower low, while the other fails to do so, instead of forming a higher low.
3. Volume & Price Action Confirmation – Institutions may absorb liquidity in the weaker asset while the stronger one holds its ground.
4. Validate with Market Context – Look at macroeconomic conditions, liquidity pools, and institutional activity to confirm the setup.
3.2. Bearish SMT Divergence
Bearish SMT Divergence occurs when one correlated asset forms a lower high while another
makes a higher high. This signals hidden weakness, indicating that the market may be setting
up for a bearish reversal.
How to Spot Lower Highs in One Asset While the Other Makes Higher Highs:
1. Find Two Correlated Markets – Common pairs include NASDAQ vs. S&P 500 or EUR/USD vs. GBP/USD.
2. Identify the Divergence – One asset makes a higher high, while the other fails to follow and forms a lower high instead.
3. Liquidity & Volume Analysis – Smart money may be using the stronger asset to attract buyers before reversing.
4. Confirm with Institutional Order Flow – Watch for liquidity grabs and imbalance zones.
3.3. Intermarket SMT
Definition : Divergence between assets from different markets, such as Forex vs. Commodities, Stocks vs. Bonds, or Indices vs. the U.S. Dollar.
Examples :
EUR/USD vs. DXY (U.S. Dollar Index) – If EUR/USD forms a higher low while DXY makes a
higher high, this suggests USD weakness and potential EUR/USD strength.
NASDAQ vs. S&P 500 – If NASDAQ makes a higher high but S&P 500 doesn’t, it can indicate
a weakening stock market rally.
Strength & Validity :
High validity because institutions hedge positions across different markets.
3.4. Intramarket SMT
Definition : Divergence within the same market (e.g., multiple Forex pairs or stock indices).
Examples :
EUR/USD vs. GBP/USD – If EUR/USD makes a lower low but GBP/USD doesn’t, it could
indicate bullish strength.
Dow Jones vs. S&P 500 vs. NASDAQ – If NASDAQ is making new highs while the Dow lags, it
may signal weakness in the broader stock market.
Strength & Validity :
Still valid but needs additional confirmation (liquidity sweeps, volume analysis).
4. SMT Divergence vs. RSI Divergence
Why SMT Is Superior to Traditional RSI Divergences
1. RSI Measures Momentum, Not Liquidity – RSI divergence is based on momentum shifts,
which institutions can easily manipulate with fake breakouts or engineered price moves.
2. SMT Focuses on Market Structure & Liquidity – SMT divergence detects institutional
positioning by comparing correlated assets, making it harder to manipulate.
3. RSI Can Remain Overbought/Oversold for Long Periods – Markets can continue trending
despite RSI divergence, while SMT divergence often provides stronger reversal signals.
How Smart Money Manipulates Classic Divergence Traders
Liquidity Sweeps – Institutions use RSI divergence to lure retail traders into premature
reversals before executing stop hunts.
False RSI Signals – In trending markets, RSI divergences often fail, while SMT divergence
provides a more contextual view of smart money positioning.
5. Using TradingView for SMT Analysis
To effectively analyze SMT divergence, traders should monitor at least two correlated assets
simultaneously.
TradingView makes this easy by allowing multiple chart layouts. Steps to Set Up Multiple Charts in TradingView:
a. Open TradingView and click on the “Select Layout” button.
b. Choose a two-chart or four-chart layout to compare correlated assets.
c. Sync timeframes across all charts for consistency.
d. Adjust scaling to ensure price action is easily comparable.
Best Pairs to Compare for SMT Analysis:
Forex : EUR/USD vs. GBP/USD, USD/JPY vs. DXY
Indices : NASDAQ vs. S&P 500, Dow Jones vs. S&P 500
Commodities & FX : Gold (XAU/USD) vs. USD/JPY
Bonds & Equities : 10-Year Treasury Yield vs. S&P 500
6. Key Takeaways
SMT divergence reveals institutional intent by showing liquidity accumulation or
distribution through correlated assets.
Bullish SMT occurs when one asset makes a lower low while the other does not, signaling a
potential reversal up.
Bearish SMT occurs when one asset makes a higher high while the other does not, signaling
a potential reversal down.
Best markets for SMT analysis include Forex pairs, indices, commodities, and bonds, where
correlations are strongest.
SMT is most effective near key liquidity levels, such as session highs/lows, order blocks, and
fair value gaps.
SMT is more reliable during high-impact news events, London & New York sessions, and
quarterly shifts, where institutional activity is highest.
SMT is superior to RSI divergence because it reflects real liquidity dynamics, whereas RSI
can produce false signals.
Combining SMT with market structure shifts like BOS and CHoCH increases trade accuracy
and reliability.
Risk management in SMT trading requires stop-loss placement beyond liquidity grabs and a
minimum 2:1 risk-reward ratio.
Mastering SMT helps traders avoid liquidity traps, improve precision, and align with smart
money moves.
SMT divergence is the footprint of smart money—where one market whispers the truth while the other follows the herd.
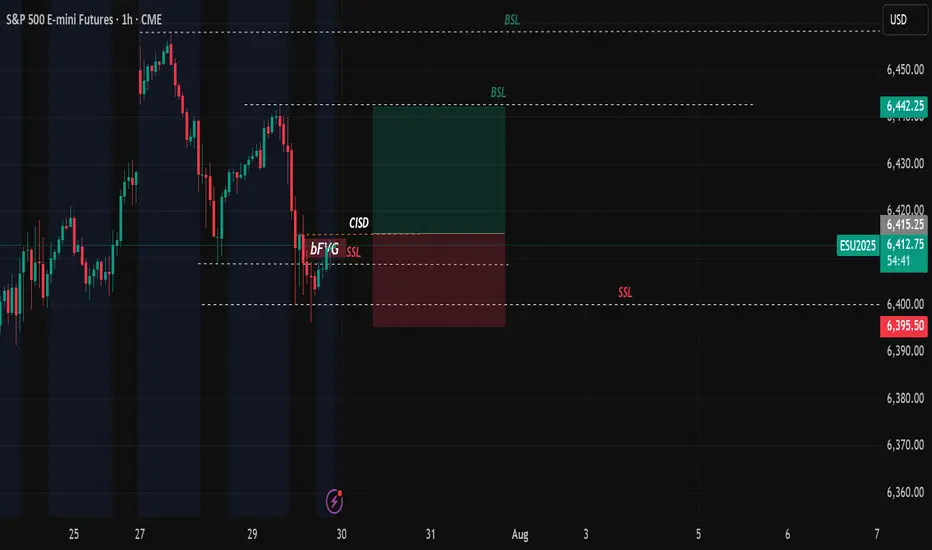
Long ES.. Probably a long in play if we cross/close above CISD as marked.. target the internal BSL as our target.. we sweep to ERL .. If you think i have drawn these incorrectly, i am happy to learn. Thank you
Potential transitionThe S&P 500 daily chart has gotten down to levels that buyers have entered this market previously. This means be cautious on the short side and be aware of the fundamentals that will be released on Wednesday.

07/28/25 Trade Journal, and ES_F Stock Market analysis EOD accountability report: +405
Sleep: 5 hours
Overall health: meh
VX Algo System Signals from (9:30am to 2pm)
— 9:00 AM Market Structure flipped bullish❌
— 10:04 AM VXAlgo ES X1 Buy signal! ✅
— 11:21 AM Under 6424, the structure is bearish. Don't avg down! ✅
— 11:40 AMVXAlgo NQ X1 Buy Signal! ✅
— 12:40 PM VXAlgo NQ X1DD Sell Signal! ✅
— 1:30 PM VXAlgo ES X3DD Sell Signal! ✅
What’s are some news or takeaway from today? and What major news or event impacted the market today?
Today was one of the few short the resistance day and refreshing to see after we been grinding ATH (all time highs)
News
Eu trade deal over the weekend,
& china tariff extension.
What are the critical support levels to watch?
--> Above 6395= Bullish, Under 6374= Bearish

Rest and waitThe daily structure in the S&P 500 implies a rest and wait structure for Tuesday. This would mean that the S&P 500 would trade inside the Monday range on Tuesday as the market prepares for a tremendous amount of fundamental information coming out this week.

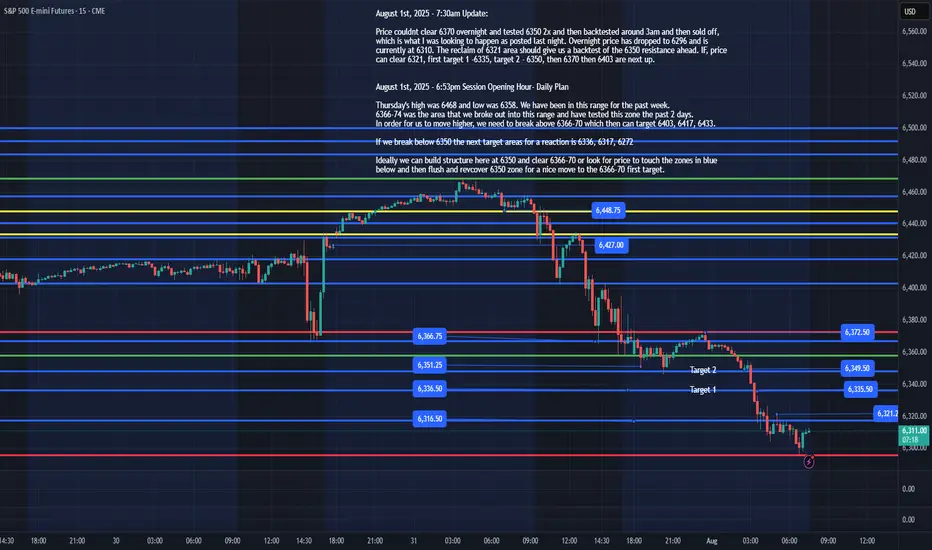
ES - August 1st Daily Plan Update - 7:35amAugust 1st, 2025 - 7:35am Update:
Price couldn't clear 6370 overnight and tested 6350 2x and then back tested around 3am and then sold off, which is what I was looking to happen as posted last night. Overnight price has dropped to 6296 and is currently at 6310. The reclaim of 6321 area should give us a back test of the 6350 resistances ahead. IF, price can clear 6321, first target 1 -6335, target 2 - 6350, then 6370 then 6403 are next up.
IF, we lose 6296, we would want to see a reclaim of it to enter a trade. IF, ES sells off today, better to get out the way and wait for price to reclaim 6296.
August 1st, 2025 - 6:53pm Session Opening Hour- Daily Plan
Thursday's high was 6468 and low was 6358. We have been in this range for the past week.
6366-74 was the area that we broke out into this range and have tested this zone the past 2 days.
In order for us to move higher, we need to break above 6366-70 which then can target 6403, 6417, 6433.
If we break below 6350 the next target areas for a reaction is 6336, 6317, 6272
Ideally, we can build structure here at 6350 and clear 6366-70 or look for price to touch the zones in blue below and then flush and recover 6350 zone for a nice move to the 6366-70 first target.
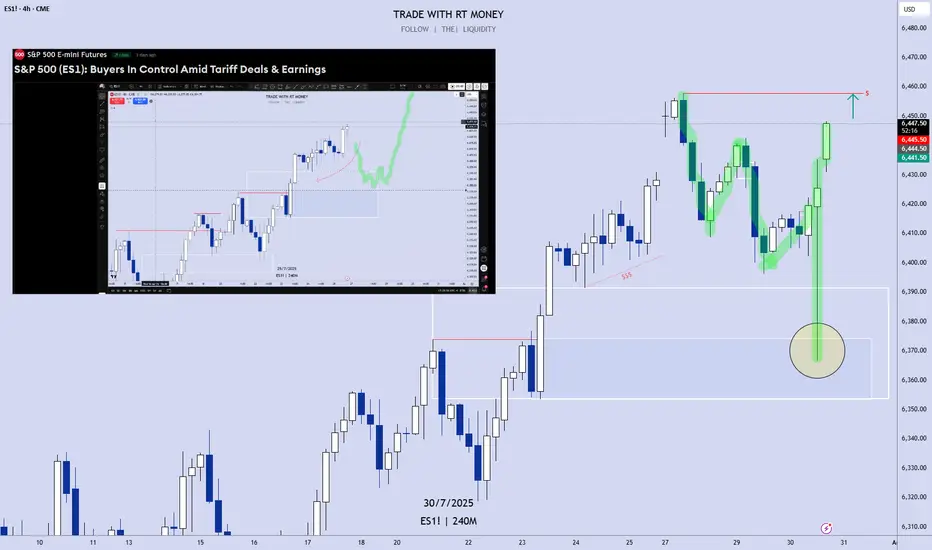
S&P 500 (ES1): Buyers In Control Amid Tariff Deals & EarningsWelcome back to the Weekly Forex Forecast for the week of July 28 - Aug 1st.
In this video, we will analyze the following FX market:
S&P 500 (ES1!)
The S&P 500 rose Friday to fresh highs, following a busy week of tariff updates and earnings. The S&P ended the week with its fifth straight record close, its longest such streak in over a year.
No reason to consider selling. Wait for pullbacks to FVGs for high probability buys.
FOMC and NFP loom. Be careful to avoid new entries during news times.
Enjoy!
May profits be upon you.
Leave any questions or comments in the comment section.
I appreciate any feedback from my viewers!
Like and/or subscribe if you want more accurate analysis.
Thank you so much!
Disclaimer:
I do not provide personal investment advice and I am not a qualified licensed investment advisor.
All information found here, including any ideas, opinions, views, predictions, forecasts, commentaries, suggestions, expressed or implied herein, are for informational, entertainment or educational purposes only and should not be construed as personal investment advice. While the information provided is believed to be accurate, it may include errors or inaccuracies.
I will not and cannot be held liable for any actions you take as a result of anything you read here.
Conduct your own due diligence, or consult a licensed financial advisor or broker before making any and all investment decisions. Any investments, trades, speculations, or decisions made on the basis of any information found on this channel, expressed or implied herein, are committed at your own risk, financial or otherwise.

ES - August 1st, 2025 - Session Opening HourAugust 1st, 2025 - 6:53pm Session Opening Hour- Daily Plan
Thursday's high was 6468 and low was 6358. We have been in this range for the past week.
6366-74 was the area that we broke out into this range and have tested this zone the past 2 days.
In order for us to move higher, we need to break above 6366-70 which then can target 6403, 6417, 6433.
If we break below 6350 the next target areas for a reaction is 6336, 6317, 6272
Ideally, we can build structure here at 6350 and clear 6366-70 or look for price to touch the zones in blue below and then flush and recover 6350 zone for a nice move to the 6366-70 first target.
I will update the plan based on overnight price action by 8am EST, Friday August 1st, 2025

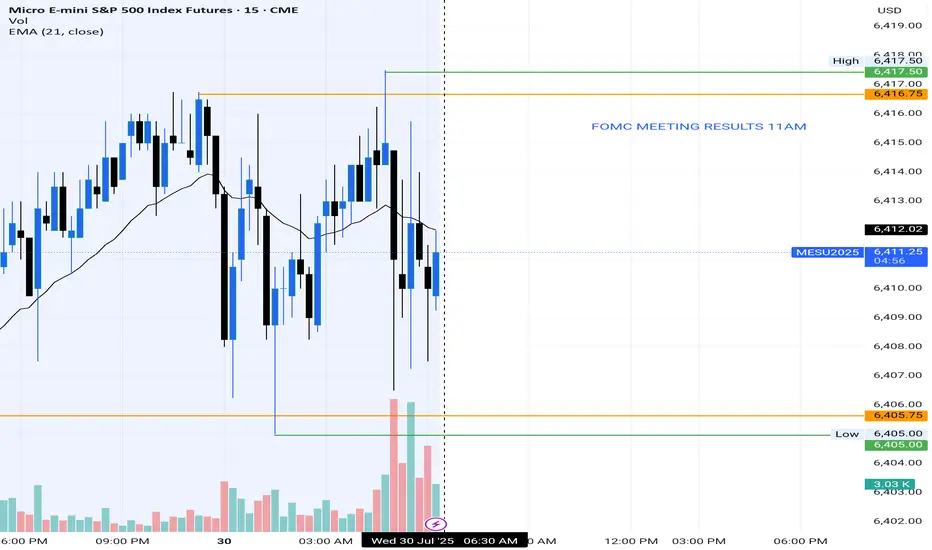
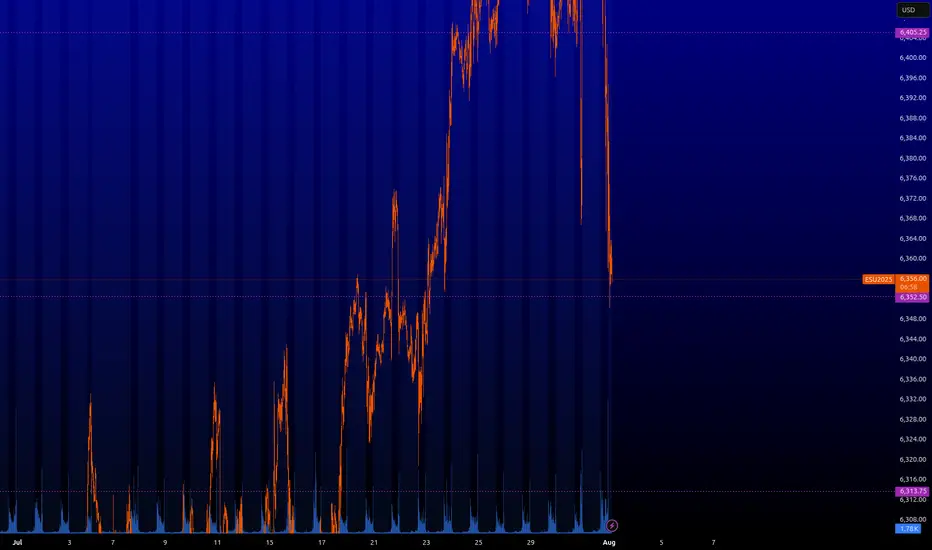
ES : Key levels⚠️ VOLATILITY WARNING ⚠️
Trading around major news can be extremely unpredictable. Trade responsibly!
Here are the key levels that the market will be interested in. So far, the green level of ~6.263 is likely to bounce, but it is old. I'd wait for something fresher.
From the minor timerframe, we can soon go long from ~6.352. If I'm at my computer and everything works out at this level as it should, I'll let you know.
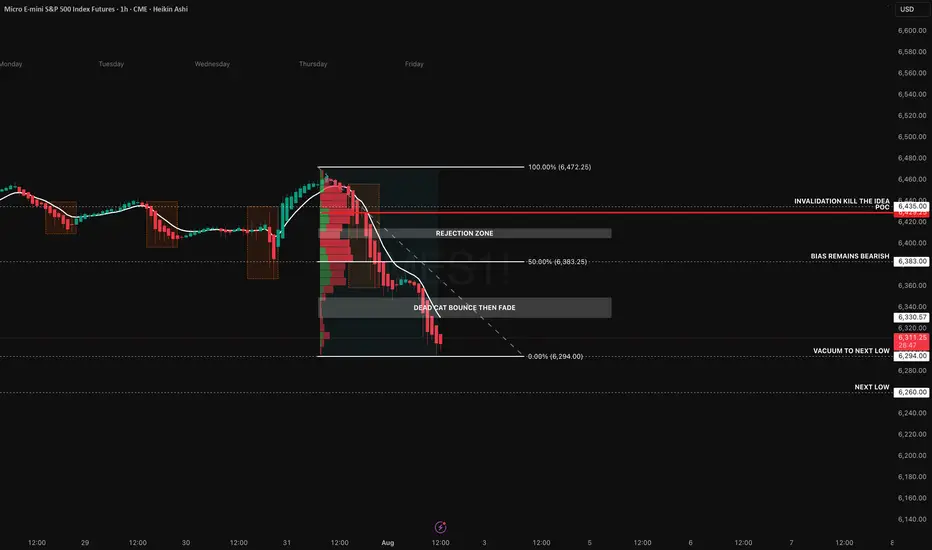
Structure Says Short… But Will News Flip the Script?Price continues to unwind following Thursday’s distribution, where we saw clear seller control above the 6420–6430 zone. Heikin Ashi candles show strong trend conviction with no upper wicks, and the EMA stack remains fully bearish. We're now pressing into the 0% Fibonacci extension at 6294, with the next low sitting around 6260 a clean vacuum zone that could fill quickly if the trend accelerates.
The volume profile from the breakdown range highlights 6429.25 as the point of control, acting as our primary rejection zone. Any pop into the 6383–6420 area will likely meet resistance. That’s our “dead cat bounce then fade” zone a textbook retracement rejection setup. Unless we reclaim 6435+ with conviction, the short bias remains intact.
We’re already short from 6306, targeting 6260. Stops are invalidated on a strong reclaim above the 6435 level.
However, today brings serious macro risk:
Trump has announced sweeping new tariffs on 92 countries, including 35% on Canada and 39% on Switzerland, triggering equity market anxiety. These surprise trade actions could cause intraday spikes or violent reversals, especially if retaliatory news drops intraday.
Amazon’s Q2 earnings missed cloud revenue expectations, putting pressure on tech futures.
U.S. Non farm Payrolls (NFP) are due at 8:30 AM ET, with expectations at +110K and unemployment ticking up to 4.2%. A strong jobs print could derail September rate cut hopes and add fuel to downside continuation or completely reverse sentiment.
We’re aware of this news risk and will adjust intraday. No stubborn bias here. But structurally, price is still in a trend, and this setup favours continuation unless macro flips the table.
My Setup Summary:
- Bias: Bearish (Trend Continuation)
- Entry: 6306 (Short)
- Target: 6260
- Invalidation: 6435 reclaim
- Confluence: POC rejection, Fib retrace, bearish EMAs, weak retrace structure
- News Risk: Tariffs, Amazon earnings miss, NFP at 8:30 AM ET
Good luck today and hope that we end the week profitable.
Still Bullish BiasOn the 4HR , there is already 2 legs down to start the month, similar to what happened in May. Markets typically has had 2 legs down before moving higher. Its August and its gonna be choppy.
We may test the tip of last years candle before we move even higher, which is another probably 80-100 points. However the hourly seems to reject this idea based on a 9 TD Sequential Count as the first alert failed and Bear continues pushing the price down. When in doubt always look at a higher timeframe. Just my thought of the probable outcome. Trade safe.

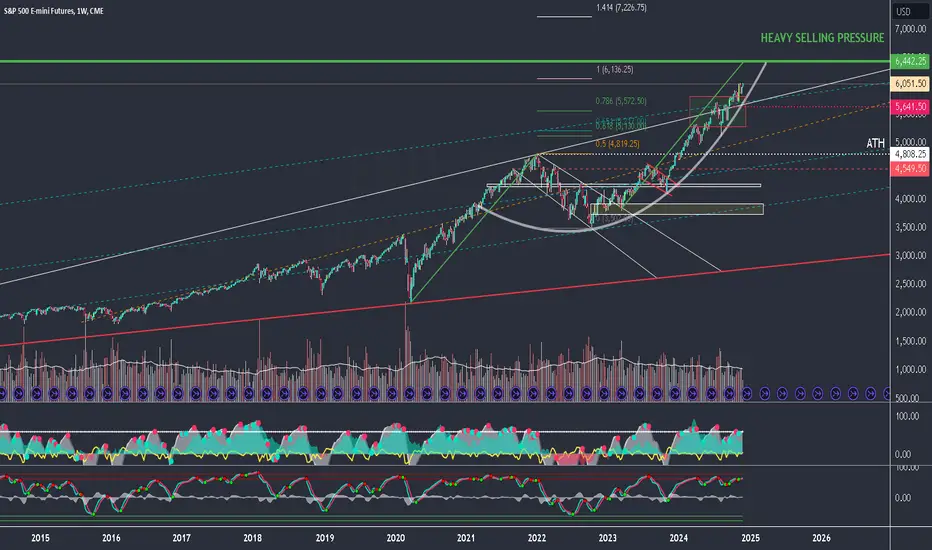
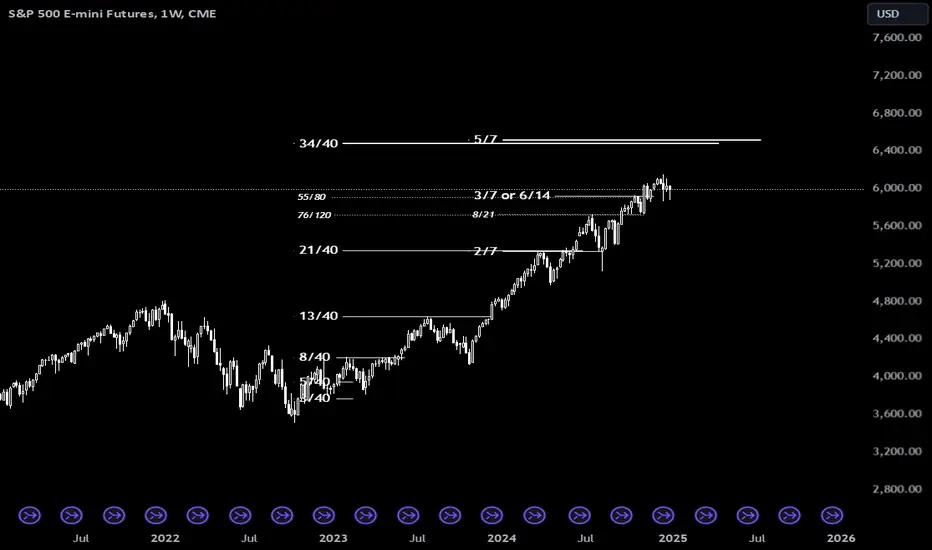
Possible cluster for Short on SP500An area I am closely monitoring lies between 6478 and 6516, particularly if the current high of 6152.75 (marked on December 16) is breached.
Analyzing the swing starting from the low of 3502 in October 2022, the major tops have followed a distinctive pattern in percentage terms:
3/40
5/40
8/40
13/40
21/40
The pattern suggests that each subsequent high is obtained by summing the numerators of the previous upward moves (e.g., 3 + 5 = 8, 8 + 5 = 13, and so on) while the denominator remains fixed at 40. Following this logic, the next high should be 34/40 (21 + 13).
I am confident in the reliability of this pattern because when I sum the numerators (21 + 34) and the denominators (40 + 40), the resulting level (55/80) aligns with a minor high. Similarly, by summing 55/80 and 21/40, using the same logic, I arrive at 76/120, which corresponded to a very significant high in July 2024.
While these levels may not be perfectly precise, they represent key areas of interest that warrant close attention.
If you are interested in this type of analysis, particularly when integrated with GANN angles, feel free to contact me privately at this email: drake36@inwind.it.
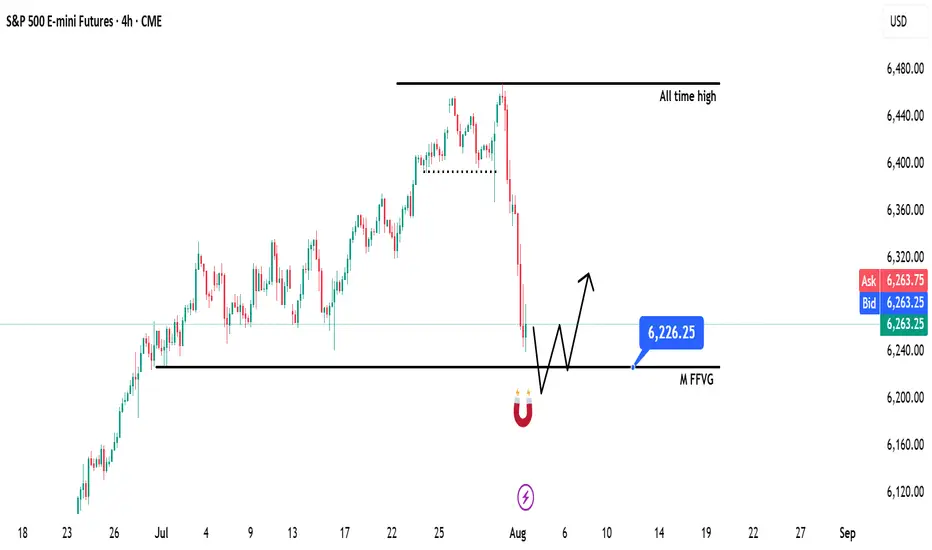
ES | SP500 - Weekly Recap & Gameplan - 03/08/25📈 Market Context:
Traders are currently anticipating a possible 0.25% rate cut during the upcoming September FOMC meeting, which continues to support the broader bullish framework.
Although the market pulled back after the Non-Farm Employment Change data came in below expectations, overall optimism remains.
Sentiment has now cooled off from last week's greed and shifted to a more neutral stance. Historically, August tends to bring some chop and pullbacks, but the structural bias still leans bullish.
🧾 Weekly Recap:
• ES kicked off the week with strong upward momentum, climbing steadily into Thursday.
• Along the way, price swept a key 4H swing high, breaking into new highs before initiating a retracement.
• This price action hinted at a short-term distribution and possible liquidity grab ahead of a correction.
📌 Technical Outlook & Game Plan:
→ I'm anticipating a move into the Monthly Fair Value Gap — a high-probability liquidity zone on my radar.
→ That area could act as a springboard for bullish continuation or at least provide a strong reaction.
→ Until that happens, I remain short-biased targeting the 6226$ zone, which I've marked as a major level.
🎯 Setup Trigger:
Once price taps 6226$, I'll monitor for:
• Clear break of structure on the 4H and 1H timeframes
• Formation of new demand zones indicating potential reversal
→ On confirmation from the lower timeframes, I’ll shift my focus toward long setups, potentially targeting new highs.
📋 Trade Management:
• Stoploss: Below the demand zone formed on 1H–4H
• Target: I’ll trail my stop to lock in profits as price moves higher
• Note: Although I’ll be watching for ATH retests, I plan to manage risk actively and book profits along the way
💬 Like, follow, and comment if this breakdown supports your trading! I’ll be sharing more detailed setups and educational posts — stay connected!