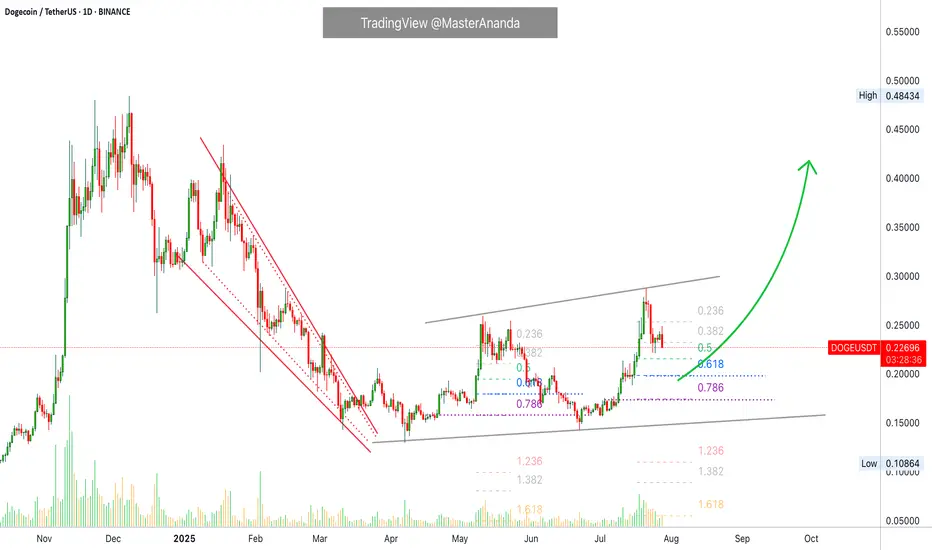
DOGEUSDT is testing 0.5 Fibonacci support (more gain)As we can see the breakout of red trendline also completed and volume increases after that and now market is testing major Fib levels like 0.5 & 0.61 soon we can expect more pump and gain here like the green arrows.
so many stop loss also hit on this fast correction to the downside and price is ready to start next boom pump with kicking out leverage buyers first.
DISCLAIMER: ((trade based on your own decision))
<<press like👍 if you enjoy💚
DOGEUSDT trade ideas
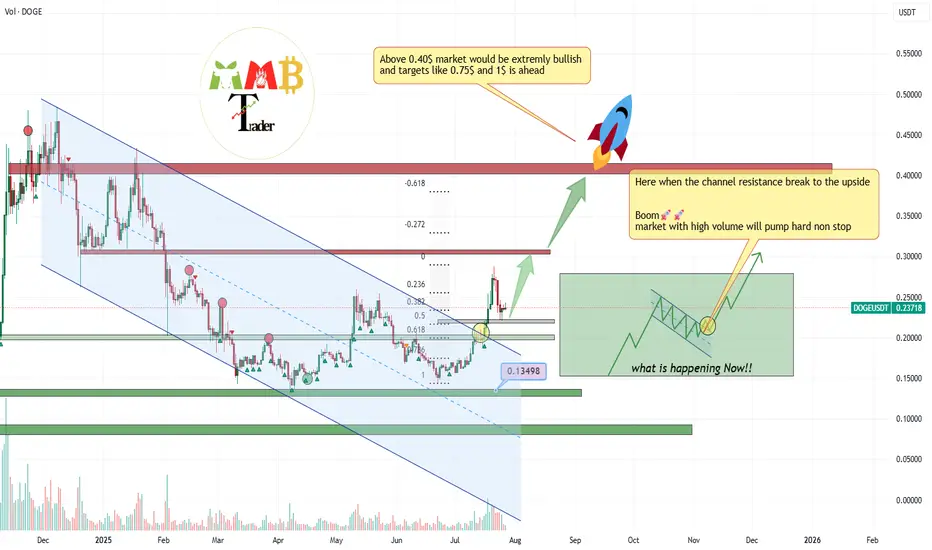
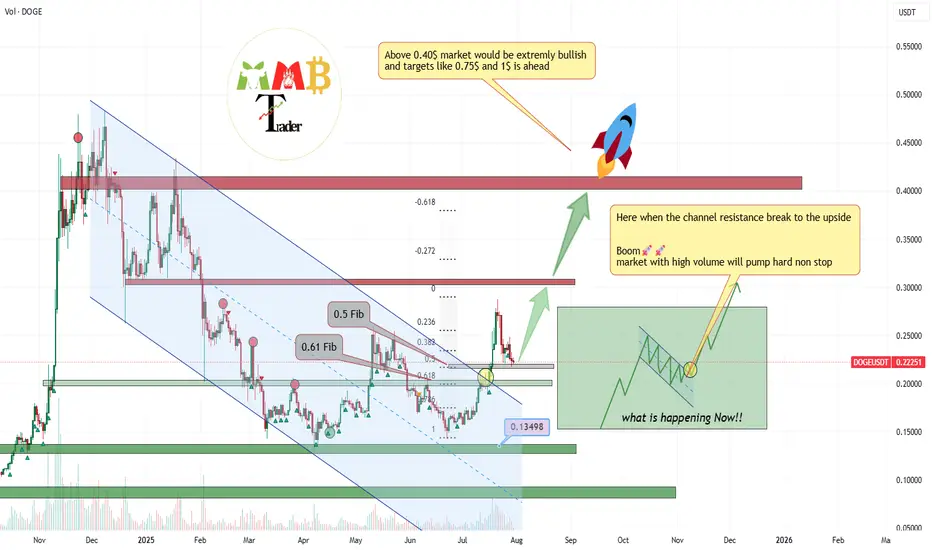
Those daily +20% to +30% candles soon will appear!!Those Fibonacci levels which are last supports for healthy & #Bullish market are all touching i mean the 0.218$(0.5 #Fibonacci) & 0.202(0.61 #Fibonacci) and i think these supports are strong enough to stop the correction and soon again it will pump and even can break daily high near 0.42$ and hit targets like 0.5$ and 0.75$.
DISCLAIMER: ((trade based on your own decision))
<<press like👍 if you enjoy💚
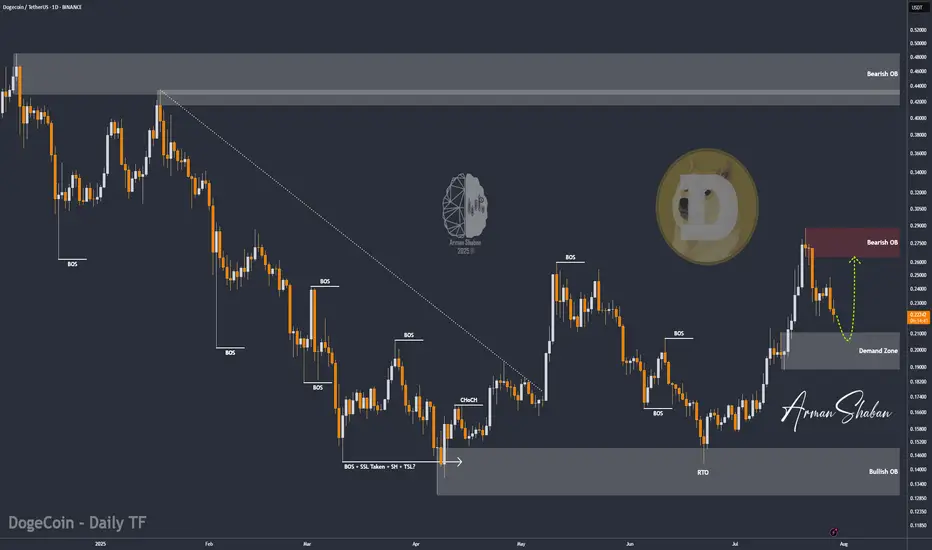
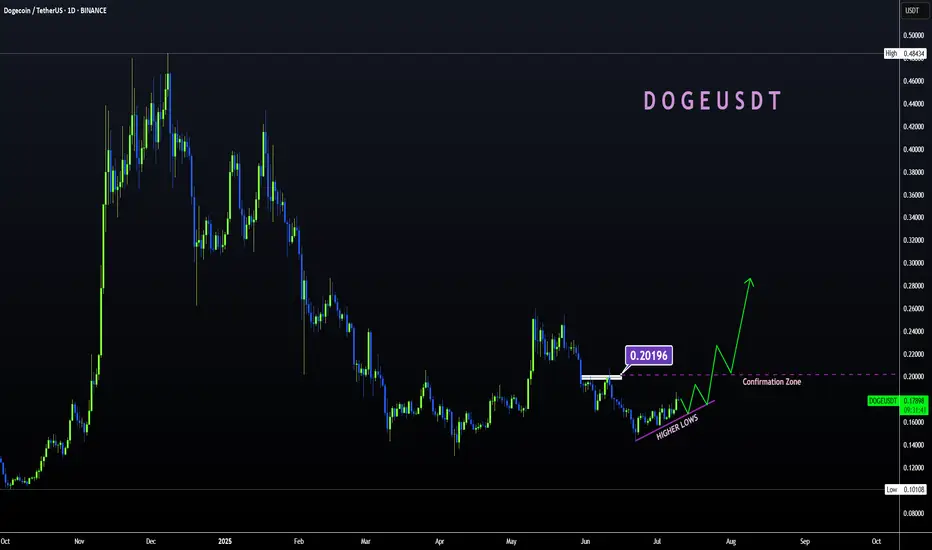
DOGE/USDT | Eyes Bounce from Key Support – Next Targets Ahead!By analyzing the Dogecoin chart on the daily timeframe, we can see that after reaching the $0.29 area, the price entered a correction and is now trading around $0.22. If DOGE dips into the key support zone between $0.19–$0.21, we could expect a strong bullish reaction. The next potential targets are $0.287, $0.32, $0.41, and $0.70.
Please support me with your likes and comments to motivate me to share more analysis with you and share your opinion about the possible trend of this chart with me !
Best Regards , Arman Shaban
The Pullback Panic? Your Whole Plan Dies?!!!!!One red candle is all it takes to destroy your entire plan.
Why do we panic so fast? Why do we exit too early before a rally?
And worse: why do we FOMO back in at the worst possible time?
Hello✌️
Spend 3 minutes ⏰ reading this educational material.
🎯 Analytical Insight on Dogecoin:
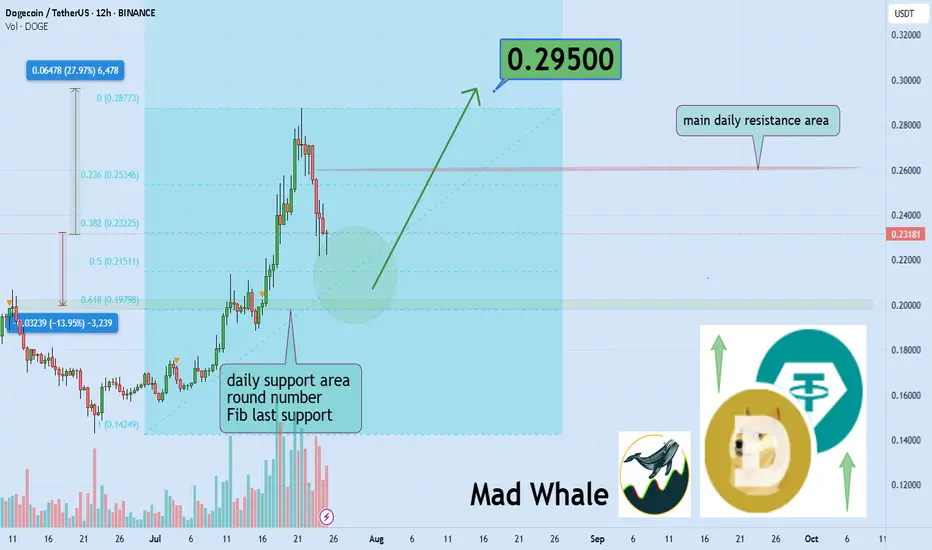
BINANCE:DOGEUSDT is approaching the key psychological level of 0.20, which also aligns with a strong daily support and the final Fibonacci retracement zone 🧭. Despite recent volatility, it continues to hold its mid-range Fib level, suggesting potential accumulation. If this support holds, a rebound toward the 0.30 resistance — a move of around 27% remains on the table 🎯.
Now , let's dive into the educational section,
🧠 The Victim Mindset in Crypto Markets
Here’s the uncomfortable truth.
Most traders believe they’re making rational decisions but in reality, they’re reacting emotionally to past pain.
One bad experience during a correction makes us fear all pullbacks.
Missing one big rally creates constant FOMO.
We can’t handle drawdowns but we accept buying tops again and again.
It’s not just you. This is how most retail traders operate and whales know it.
🐳 How Whales Profit From Our Fear
Whales never buy during hype. They buy during fear.
Mini pullbacks, shakeouts and false breakdowns are designed for one thing.
To make you exit so they can enter.
A red candle, a small wick, maybe a fake support break.
We sell out of fear, they buy the dip.
We FOMO back in too late.
Pullbacks are not just price moves. They are psychological traps.
📈 How to Break This Cycle
You don’t need to predict the future. You need to understand yourself.
Ask if this correction is technical or emotional.
Use confirmation from volume, OI and divergence.
Enter after traps, not inside them.
Question your feelings before every move.
You are not trading the chart. You’re trading your mind reacting to the chart.
📊 TradingView Tools to Escape the Fear Greed Cycle
TradingView gives you access to several practical indicators that can help protect your capital from emotional decision-making.
🔹 Fear and Greed Index (Crypto)
Simple but powerful. When the index drops below 30, most traders are in panic mode. That is exactly where whales accumulate, while we run away.
🔹 Open Interest Heatmaps
When open interest rises but price stays flat, it often signals an upcoming shakeout. One scary-looking red candle and the weak hands are gone.
🔹 Volume Profile and VPVR
Perfect for distinguishing between healthy corrections and manipulative dumps. If price pulls back but buying volume remains strong, it's not a real sell-off. It’s a trap.
🔹 Divergence Indicators like MACD or RSI
If RSI rises during a pullback, there’s a hidden bullish divergence. Exiting may be the worst thing to do.
🔹 Liquidity Maps
These show where stop losses and liquidation clusters are located. Often before any major move up, the market takes a detour to liquidate these levels.
Use these tools to stop reacting emotionally and start trading rationally.
📍 Final Thoughts
Small corrections are not the enemy.
Your emotional reaction to them is the real threat.
Before you panic-exit, ask yourself if this fear is justified or just mental conditioning.
The market always gives second chances but we rarely wait for them.
✨ Need a little love!
We pour love into every post your support keeps us inspired! 💛 Don’t be shy, we’d love to hear from you on comments. Big thanks , Mad Whale 🐋
📜Please make sure to do your own research before investing, and review the disclaimer provided at the end of each post.
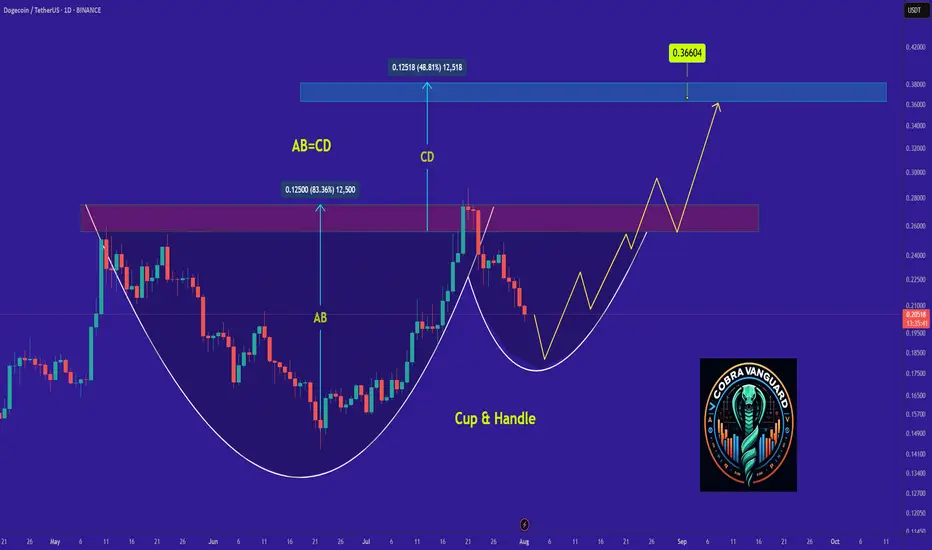
Why DOGE Remains Bullish and Its Next Potential Move !It appears that the price is forming a cup and handle pattern, and if this occurs, it could push the price above $0.30.
Best regards CobraVanguard.💚
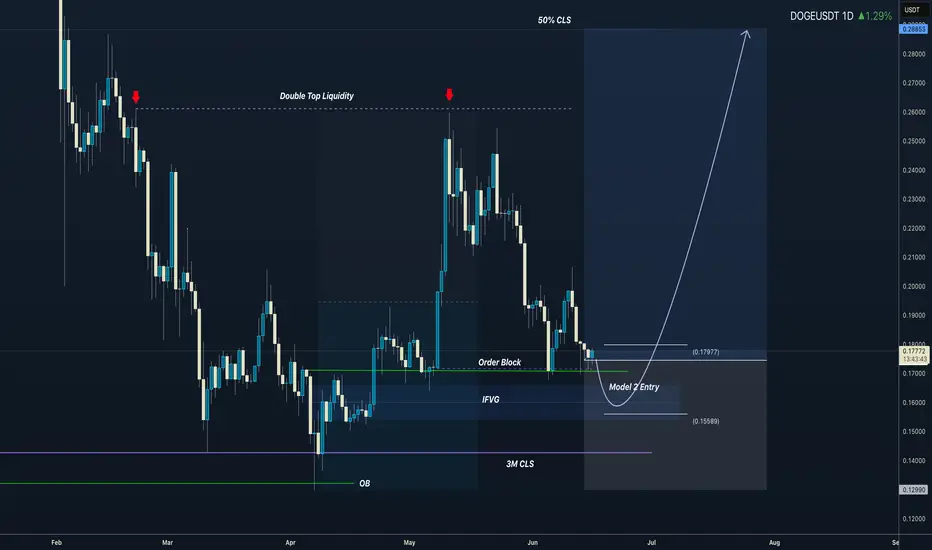
3M CLS I KL - OB I Model 2 I Targe 50% CLSHey, Market Warriors, here is another outlook on this instrument
If you’ve been following me, you already know every setup you see is built around a CLS Footprint, a Key Level, Liquidity and a specific execution model.
If you haven't followed me yet, start now.
My trading system is completely mechanical — designed to remove emotions, opinions, and impulsive decisions. No messy diagonal lines. No random drawings. Just clarity, structure, and execution.
🧩 What is CLS?
CLS is real smart money — the combined power of major investment banks and central banks moving over 6.5 trillion dollars a day. Understanding their operations is key to markets.
✅ Understanding the behavior of CLS allows you to position yourself with the giants during the market manipulations — leading to buying lows and selling highs - cleaner entries, clearer exits, and consistent profits.
📍 Model 1
is right after the manipulation of the CLS candle when CIOD occurs, and we are targeting 50% of the CLS range. H4 CLS ranges supported by HTF go straight to the opposing range.
"Adapt what is useful, reject what is useless, and add what is specifically your own."
— David Perk aka Dave FX Hunter ⚔️
👍 Hit like if you find this analysis helpful, and don't hesitate to comment with your opinions, charts or any questions.
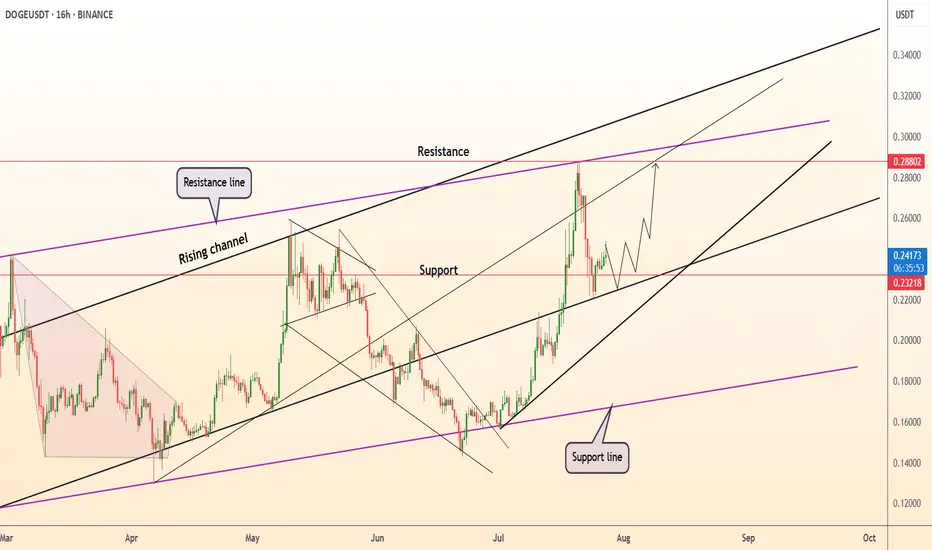
Lingrid | DOGEUSDT Pullback and Continuation OpportunityBINANCE:DOGEUSDT is currently testing the intersection of its upward channel support and a critical horizontal zone near 0.21378, after a steep corrective decline from the 0.28628 resistance area. The recent price action formed a rounded pullback, suggesting potential accumulation near trendline confluence. A bullish bounce here could trigger a strong rally toward 0.26350 as shown by the projected upward path. Failure to hold the 0.21000 area would expose the pair to deeper downside toward the 0.15706 support.
📌 Key Levels
Buy zone: 0.21000–0.21700
Buy trigger: Break and close above 0.23000
Target: 0.26350
Invalidation: Break below 0.21000
⚠️ Risks
Breakdown of ascending trendline support
Weak volume on upward breakout
Broader market weakness impacting altcoins
If this idea resonates with you or you have your own opinion, traders, hit the comments. I’m excited to read your thoughts!

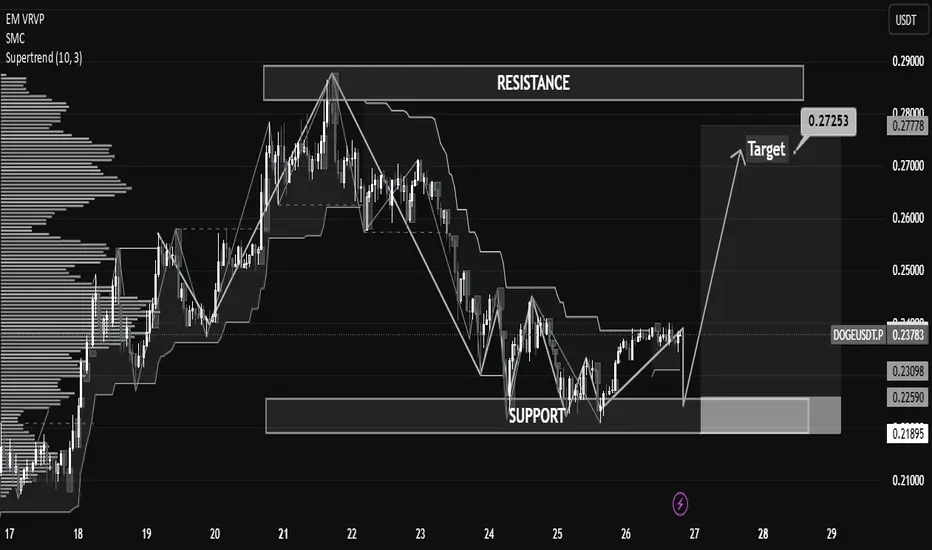
DOGE/USDT Technical Analysis – Breakout AnticipationDOGE/USDT Technical Analysis – Breakout Anticipation
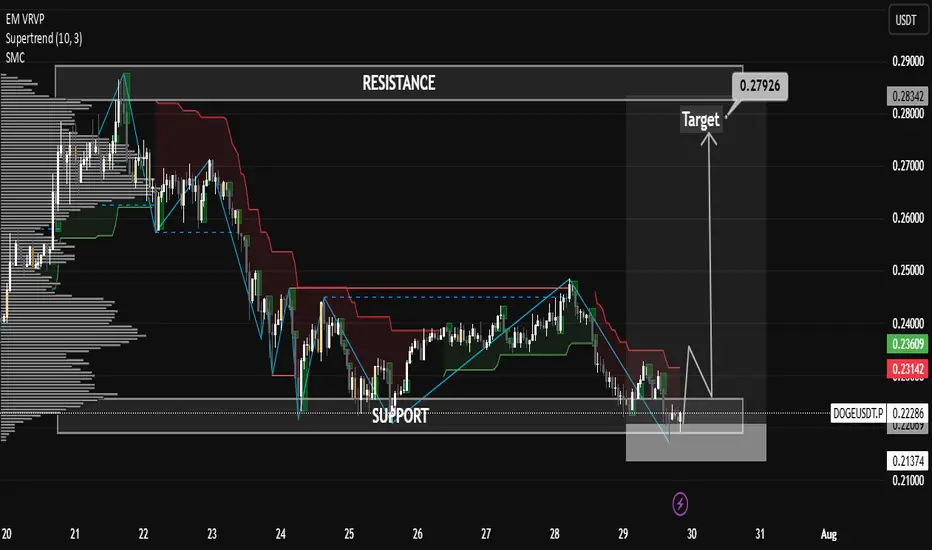
As of the current market structure, DOGE/USDT is showing signs of a potential bullish reversal from the demand zone (support), aiming toward the projected target at 0.27253 USDT.
🔍 Chart Structure & Price Action
Support Zone (0.21873 – 0.22568): The price has previously respected this area, making it a strong demand zone where buyers stepped in.
Resistance Zone (0.27756 – 0.29000): A key supply zone where previous rallies halted. This is the ultimate test for bulls after the breakout.
Current Price (0.23743) is showing consolidation above the support, suggesting accumulation before a move.
🧠 Technical Indicators
Supertrend Indicator: Currently flipping to bullish (10,3 settings), indicating potential upside continuation.
Volume Profile (VRVP): Shows high volume nodes around the support level, confirming strong interest from institutional players or large orders.
Market Structure: A higher-low is forming, indicating early signs of a bullish market shift.
🎯 Target
The projected move towards 0.27253 USDT aligns with previous price action and supply zone interaction. A clean breakout from the current consolidation could fuel momentum toward this level.
🎓 Educational Insight
This setup reflects the principles of Smart Money Concepts (SMC):
Price tapping into demand before impulse moves.
Liquidity grab at lows.
Break of structure (BOS) to the upside could trigger continuation.
Traders can learn the value of combining structure-based trading with volume analysis to improve entry precision and confidence.
dogeusdtMy opinion is based on the Arti M strategy. Share your thoughts with me. Is your opinion right or wrong?
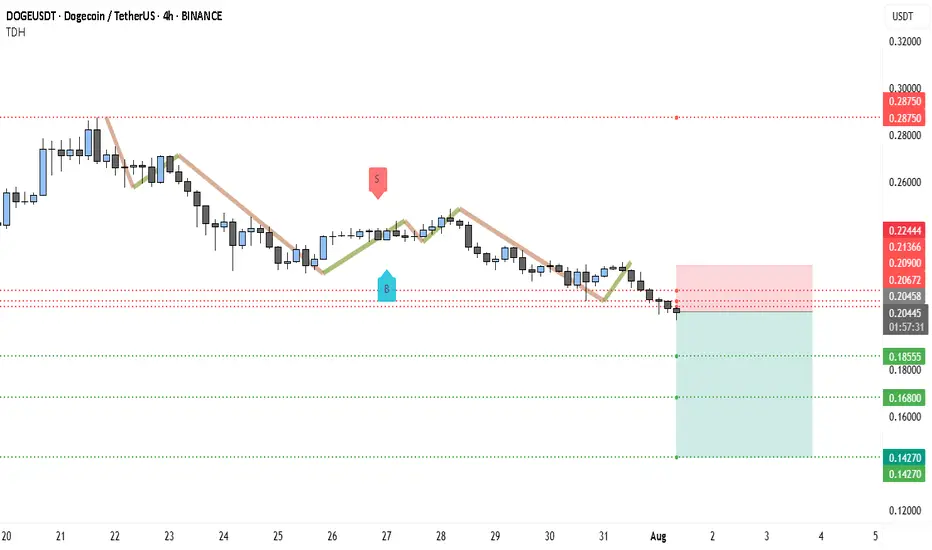
Bears Target $0.14 DOGE — Is the Trend Your Friend?DOGEUSDT has been in a clear downtrend since late July, printing consistent lower highs and lower lows. The current market structure shows sellers firmly in control, with every bullish bounce quickly fading. The recent rejection near $0.2244 and the inability to sustain above the $0.21 zone highlight persistent selling pressure.
At the moment, DOGE is hovering around $0.2043, just under a short-term resistance band between $0.2067 and $0.2090. This area has acted as a rejection point in the last few sessions, suggesting that unless bulls can break above it with strong volume, the path of least resistance remains downward. Below, the first major support sits at $0.1855. If that breaks, the selling could accelerate toward $0.1680, a level that aligns with a previous consolidation base from June. In an extended decline, $0.1427 comes into view as a long-term support level that previously acted as a strong demand zone.
The chart also shows an active short trade setup in play:
• Entry: $0.2043
• Stop-Loss: $0.2244
• Targets: TP1 at $0.1855, TP2 at $0.1680, and TP3 at $0.1427
From a risk-reward perspective, this setup remains attractive, especially if the price breaks below $0.1855. However, traders should watch for any bullish invalidation signs — a close above $0.2136 could challenge the short bias, while a sustained break above $0.2244 would signal a possible trend shift. Until then, the broader technical picture still favors the bears.
TradeCityPro | DOGE Faces Resistance with Altseason Tailwinds👋 Welcome to TradeCity Pro!
In this analysis, I want to review the DOGE coin for you. One of the first and most popular shitcoins in crypto, which managed to attract a very strong market cap during the previous bull run due to the hype around Elon Musk.
🔍 Currently, this coin has a market cap of $34.06 billion and ranks 8th on CoinMarketCap.
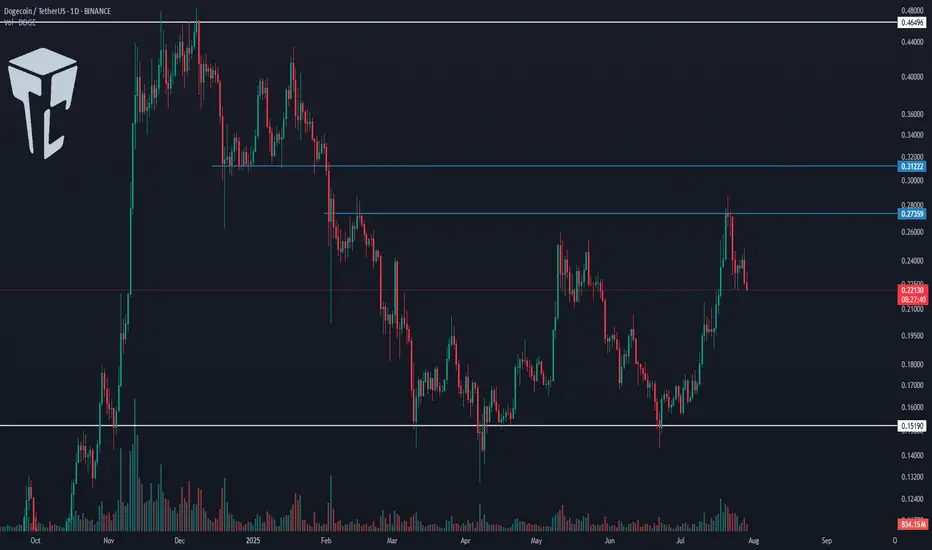
📅 Daily Timeframe
In the daily timeframe, this coin has created a very strong support level at 0.15190, and now after a bullish leg, it has formed a top at 0.27359.
📊 The buying volume increased nicely during this bullish leg, and the price moved up to the 0.27359 resistance.
✔️ Now, after the first touch, the price has started a slight correction and is moving downward. If further touches occur, we can open a long position after breaking the top.
📈 Breaking 0.27359 could be one of those positions that stays open all the way up to 0.46496, and we can buy this coin in spot using the profit from that trade. I will try to have a position open after breaking 0.27359, aiming for 0.46496.
💥 The next trigger we have is the break of 0.31222, but the price should first form some structure after reaching that area, and only after confirmation should we open a position. Just entering based on that break doesn’t seem logical to me.
🔽 If a correction and drop happen, as long as the price stays above 0.15190, there’s no problem for the trend to continue. But if the price stabilizes below that level, a trend reversal might occur.
📝 Final Thoughts
This analysis reflects our opinions and is not financial advice.
Share your thoughts in the comments, and don’t forget to share this analysis with your friends! ❤️
DOGE Looking Strong as Support HoldsDOGE Looking Strong as Support Holds
🔹 1. Support Zone Validated
The chart shows Dogecoin retested the lower boxed region around $0.221–$0.223, and bounced sharply from that zone. Given the heavy spike in volume during the retest, this suggests aggressive buying and accumulation—a hallmark of bullish conviction.
CryptoRank
The Tradable
🔹 2. Fibonacci 0.618 Support Bounce
On the 4‑hour timeframe, DOGE held firm above the critical Fibonacci 61.8% retracement level, and delivered a strong rebound—indicating technical significance and buyer interest at this level.
Blockchain News
🔹 3. Double-Bottom + Trendline Breakout
Analysts have identified a classic double-bottom formation, with price clearing the neckline (~$0.230–$0.231) and then retesting it successfully. Holding this retest confirms a breakout, suggesting more upside ahead.
Crypto Basic
🔹 4. Whale Activity & Accumulation
On-chain data shows $250 million in Dogecoin accumulation by whales, especially around the support zone—creating a structural demand base and reinforcing the bullish setup.
CoinCentral
🎯 Price Targets & Key Levels
Scenario Levels Rationale
Bullish continuation $0.239–$0.241 union resistance First resistance zone—price must reclaim to continue bullish momentum
$0.260–$0.280 Reclaiming $0.241 could open room toward mid‑channel resistance or prior highs
$0.300+ Potential target if momentum sustains and broader breakout occurs
Bearish invalidation $0.223 support Invalid break below suggests fading momentum—risk of correction to $0.215–$0.218
$0.215–$0.218 Secondary support zone if expansion of sell side continues
⚙️ Trade Setup for a Bullish Bias
Entry Focus: Consider entering long near $0.223 if price retests and holds, with a tight stop just below support.
Stop-Loss Zone: Slightly beneath $0.221 to account for volatility.
Targets: Scale out around $0.241, with larger targets at $0.260–$0.280, and possibly $0.30+ on sustained strength.
Confirmation: Watch for rising volume, break and close above resistance zones, and bullish indicator alignment.
⚡ Market Sentiment & Broader Themes
Momentum Shift: A bearish retrace reversed quickly amid accumulation, suggesting strong buyer commitment.
CryptoRank
The Tradable
AInvest
Double Bottom Status: Analyst commentary supports a reversal setup, with targets toward $0.310–$0.46 if the neckline holds.
Crypto Basic
AInvest
CryptoRank
Macro View: DOGE remains within a bullish channel; some forecasts project
DOGEUSDT Technical Analysis – Bullish Reversal Anticipated DOGEUSDT Technical Analysis – Bullish Reversal Anticipated
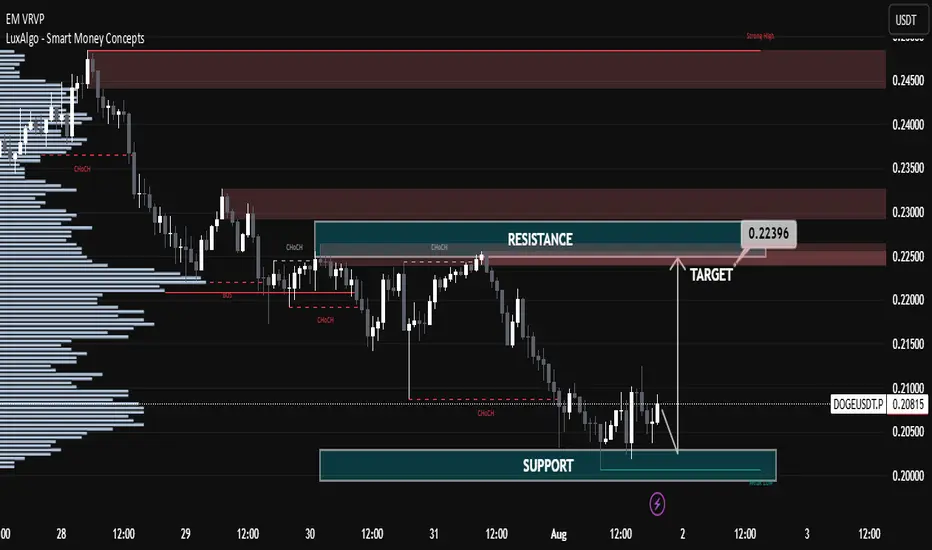
🔍 Key Technical Zones:
Support Zone: $0.1990 – $0.2015
Strong bullish reactions noted from this level in previous attempts.
Confluence with volume accumulation on the left (as seen in the Volume Profile).
Signifies a strong demand zone where buyers are stepping in.
Resistance Zone / Target: $0.2220 – $0.2240
Previous structural high and supply zone.
Marked as the first major liquidity area.
Also aligns with imbalance and CHoCH (Change of Character), a common SMC concept.
🔄 Market Structure:
CHoCH (Change of Character) marked multiple times, indicating attempts by bulls to reclaim structure.
Recent price action shows accumulation near support.
Sideways consolidation suggests potential for a bullish breakout.
Liquidity sweep of recent lows could indicate that smart money is accumulating positions before a move higher.
🎯 Trade Setup Idea:
Entry Area: Between $0.2000 – $0.2060 (inside the support zone)
Target: $0.22396 (as marked)
Stop Loss: Below $0.1980 (below the visible support range)
🔧 Indicators and Tools Used:
Volume Profile (VRVP): Shows most volume traded around $0.205 – $0.207, indicating strong positioning from market participants.
Smart Money Concepts (SMC): CHoCH and liquidity concepts signal potential accumulation and reversal.
Price Action Analysis: Clean swing structure with support-resistance rotation visible.
📌 Conclusion:
DOGEUSDT is currently trading in a range-bound structure with a bullish bias from the support zone. If the price sustains above $0.205 and breaks above minor resistance, the upside target of $0.22396 is likely. This setup is supported by strong volume accumulation and smart money structure shifts.
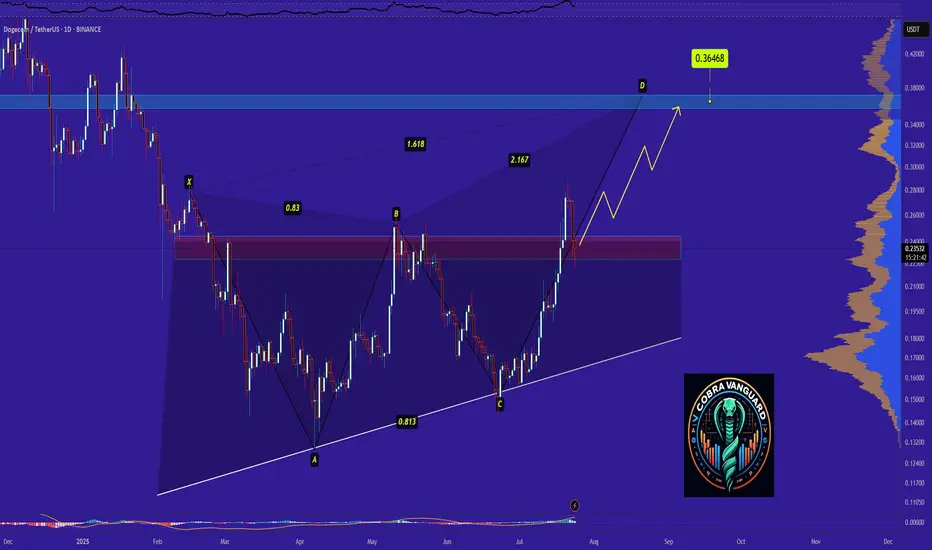
Dogecoin Ready for PUMP or what ?Dogecoin has completed and broken the ascending triangle in the daily timeframe, The price is currently supported well, which can increase the price. I expect the price to rise to around 0.36 .
Stay Awesome , CobraVanguard
Dogecoin · Risk of Much Lower is MinimumWe start the process by looking at a few charts. We start with the big projects in order to gain a perspective of the bigger picture. After reviewing 10-20 charts, we start to get an idea, but we don't form any picture in our minds, we just continue reading; reading the articles and reading the charts.
After just 10 days, we have anywhere between 80 and 100 articles/charts. Now we have a better picture of the market. We know how each sector is doing and this further helps us develop our bigger picture, the one that will help us call the shots.
After we review 150 to 200 charts and trading pairs, we get the pulse of the market. Where the energy flows, our attention goes and sometimes our attention reaches before the energy and this gives us an entry prize.
It will continue to work in this way. If you look at the market daily, read open to accepting new information, accepting always that I can be wrong, we can continue to develop a sense of what is really happening.
Dogecoin is making a minor pause after weeks of sustained growth. It is normal, if the market is going to be growing for months, everything cannot happen in a day. Five steps forward, three steps back.
Namaste.
Dogecoin (DOGE): Breakout Happened | Another 200% Incoming!Dogecoin has had a really good rally so far, but that's not all; we might see another 200% movement from the current market price!
More in-depth info is in the video—enjoy!
Swallow Academy

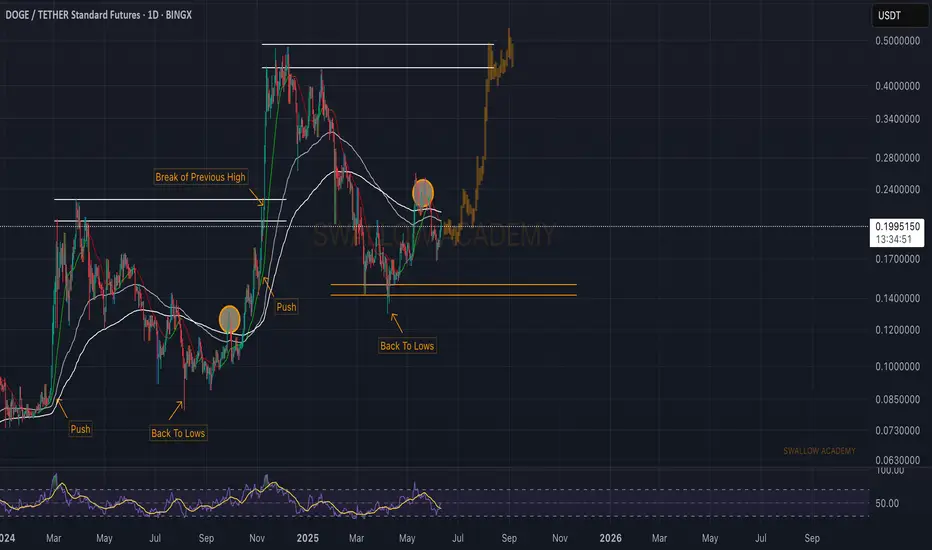
Dogecoin (DOGE): Getting Ready For Buyside Movement | $0.44Dogecoin is repeating its pattern where, after forming local lows and the first breakout above EMAs, the price is not getting ready for a proper push, it seems to us.
We are monitoring for the EMA line here, as once we see a proper break (the second one), we will be aiming for the $0.44 area.
Swallow Academy
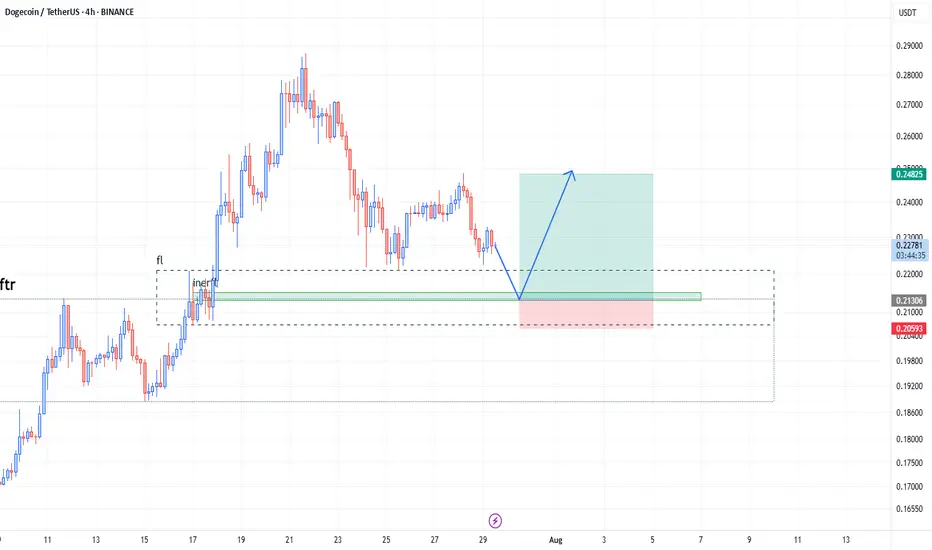
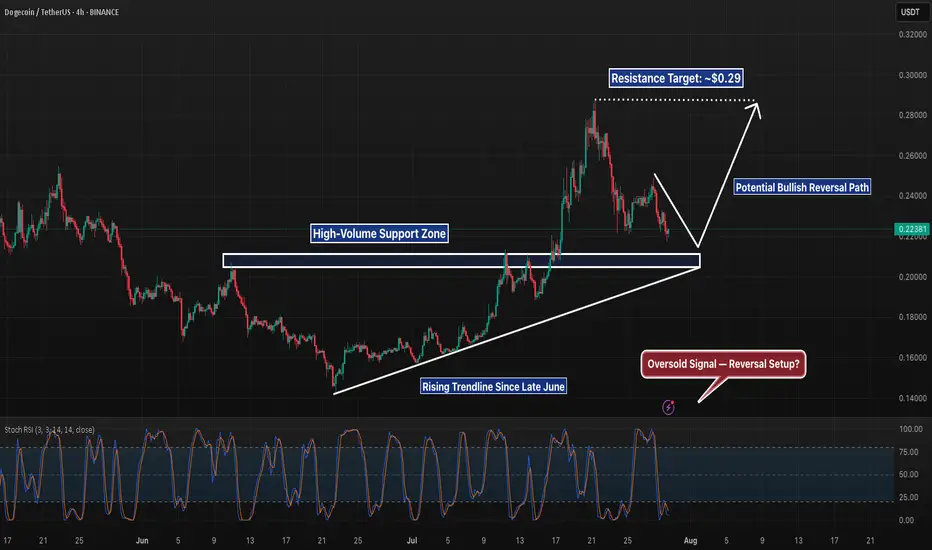
DOGE 4H – Strong Support Test Before Alt-Season??DOGE is approaching a pivotal support zone on the 4H chart — the same area that acted as the breakout base in mid-July before price surged nearly 40% higher. This horizontal level is now being tested again, offering a potential opportunity for trend continuation if bulls can defend it.
The support zone also aligns with an ascending trendline that has been respected for nearly a month, creating a key confluence point. Combined with an oversold Stochastic RSI reading, the setup is beginning to show early signs of a potential reversal — but confirmation is still needed.
Price structure remains technically bullish unless this area breaks. A clean bounce here could trigger a new wave toward the prior high at $0.29. On the flip side, a breakdown of this confluence zone would invalidate the current trend structure and likely target the $0.19–0.20 region.
📊 What I’m Watching For:
– Bullish price action (e.g., hammer candle, engulfing) off this zone
– Higher low confirmation with volume
– Trendline retest and hold
– Momentum alignment with RSI/Stoch flip
DOGE remains one of the more technically clean charts among majors — but holding here is key. Watching closely.
DOGE | Gearing up For a BIG MOVEDoge is looking mighty bullish after establishing a clear bottom.
Together with confirmation from BTC, we can safely say that altseason is yet ahead of us. BTC's recent increase show that the bullish impulse is still upon us. And after ETH increases, the rest of the altcoin market will follow suit as per usual.
DOGE is bullish because:
✅ Clear bottom
✅ Higher lows, daily looking to reclaim the moving averages:
✅ Altseason upon us after ETH increase
Ultimately, we need to wait for confirmation - if THIS major resistance zone is cleared (in other words if daily candles close ABOVE this zone) then we're full bull mode.
________________
BINANCE:DOGEUSDT
Thief Strategy Unlocked: DOGE/USDT Swing Robbery🐕💸 "DogeCoin Heist Plan: Swipe the Vault Before the Bark Bites!" 💥🔐
🌍 Hi! Hola! Ola! Bonjour! Hallo! Marhaba! 🌍
🎩 Welcome back, Money Makers & Market Robbers! 🏴☠️
💥 This is your DOGE/USDT (Dogecoin vs Tether) Crypto Market Heist Plan – fully loaded with Thief Trading Style tactics combining technical firepower 🔥 and macro intel 📊 for a high-voltage entry!
💣 Plan of Attack: The Robbery Blueprint 📈
🎯 Entry Point:
🟢 The vault's wide open! Enter LONG at any price—pullback is your sneak path in.
Set your BUY LIMIT orders using 15m or 30m timeframes at the recent swing zones.
Layer them like a pro 💹 with DCA (Dollar Cost Averaging) precision.
🛑 Stop Loss (SL):
👂 "Listen up!" Don’t slap a stop loss before the pullback confirms—it’s like triggering the alarm too early!
📍 Thief's SL placed only after pullback occurs—use the 4H swing low around 0.19000.
✍️ Adjust SL based on your risk appetite, lot size, and number of entries.
🏁 Target Zone:
🎯 Aim for 0.28000, or make a stealthy exit before the escape door shuts.
💰 Special Note for Scalpers:
Only go LONG—this market’s barking up, not down!
Big pockets? Straight in.
Smaller stack? Join the swing crew and rob with patience.
Use a trailing SL to secure the loot 🏆.
📊 Market Overview:
Currently bullish bias due to:
Macro inflows
Risk sentiment shift
Volume surge
On-chain support
Check 📡: Fundamentals | COT | Intermarket | Sentiment | Price Action.
⚠️ Heist Hazard - News Alert:
📰 Don’t enter new positions around high-impact news.
Set trailing SLs to guard your open trades during these volatile spikes.
💖💬 Robbers' Call to Action:
💥 Hit that BOOST Button on the idea 💥
Not just for likes—it fuels our squad’s energy and signals more Thief Heist Plans are coming 🐱👤💸
Let’s rob these charts—strategically, smartly, & silently.
📌 Stay Tuned for more explosive trade setups from the vault of Thief Trader.
🤑🛸 Trade smart. Trade bold. Trade like a Thief.

DeGRAM | DOGEUSD above the support level📊 Technical Analysis
● DOGE keeps printing higher swing-lows inside the 5-month rising channel; the latest pull-back bounced precisely at the mid-band/0.232 support, turning May’s flag roof into demand.
● A fresh micro bull-flag is unfolding above that rail; its pole height and channel geometry project follow-through toward the upper red supply 0.288-0.300 where the purple macro cap meets the channel crest.
💡 Fundamental Analysis
● Binance confirmed its late-July quarterly burn will include >150 M DOGE trading-fee tokens, trimming float, while reports of X testing DOGE micro-payments boosted social volume this week.
✨ Summary
Long 0.232-0.245; hold above 0.232 targets 0.272 → 0.288. Invalidate on a 16 h close below 0.214.
-------------------
Share your opinion in the comments and support the idea with a like. Thanks for your support!
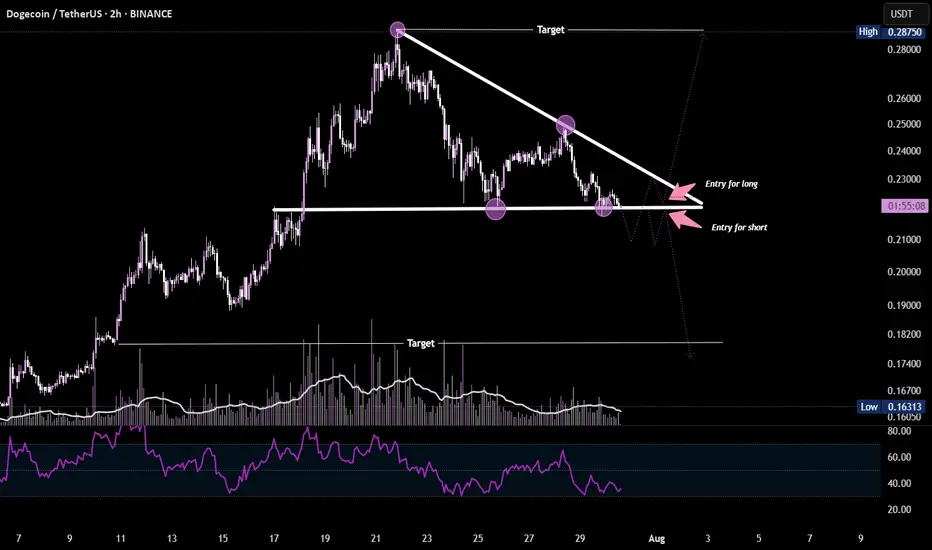
DOGE at Decision Point Dogecoin is forming a descending triangle pattern on the 2H chart, indicating a potential breakout setup.
A close above the resistance trendline ($0.23) could trigger a bullish move, while a breakdown below support ($0.215) may signal a bearish continuation. RSI and volume are suggesting weakening momentum — wait for confirmation before entering.
DOGEUSD : Short-term longHere is the DOGEUSD level, which is likely to rebound on small timeframes. Those who trade intraday may wish to pay attention to it.
It will also be possible to look for a good long position from this level after volume has been accumulated on it.
