FUN SELL SETUP ,Sold From $0.012100FUN SELL SETUP
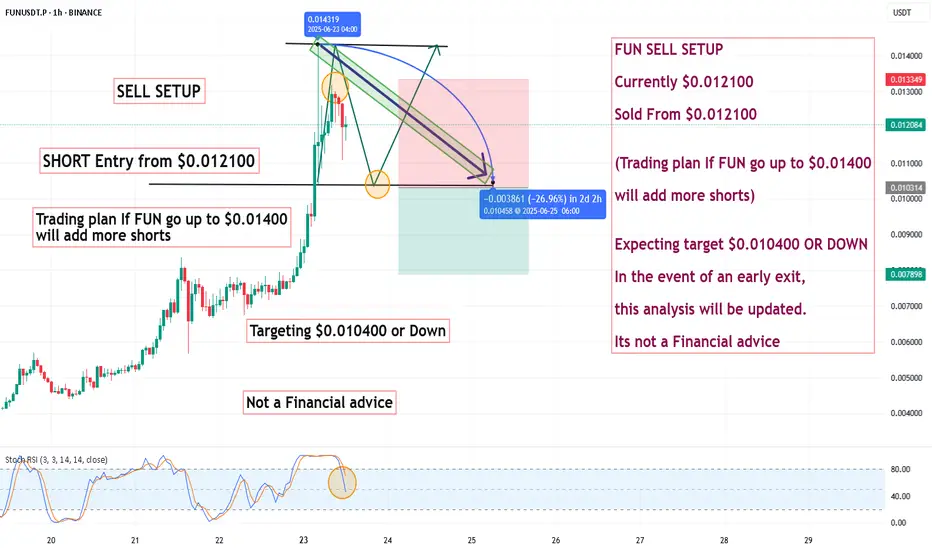
Currently $0.012100
Sold From $0.012100
(Trading plan If FUN go up to $0.01400
will add more shorts)
Expecting target $0.010400 OR DOWN
In the event of an early exit,
this analysis will be updated.
Its not a Financial advice
FUNUSDT.P trade ideas
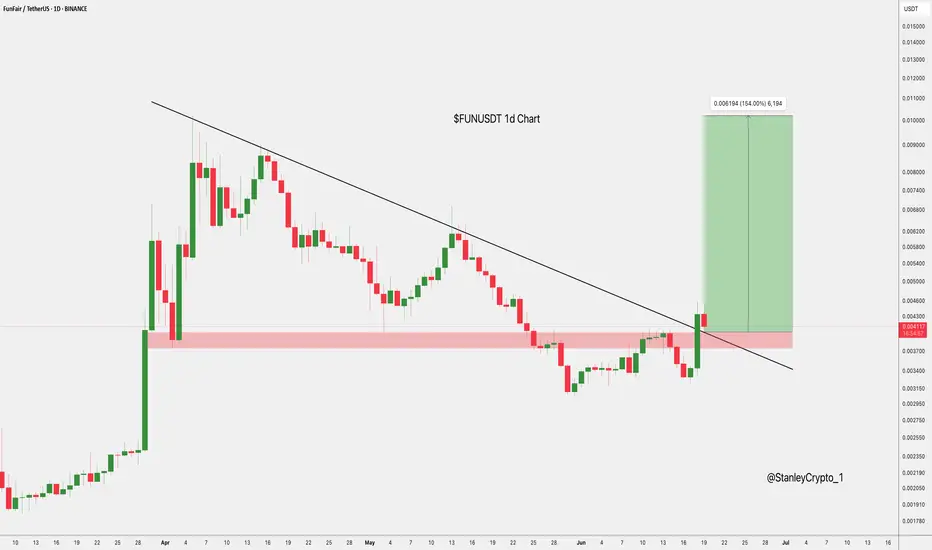
$FUNUSDT Breakout Setup NYSE:FUN has broken out of a long-term downtrend with strong bullish momentum.
It’s now retesting the breakout zone, which also aligns with a key support area.
If this level holds, the next target is 0.010199, a potential 154% move.
Clean breakout-retest setup in play.
DYRO, NFA
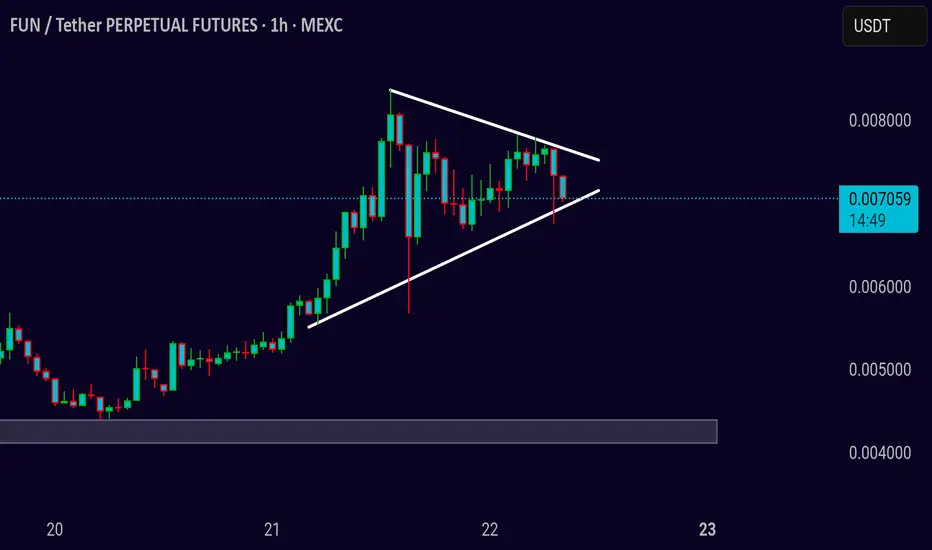
FUN/USDT – Triangle Formation Close to Breakout Point
Pair: FUN/USDT
Timeframe: 1H
Pattern: Symmetrical Triangle
FUN is consolidating inside a symmetrical triangle, but recent candles show pressure on the lower trendline. Price is hovering around 0.0070 and just tested the ascending support. This structure usually leads to a breakout — but the direction will depend on how price reacts in the next few candles.
**Bearish Bias:**
If the price breaks and closes below the triangle with volume, we may see a quick move toward the 0.0045–0.0050 support zone. Sellers are trying to push it out of consolidation.
**Bullish Scenario:**
To shift bullish, FUN must reclaim the 0.0075 level and break above the triangle resistance. Only then a trend reversal or new rally can begin.
No confirmed breakout yet — stay patient and let the move confirm itself.
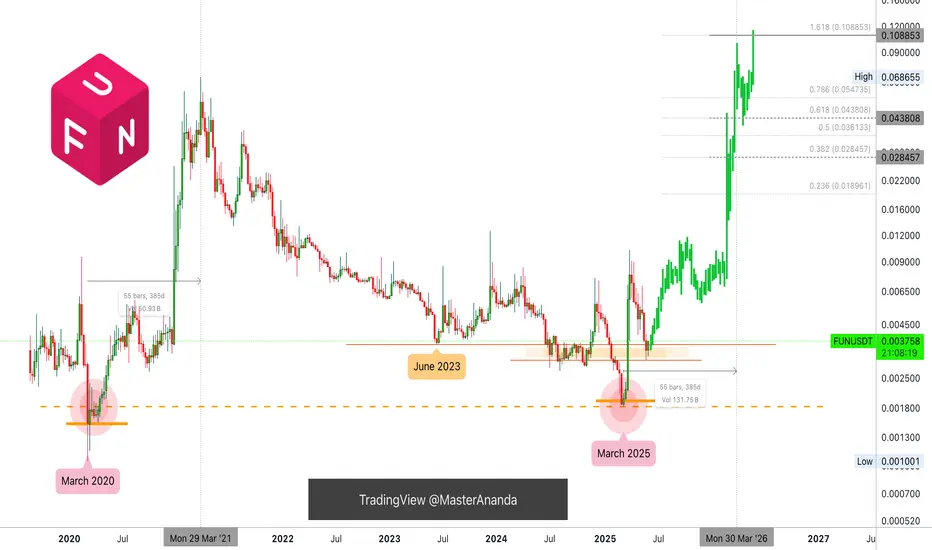
Fun Token: March 2026 New All-Time High? It Will Be FunA very strong bullish signal is present on this chart and we have some interesting price dynamics as well and a time-fractal to consider.
Good evening my fellow Cryptocurrency trader, how are you feeling today?
There was a very strong market flush recently with FUNUSDT (Fun Token), removing all LONGs and all SHORTs between December 2024 and April 2025.
After December, there was a crash producing a major low. The lowest prices in 5 years, since March 2020. Then immediately there was a strong rise producing the highest prices since December 2023. Then a retrace and the action goes back to baseline.
The multiple years long low removes all LONGs. The more than a year strong high removes all SHORTs. A full market flush.
The very strong bullish signal is related to the low point from June 2023. As the present retrace ends, the action is back above this level and this is super-bullish.
From March 2020 through late March 2021 we have 55 candles and 385 days. The same would give us a date of 30 March 2026 for the new ATH. That is if FUNUSDT grows in exactly the same way. This is just an entertaining exercise. This bull market can last 221 days, 180 days, 360 days... Anything goes. It can last 465 days for all I know, but, if the same pattern repeats, we have an entire year to see the market grow.
The exact date? The exact high? Anything goes.
What cannot be doubted is the fact that the Cryptocurrency market is set to produce the strongest growth period since 2021. It will be FUN.
Namaste.
FUNUSDT Forming Bullish BreakoutFUNUSDT is currently showing a bullish breakout from a long-term descending channel, indicating a potential reversal and strong upside momentum building. After a prolonged downtrend within the falling structure, the price has now breached resistance with notable volume support, signaling that buyers are beginning to regain control. This technical breakout, combined with fresh investor interest, adds significant weight to a potential bullish continuation move in the coming days and weeks.
The pattern visible here is suggestive of a classic trend reversal. With volume expanding and momentum indicators turning bullish, the setup implies a strong recovery is underway. Historical data shows that when FUNUSDT breaks out of such structures, it often leads to parabolic price movements. The chart projects a target gain of around 140% to 150%, with intermediate resistance levels offering multiple potential entries and take-profit zones. The initial breakout is already attracting attention from both retail and institutional traders.
On the fundamental side, FunFair continues to be a recognized name in the blockchain gaming and decentralized gambling space. Its legacy presence, combined with renewed volume interest and community activity, is contributing to the renewed investor enthusiasm. Additionally, the project is increasingly being mentioned across various trading forums and crypto communities, further amplifying the probability of a continued upward trend.
Overall, FUNUSDT is one of the more exciting low-cap altcoins currently in a technical sweet spot. With the breakout confirmed and bullish targets ahead, this could be a great opportunity for traders looking to capitalize on early-stage momentum before wider market recognition kicks in.
✅ Show your support by hitting the like button and
✅ Leaving a comment below! (What is You opinion about this Coin)
Your feedback and engagement keep me inspired to share more insightful market analysis with you!
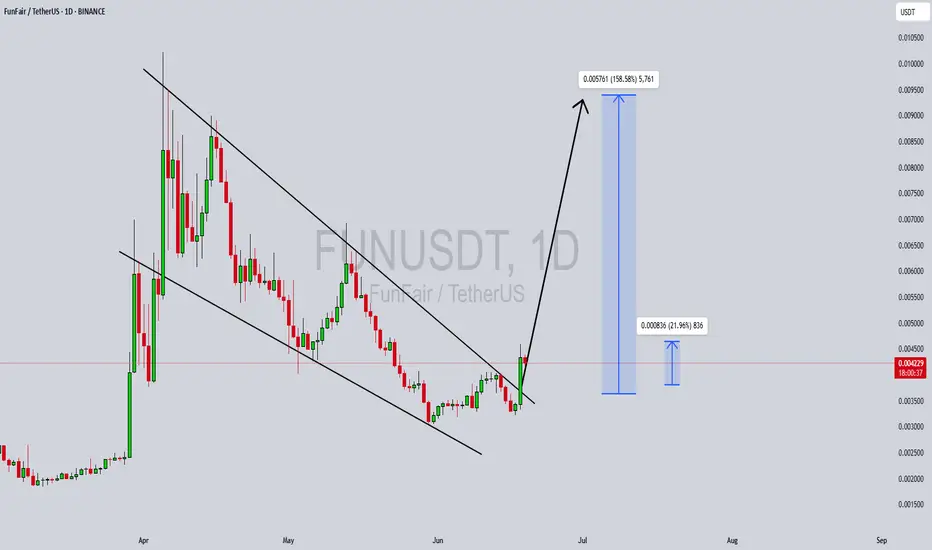
FUNUSDT UPDATEPattern: Falling Wedge Breakout
Current Price: $0.004488
Target Price: $0.0088
Target % Gain: 115.04%
Technical Analysis: FUN has broken out of a falling wedge pattern on the 1D chart with strong bullish momentum and volume spike. Breakout is confirmed with daily close above resistance trendline.
Time Frame: 1D

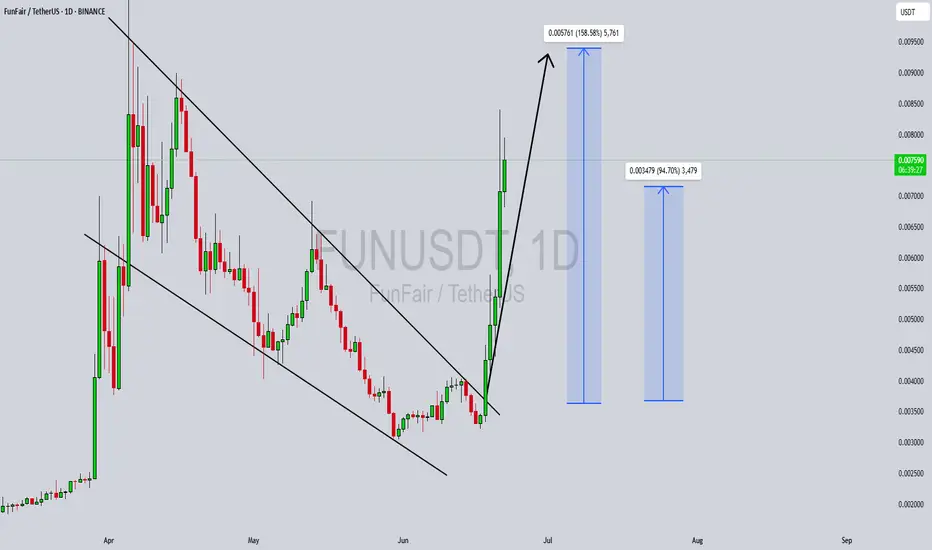
FUNUSDT Forming Classic Descending ChannelFUNUSDT has recently completed a significant breakout from a classic descending channel formation, which is a strong bullish reversal pattern. This breakout, fueled by a surge in volume and bullish sentiment, signals a shift in trend after an extended downtrend phase. The price action shows a clear escape from the consolidation zone, followed by strong green candles indicating aggressive buying pressure. Traders are now closely watching this pair for further continuation as momentum builds across the altcoin market.
With a projected gain of 70% to 80%, FUNUSDT stands out as a high-potential opportunity in the current crypto cycle. The breakout aligns with broader market recovery patterns and investor appetite for undervalued tokens. As technicals support this upward trajectory, many analysts believe this rally could extend beyond initial resistance levels, especially if volume remains consistent or grows further. The measured move targets align well with the height of the channel, giving confidence to those entering post-breakout.
Investors are clearly taking an interest in FUNUSDT, as reflected in the sharp upward movement and increased market activity. This shift suggests both short-term traders and longer-term holders are accumulating positions in anticipation of a larger market move. With momentum and structure now favoring bulls, FUNUSDT may continue to outperform similar-cap tokens in the weeks ahead.
For those following chart patterns and volume-based trading strategies, FUNUSDT is demonstrating a strong technical setup. The descending channel breakout, paired with fundamental optimism and liquidity inflow, could be the trigger for sustained upward movement.
✅ Show your support by hitting the like button and
✅ Leaving a comment below! (What is You opinion about this Coin)
Your feedback and engagement keep me inspired to share more insightful market analysis with you!
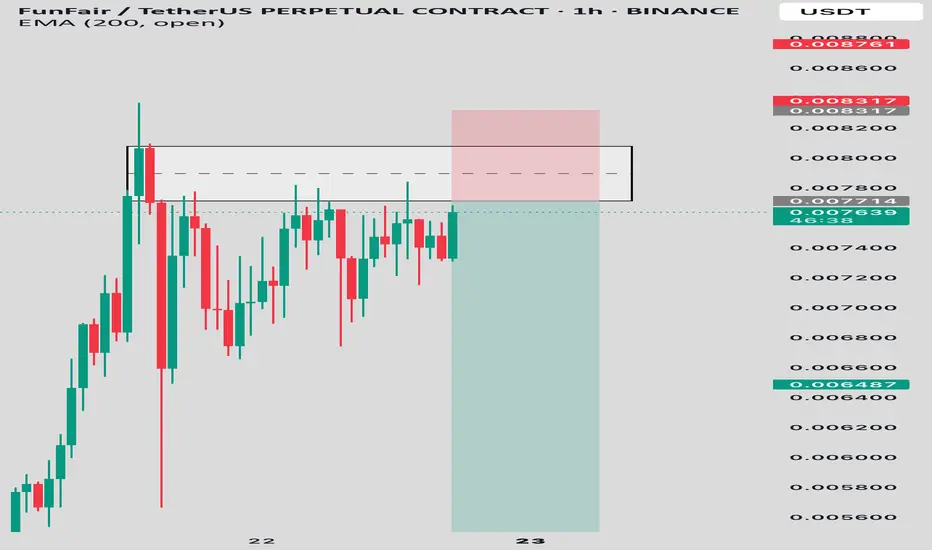
FUNUSDT SHORTAfter a strong impulsive rally, FUN/USDT tapped into a high-probability supply zone between 0.00771 – 0.00831, showing clear rejection with long upper wicks. Multiple attempts to break above the zone failed indicating buyer exhaustion and a potential reversal
• Entry: 0.00771
• Stop Loss: 0.008317 (above supply zone)
FUNUSDT Forming Falling WedgeFUNUSDT is currently forming a classic falling wedge pattern, which is widely recognized in technical analysis as a bullish reversal signal. As the price continues to compress within the wedge while holding higher volume on green candles, it suggests growing accumulation by investors. A breakout from this pattern could signal a significant price reversal, with an anticipated gain of 140% to 150%+ based on historical wedge breakout projections. The setup is becoming increasingly favorable for swing traders and mid-term holders.
FUNToken is drawing renewed investor attention due to its integration in blockchain gaming and online entertainment sectors. As demand for decentralized platforms and provably fair gaming continues to grow, FUNToken offers a well-positioned use case. The token has a history of sharp rallies following prolonged consolidation, and the current chart formation indicates that another major move may be imminent. Moreover, sentiment across social and community platforms around FUNToken is turning positive, boosting its speculative momentum.
The technical structure of the chart aligns with increasing trading volume and consistent support holding at key levels, signaling strong underlying demand. The falling wedge is narrowing, suggesting a potential imminent breakout. Once the upper resistance of the wedge is breached with strong volume, price could accelerate rapidly toward upper Fibonacci extension levels, aligning well with the projected 140% to 150% upside potential.
Given these factors, FUNUSDT stands out as a promising opportunity in the altcoin market. Traders and investors watching for strong technical breakouts with real use-case utility will likely find FUN appealing at current levels. Keep an eye on volume spikes and confirmation closes above the wedge for potential entry points.
✅ Show your support by hitting the like button and
✅ Leaving a comment below! (What is You opinion about this Coin)
Your feedback and engagement keep me inspired to share more insightful market analysis with you!

FUN/USDTKey Level Zone: 0.005300 - 0.005470
HMT v8.1 detected. The setup looks promising, supported by a previous upward/downward trend with increasing volume and momentum, presenting an excellent reward-to-risk opportunity.
HMT (High Momentum Trending):
HMT is based on trend, momentum, volume, and market structure across multiple timeframes. It highlights setups with strong potential for upward movement and higher rewards.
Whenever I spot a signal for my own trading, I’ll share it. Please note that conducting a comprehensive analysis on a single timeframe chart can be quite challenging and sometimes confusing. I appreciate your understanding of the effort involved.
Important Note :
Role of Key Levels:
- These zones are critical for analyzing price trends. If the key level zone holds, the price may continue trending in the expected direction. However, momentum may increase or decrease based on subsequent patterns.
- Breakouts: If the key level zone breaks, it signals a stop-out. For reversal traders, this presents an opportunity to consider switching direction, as the price often retests these zones, which may act as strong support-turned-resistance (or vice versa).
My Trading Rules
Risk Management
- Maximum risk per trade: 2.5%.
- Leverage: 5x.
Exit Strategy
Profit-Taking:
- Sell at least 70% on the 3rd wave up (LTF Wave 5).
- Typically, sell 50% during a high-volume spike.
- Adjust stop-loss to breakeven once the trade achieves a 1.5:1 reward-to-risk ratio.
- If the market shows signs of losing momentum or divergence, ill will exit at breakeven.
The market is highly dynamic and constantly changing. HMT signals and target profit (TP) levels are based on the current price and movement, but market conditions can shift instantly, so it is crucial to remain adaptable and follow the market's movement.
If you find this signal/analysis meaningful, kindly like and share it.
Thank you for your support~
Sharing this with love!
HMT v2.0:
- Major update to the Momentum indicator
- Reduced false signals from inaccurate momentum detection
- New screener with improved accuracy and fewer signals
HMT v3.0:
- Added liquidity factor to enhance trend continuation
- Improved potential for momentum-based plays
- Increased winning probability by reducing entries during peaks
HMT v3.1:
- Enhanced entry confirmation for improved reward-to-risk ratios
HMT v4.0:
- Incorporated buying and selling pressure in lower timeframes to enhance the probability of trending moves while optimizing entry timing and scaling
HMT v4.1:
- Enhanced take-profit (TP) target by incorporating market structure analysis
HMT v5 :
Date: 23/01/2025
- Refined wave analysis for trending conditions
- Incorporated lower timeframe (LTF) momentum to strengthen trend reliability
- Re-aligned and re-balanced entry conditions for improved accuracy
HMT v6 :
Date : 15/02/2025
- Integrated strong accumulation activity into in-depth wave analysis
HMT v7 :
Date : 20/03/2025
- Refined wave analysis along with accumulation and market sentiment
HMT v8 :
Date : 16/04/2025
- Fully restructured strategy logic
HMT v8.1 :
Date : 18/04/2025
- Refined Take Profit (TP) logic to be more conservative for improved win consistency
Update idea
Add note
Ren_MomentumTrader
Also on:
Disclaimer
The information and publications are not meant to be, and do not constitute, financial, investment, trading, or other types of advice or recommendations supplied or endorsed by
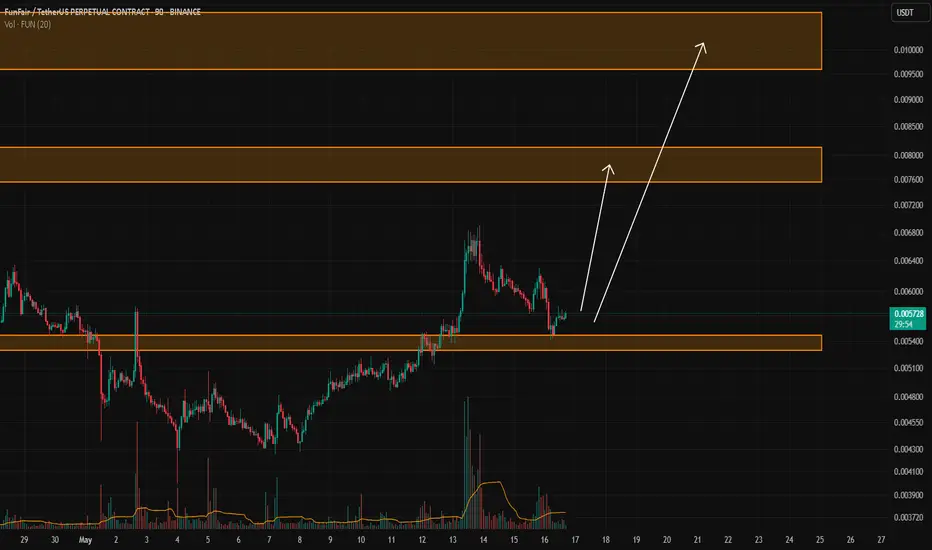
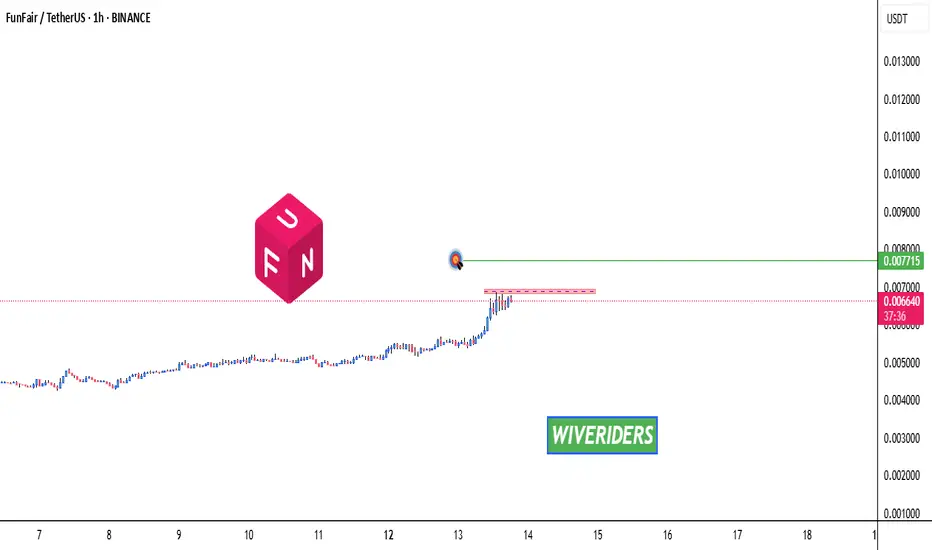
FUN Testing Red Resistance – Breakout Potential! 🚀 FUN Testing Red Resistance – Breakout Potential! 📈
FUN is currently testing the red resistance zone. If the price breaks through, the first target could be the green line level! 📊
Let’s catch this breakout together! 💼💸
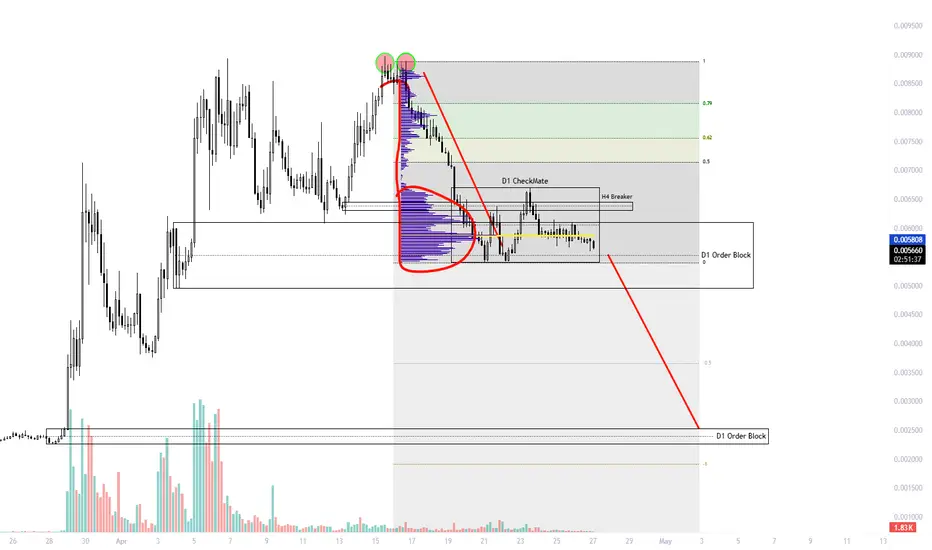
FUNUSDT Nice measured move to look for on the short side down to the next order block, or a retrace on the fib. some nice FUN swings in effect. watching the b profile( favoring sellers) as it builds this potential failing checkmate. A short for a dubbler from 0.0055 down to 0.0025. That sounds FUN'. n yes i spelled dubbler on purpose.

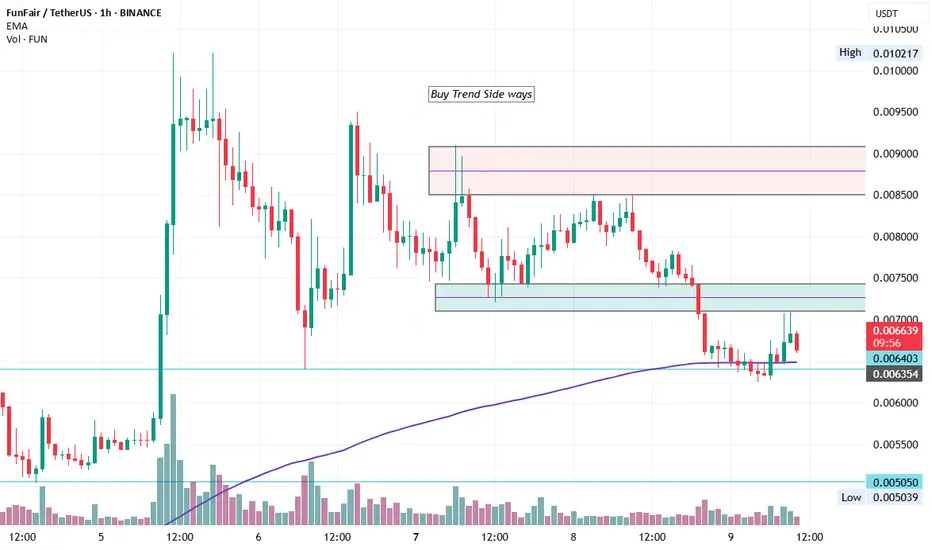
FUN/USDT In an Uptrend, Watching for Correction at Key SupportFUN/USDT has been in a solid uptrend, but we are now seeing a correction phase. The price is approaching a critical support zone around 0.007460, where previous price action has shown both support and resistance. This level is important to watch, as it could provide a potential buying opportunity if price reacts here. A break below could suggest further downside, but if support holds, a bounce toward the recent highs is possible. Monitoring closely for confirmation at this key level.

FUNUSDTLooking for the third leg in the trend? being prepared is the best i can do.
Why not go have a little "FUN" while everyone else is tied up in QT. I really like how the monthly and the weekly stochastics are both up. Maybe some volume coming?? Holding this Breaker block, Not to mention the anchored VWAP.. And, did I mention its above all the Daily Moving Averages. So a third leg to 1 penny? Makes cents to have a little fun.

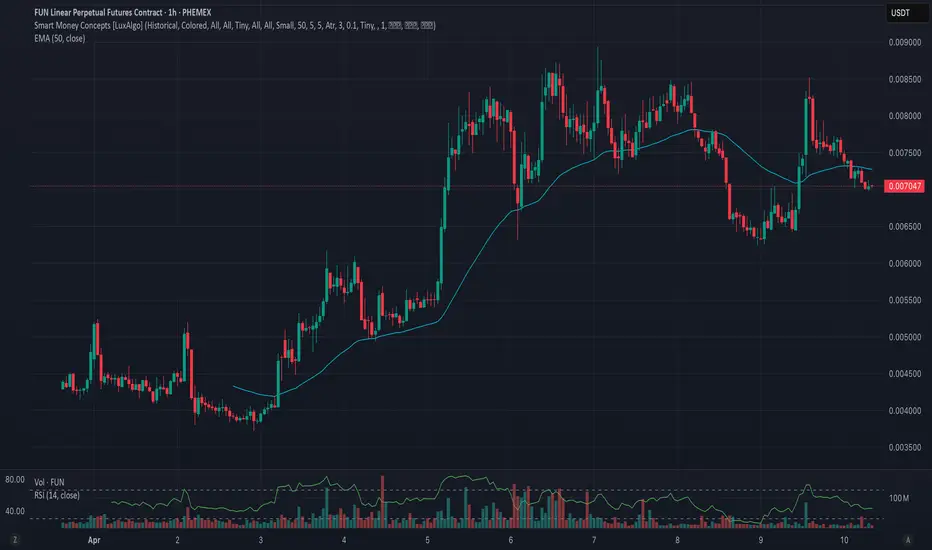
Phemex Analysis #72: Pro Tips for Trading FunToken (FUN)FunToken ( PHEMEX:FUNUSDT.P ) has surged in the crypto market, rising over 270% in the past month. This surge is attributed to its integration with the Binance Smart Chain (BSC) and the release of a roadmap that focuses on mobile gaming. Unlike many GameFi projects that prioritize web/desktop games, FUN is focusing on the mobile gaming sector, with plans to launch 40 mobile games featuring an "Earn-While-You-Play" mechanism. This strategic direction has generated significant market excitement regarding its growth potential.
Possible Scenarios
To provide a framework for trading FUN, let's explore potential scenarios based on technical analysis and market dynamics:
1. Bullish Breakout Continuation
If FUN sustains its upward momentum and breaks through key resistance levels with strong volume, it could signal a continuation of the bullish trend.
Pro Tips:
Identify key resistance levels, such as $0.85 and $0.89.
Consider entering a long position on a confirmed breakout above resistance with increasing volume and a high RSI (such as above 70).
Set a stop-loss order below the breakout point to manage risk.
2. Consolidation and Range Trading
After a significant price increase, FUN may enter a period of consolidation, trading within a defined range.
Pro Tips:
Identify key support ($0.006) and resistance levels ($0.009) that define the trading range.
Consider range-bound trading strategies, such as buying near support and selling near resistance; or consider using Phemex Grid Bots to capitalize on small price movements.
Remember to place stop-loss orders outside the range to prepare for potential breakouts or breakdowns.
3. Bearish Retracement.
A significant price surge is often followed by a retracement, especially as the broader market sentiment is currently bearish. If FUN fails to hold support levels ($0.006), it could experience a bearish retracement.
Pro Tips:
Monitor key support levels ($0.0064, $0.006).
Consider exiting long positions or reducing exposure if strong bearish signals appear.
Consider shorting opportunities on a break below key support, but exercise caution and manage risk carefully.
Conclusion
FUN Token's recent price action has demonstrated significant bullish momentum, driven by its strategic focus on the mobile gaming sector and its integration with the Binance Smart Chain. Traders should closely monitor price action, volume, and key support and resistance levels to identify potential trading opportunities. By considering various market scenarios and implementing appropriate risk management strategies, traders can navigate the volatility of the cryptocurrency market and capitalize on potential trends in FUN Token.
Tips:
🔥 Break free from "buy low, sell high"! Our new Pilot Contract empowers you to profit from ANY market direction on DEX coins with up to 3x leverage. Go long, go short, go further!
Check out Phemex - Pilot Contract today!
Disclaimer: This is NOT financial or investment advice. Please conduct your own research (DYOR). Phemex is not responsible, directly or indirectly, for any damage or loss incurred or claimed to be caused by or in association with the use of or reliance on any content, goods, or services mentioned in this article.
a chance to short FUNa chance to short FUN.
FUN has a big chance of finishing the uptrend.
short this with stop loss


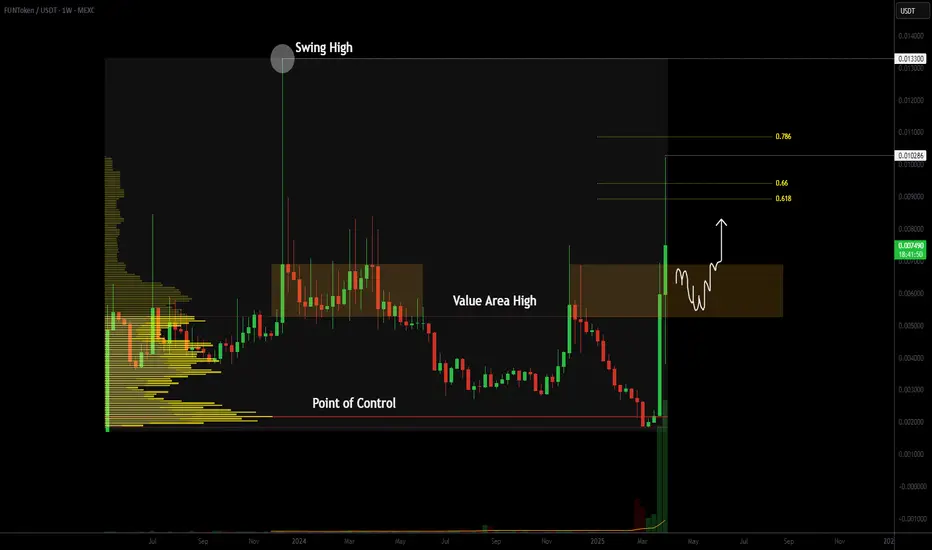
FunUSDT Weekly Outlook, Key Support RegionHello traders,
In today’s altcoin update we’re looking at FunUSDT on the weekly timeframe. Price action is showing signs of strength, currently respecting the point of control and trading above the value area low, which is providing a strong technical base.
Key Technical Points:
• Break Above Value Area High: Price impulsively moved through the value area high and tapped into the 0.618 Fibonacci, before facing rejection.
• Critical Support Zone: Holding above the previous value area high is key for any further continuation to the upside.
• Target: If price consolidates above value with increasing volume, there is potential for a move back toward the swing high at 0.01.
The recent breakout shows momentum, but for continuation higher, weekly consolidation above value is essential. This will confirm buyer commitment and allow a new leg up toward the swing high.
If, however, the value area high fails to hold as support, we could see price rotate back toward the lows. This is a high-risk setup, so close attention to volume and weekly structure is necessary before committing to any directional bias.
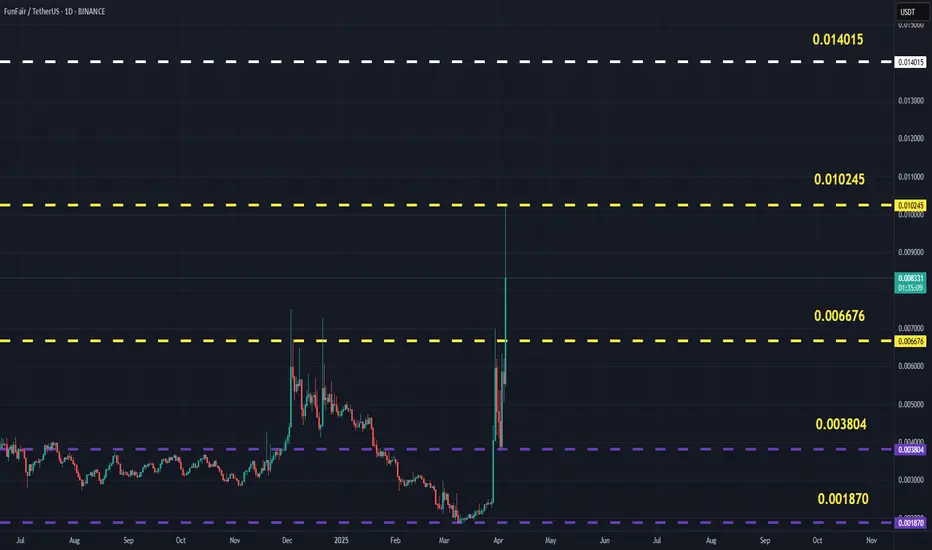
FUNUSDT(FUNToken) Updated till 05-04-25FUNUSDT(FUNToken) Daily timeframe range. while other alts going banana this thing doing pretty well till now. continuous push till 0.010245 which is local resistance. if it can have a confirm close above 0.006676 it will retrace back to 0.010245.
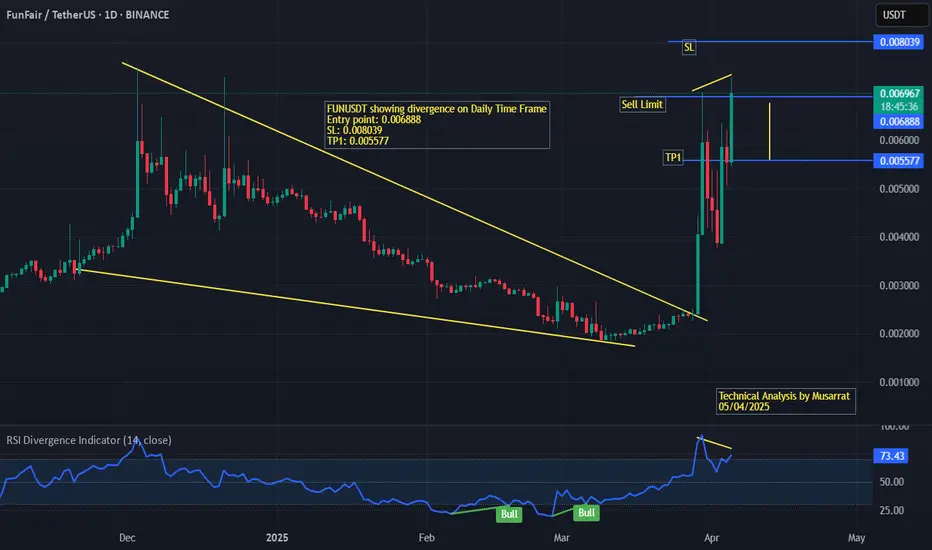
FUNUSDT showing Divergence on Daily Time FrameFUN/USDT after making the falling wedge pattern went for again testing the highest level of the daily timeframe, is now showing divergence and will go down . No long trades are suggested right now. The traders should wait for the right set up, if found for downward or short trade.
FUNUSDT CHART ANALYSİS - EDUCATIONAL POSTThe NFT Concept
You may already know that each unit of value in a blockchain is called a token. In an open blockchain, all tokens are equal and interchangeable. For example, one bitcoin can be easily replaced with another, and nothing will change.
Non-fungible tokens are a game-changer, which work differently. An NFT is a digital asset that cannot be replaced with another token without changing the value and basis of the object.
Like cryptocurrency, NFTs are created on a blockchain, which acts as a database to record all transactions. The blockchain guarantees the uniqueness, safety, and anonymity of non-fungible tokens. Thanks to this system, any user can verify the originality and transparency of the history of a particular NFT through the blockchain.
When you buy an NFT token, you are obtaining a certificate for a digital or real object. However, the work itself doesn’t move anywhere. You only use its digitized file or a certificate of ownership. Once created or purchased, the token sits in perpetual storage. This certificate is just lines of code that confirm it is the token owner who has the original copy of the object.
An NFT token can be compared to a painting, which may belong to a gallery, museum, or individual, but the audience can see it in a catalog or exhibition.
NFT tokens are sold in online marketplaces that operate like Amazon. The creators put them on marketplaces and wait for bids from buyers.
An NFT token can be created by you or by anyone for that matter. To do this, you need to take a digital object (picture, music, photo, etc.), register in a particular marketplace on a platform such as Rarible or OpenSea, and upload the object with a description and price. You will have to pay a fee for creating a blockchain entry on many platforms. However, the costs pay off in most cases, as NFTs are #1 in the crypto world today.
