GBPCHF I Weekly CLS I Model 2 I Target full CLS rangeYo Market Warriors ⚔️
Fresh outlook drop — if you’ve been riding with me, you already know:
🎯My system is 100% mechanical. No emotions. No trend lines. No subjective guessing. Just precision, structure, and sniper entries.
🧠 What’s CLS?
It’s the real smart money. The invisible hand behind $7T/day — banks, algos, central players.
📍Model 1:
HTF bias based on the daily and weekly candles closes,
Wait for CLS candle to be created and manipulated. Switch to correct LTF and spot CIOD. Enter and target 50% of the CLS candle.
For high probability include Dealing Ranges, Weekly Profiles and CLS Timing.
Analysis done on the Tradenation Charts
Disclosure: I am part of Trade Nation's Influencer program and receive a monthly fee for using their TradingView charts in my analysis.
Trading is like a sport. If you consistently practice you can learn it.
“Adapt what is useful. Reject whats useless and add whats is specifically yours.”
David Perk aka Dave FX Hunter
💬 Don't hesitate to ask any questions or share your opinions
GBPCHF trade ideas

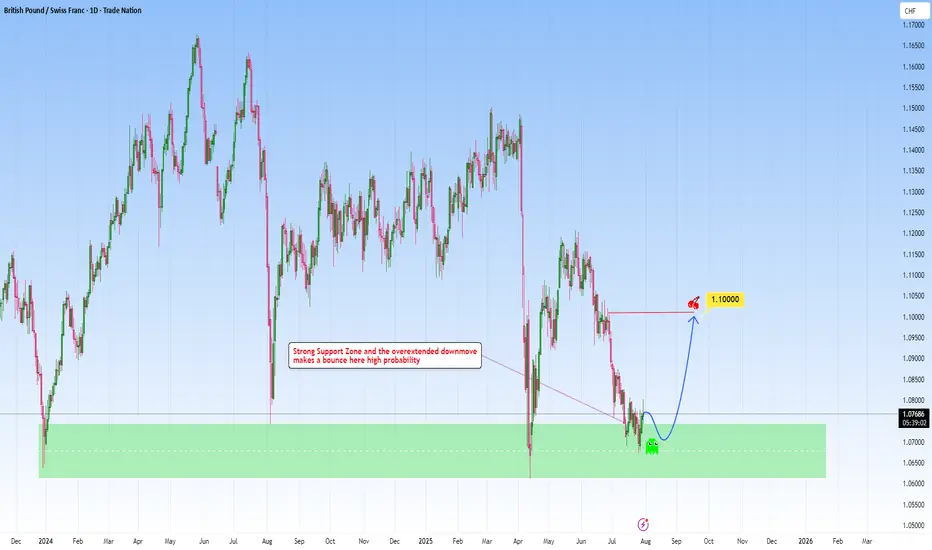
GBPCHF meets strong support: A reversal here is high probabilityLooking at GBPCHF and how it fits within my approach to structure-based trading, this one is really speaking my language.
Price has come down into a key higher-timeframe support zone: a zone that’s proven itself multiple times in the past. Now, price has shown some initial rejection there, making my long position towards 1.1000 a clear, rational target.
What makes this setup different could be the patience behind it. As we let the market complete its downward leg, waited for price to revisit a reliable zone, and now anticipating a bounce back. It’s a move that I’ve captured across my previous charts again and again.
Let me know in the comments what you think
Disclosure: I am part of Trade Nation's Influencer program and receive a monthly fee for using their TradingView charts in my analysis.
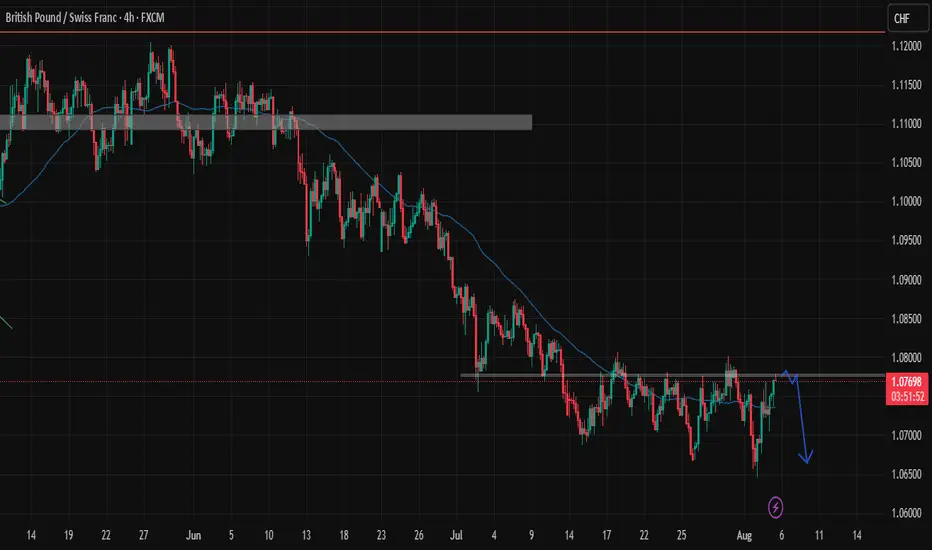
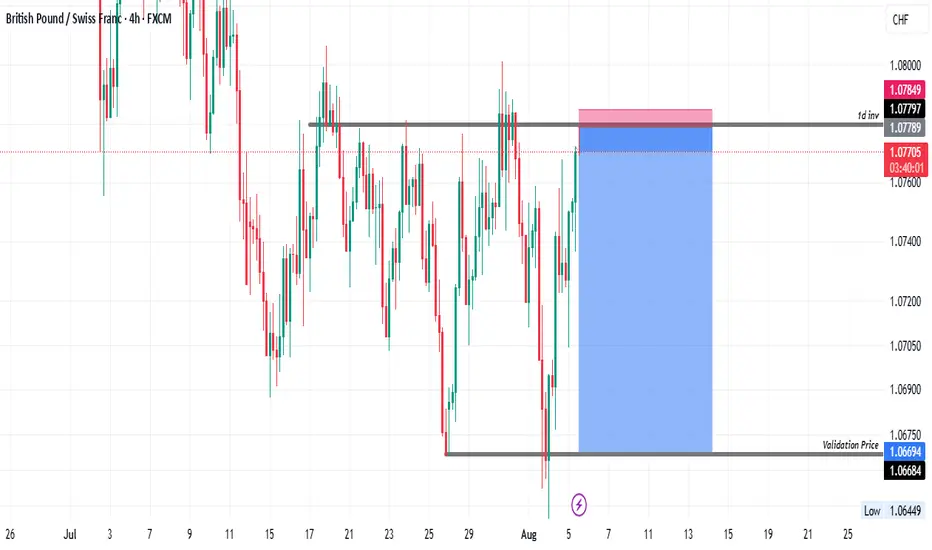
GBPCHF; RETEST AND CONTINUATION LOWERHello traders
GBPCHF has been on a downtrend, broke below a strong resistance and currently
retesting it @ 1.0777
we expect a bounce and continuation lower targeting our previous low @ 1.0655
break above 1.084 will invalidate this idea
GOOD LUCK
GBPCHF Will Collapse! SELL!
My dear followers,
I analysed this chart on GBPCHF and concluded the following:
The market is trading on 1.0756 pivot level.
Bias - Bearish
Technical Indicators: Both Super Trend & Pivot HL indicate a highly probable Bearish continuation.
Target - 1.0731
About Used Indicators:
A super-trend indicator is plotted on either above or below the closing price to signal a buy or sell. The indicator changes color, based on whether or not you should be buying. If the super-trend indicator moves below the closing price, the indicator turns green, and it signals an entry point or points to buy.
Disclosure: I am part of Trade Nation's Influencer program and receive a monthly fee for using their TradingView charts in my analysis.
———————————
WISH YOU ALL LUCK

GBPCHF RETAINS BEARISH MOMENTUMInstitutional (COT) data shows a net reduction in GBP exposure, suggesting big money is pulling out of the pound. Retail sentiment also leans heavily against the trend, with traders buying the dip — another contrarian bearish signal. Seasonality does not favor the pair in August either, with historic trends leaning against GBP performance this time of year.
On the macro side, UK economic data continues to weaken. Both manufacturing and services PMI are deteriorating, indicating contraction across sectors.
Retail sales and GDP growth are negative, while inflationary pressure is easing — all of which reduces the urgency for further BOE tightening. Employment metrics are also weak, with poor job creation and falling labor market momentum.
Meanwhile, Switzerland is showing relative macro strength. The SNB is benefiting from stable inflation and its traditional safe-haven appeal, which is further boosted by rising global risk-off sentiment. Interest rate expectations are neutral for CHF but increasingly dovish for the UK, creating clear policy divergence in CHF’s favor.
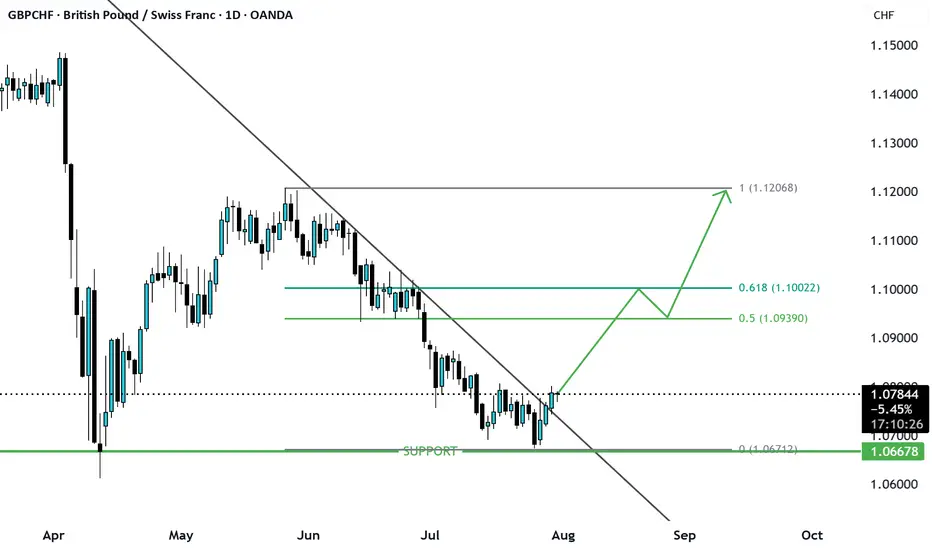
GBP/CHF Bullish Reversal Setup – Eyes on 1.11897 & 1.13607 Targe📈 GBP/CHF Bullish Reversal Setup – Eyes on 1.11897 & 1.13607 Targets 🎯
Pair: GBP/CHF
Timeframe: 1D
Status: Bullish Reversal Anticipation
Date: August 6, 2025
📝 Analysis:
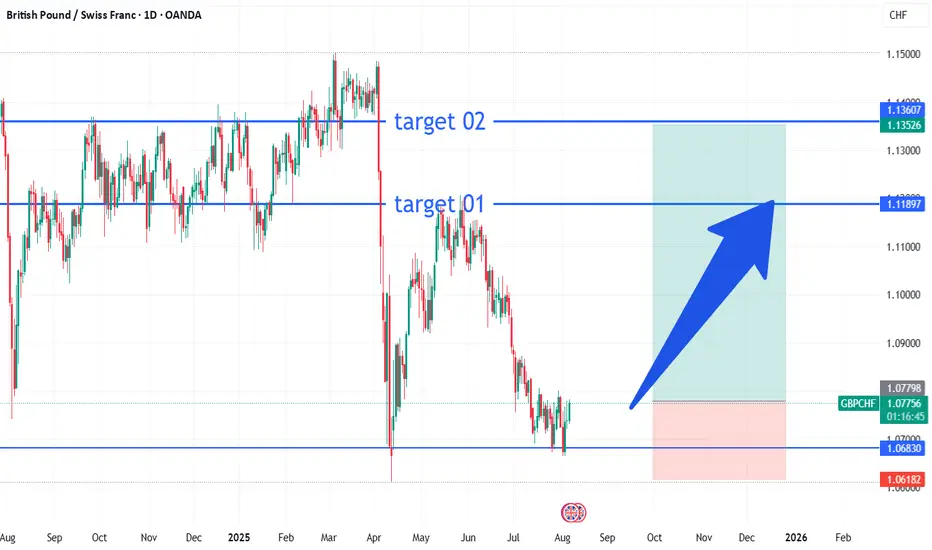
GBP/CHF has been consolidating near the key support zone around 1.06830, showing signs of potential bottoming. Price action indicates a possible bullish reversal after an extended downtrend. The setup suggests a favorable risk-to-reward scenario for a long position.
💡 Trade Idea:
Entry: 1.07756 (current market price)
Target 01: 1.11897
Target 02: 1.13607
Stop Loss: 1.06182 (below strong support)
Risk-Reward Ratio: Over 2:1
With clear structure and previous price memory at target zones, this setup is attractive for swing traders looking for medium- to long-term gains.
📌 Key Levels to Watch:
Major Support: 1.06830
Intermediate Resistance: 1.11897
Extended Target Resistance: 1.13607
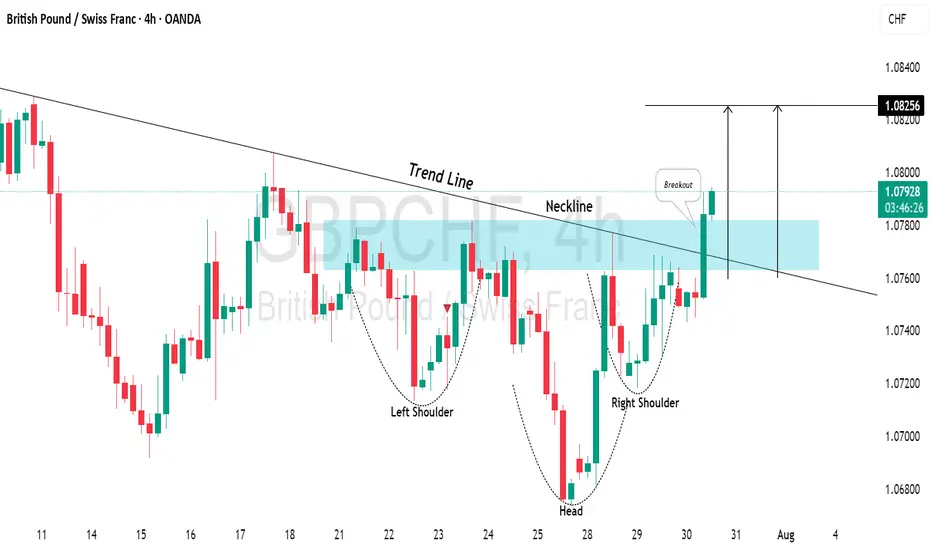
GBPCHF: Very Bullish OutlookI see 2 strong bullish confirmations on 📈GBPCHF on a 4H time frame.
The price has broken above a key descending trend line and the neckline of an inverted head and shoulders pattern.
This suggests a high likelihood of further upward movement, with the next resistance level at 1.0825.
GBP/CHF BEST PLACE TO BUY FROM|LONG
Hello, Friends!
GBP/CHF pair is in the uptrend because previous week’s candle is green, while the price is clearly falling on the 2H timeframe. And after the retest of the support line below I believe we will see a move up towards the target above at 1.073 because the pair is oversold due to its proximity to the lower BB band and a bullish correction is likely.
Disclosure: I am part of Trade Nation's Influencer program and receive a monthly fee for using their TradingView charts in my analysis.
✅LIKE AND COMMENT MY IDEAS✅

looks like GBPCHF ready to start bullish rallyafter marking last LH & LL price made support level and got a decent bounce enough to break the marked bearish trendline and also retest it which is a major confluence for a bullish trend. Buy stop order has been shown on the chart

GBPCHF oversold bounce backs capped at 1.0875The GBPCHF pair is currently trading with a bearish bias, aligned with the broader downward trend. Recent price action shows a retest of the falling resistance, suggesting a temporary relief rally within the downtrend.
Key resistance is located at 1.0875, a prior consolidation zone. This level will be critical in determining the next directional move.
A bearish rejection from 1.0875 could confirm the resumption of the downtrend, targeting the next support levels at 1.0715, followed by 1.0670 and 1.0625 over a longer timeframe.
Conversely, a decisive breakout and daily close above 1.0875 would invalidate the current bearish setup, shifting sentiment to bullish and potentially triggering a move towards 1.0900, then 1.0940.
Conclusion:
The short-term outlook remains bearish unless the pair breaks and holds above 1.0875. Traders should watch for price action signals around this key level to confirm direction. A rejection favours fresh downside continuation, while a breakout signals a potential trend reversal or deeper correction.
This communication is for informational purposes only and should not be viewed as any form of recommendation as to a particular course of action or as investment advice. It is not intended as an offer or solicitation for the purchase or sale of any financial instrument or as an official confirmation of any transaction. Opinions, estimates and assumptions expressed herein are made as of the date of this communication and are subject to change without notice. This communication has been prepared based upon information, including market prices, data and other information, believed to be reliable; however, Trade Nation does not warrant its completeness or accuracy. All market prices and market data contained in or attached to this communication are indicative and subject to change without notice.

GBPCHF LONG/BUY 1:7 PROBABILITYREASON FOR TRADE:
1. Expanding flat in play
2. Order block unmitigated
3. MACD divergence
4. Lquidity (1.08224)
Entry: 1.06994
Stop Loss: 1.06797
Take Profit: 1.08224

Technical Analysis: GBP/CHF (British Pound / Swiss Franc)Timeframe: Hourly (H1) – *Data as of Aug 01, 2025, 14:33 UTC+4*
Source: OANDA via TradingView
1. Key Price Levels
Current Price (C): 1.07357 (+0.09% from previous close).
High/Low (H/L): 1.07386 / 1.07308 (narrow range, indicating consolidation).
Resistance Levels:
R1: 1.07514 (near-term resistance).
R2: 1.08208 (stronger resistance).
Pivot Point (P): 1.07723 (intraday benchmark).
2. Price Action & Trends
Short-Term Trend: Slightly bullish (+0.09% gain), but trading near the day’s low (1.07308).
Volatility: Low (tight range between 1.07308–1.07386).
Support Zone: 1.07200–1.07335 (critical for bearish reversals).
3. Technical Indicators (Implied)
Pivot Points (PVC): Price is below the pivot (1.07723), suggesting bearish pressure unless it breaks above.
Resistance/Support:
Bulls need to push above R1 (1.07514) to target R2 (1.08208).
Bears aim for S1 (1.07335) or lower (1.07200).
4. Trading Signals
Bullish Scenario: Break above 1.07514 (R1) could signal upward momentum toward 1.07723 (Pivot).
Bearish Scenario: Drop below 1.07308 (today’s low) may extend losses to 1.07200.
Neutral Zone: Price oscillating between 1.07308–1.07386 suggests indecision.
5. Risk Management
Stop-Loss (S/L): Below 1.07200 for longs; above 1.07514 for shorts.
Take-Profit (T/P):
Longs: 1.07723 (Pivot) or 1.08000 (psychological level).
Shorts: 1.07200 or 1.07000.
6. Conclusion
Current Bias: Neutral-to-slightly bullish, but lacks strong momentum.
Watch For: Breakout from the 1.07308–1.07514 range for directional clarity.
Caution: Low volatility may lead to false breakouts; confirm with volume/RSI if available.
Recommendation: Wait for a confirmed breakout with volume before entering trades.

GBPCHF – Fade into Strength Near ResistanceTrade Idea
Type: Sell Limit
Entry: 1.0798
Target: 1.0697
Stop Loss: 1.0833
Duration: Intraday
Expires: 06/08/2025 06:00
Technical Overview
Bearish momentum remains intact, with no signs of reversal yet.
The pair has stalled near the previous swing low at 1.0673, suggesting the downside move may soon resume.
A corrective bounce is expected, offering an opportunity to sell into strength.
Bespoke resistance sits at 1.0798, aligning with the entry level for this setup.
Key Technical Levels
Resistance: 1.0905 / 1.1030 / 1.1120
Support: 1.0740 / 1.0610 / 1.0535
Disclosure: I am part of Trade Nation's Influencer program and receive a monthly fee for using their TradingView charts in my analysis.

GBPCHF Break of trendline resistance GBPCHF has formed W pattern at the support and price looks to be reverses after the trendline resistance has been broken the first target will be the fib 0.5 of recent swing high if breaks down then it may go to Fib 1 . let us see
GBPCHF High Probability low risk Idea.We are bearish in the weekly and daily.
Prices have currently tested the 4hr diminution and reacted.
We took the trade risking not more than 10 pips aiming for a 1:10 reward.
GBPCHF Strong Bullish Breakout!
HI,Traders !
#GBPCHF is trading in a strong
Uptrend and the price
Made a bullish breakout
Of the key horizontal level
Of 1.07860 and the breakout
Is confirmed so we are
Bullish biased and we will
Be expecting a further move
Up after the potential pullback !
Comment and subscribe to help us grow !

GBPCHF Wave Analysis – 4 August 2025
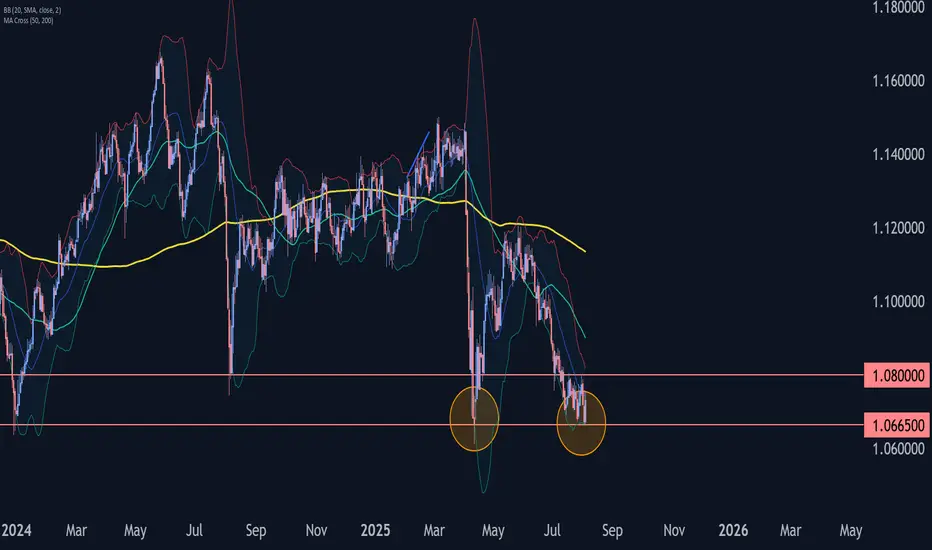
- GBPCHF reversed from key support level 1.0665
- Likely to rise to the resistance level 1.0800
GBPCHF currency pair recently reversed from the support zone between the pivotal support level 1.0665 (former strong support from April) and the lower daily Bollinger Band.
The upward reversal from this support zone will likely form the daily Japanese candlesticks reversal pattern Bullish Engulfing, if the pair closes today near the current levels.
Given the strength of the support level 1.0665 and the bullish divergence on the daily Stochastic, GBPCHF can be expected to rise to the next resistance level 1.0800 (which stopped earlier corrections (ii) and ii).
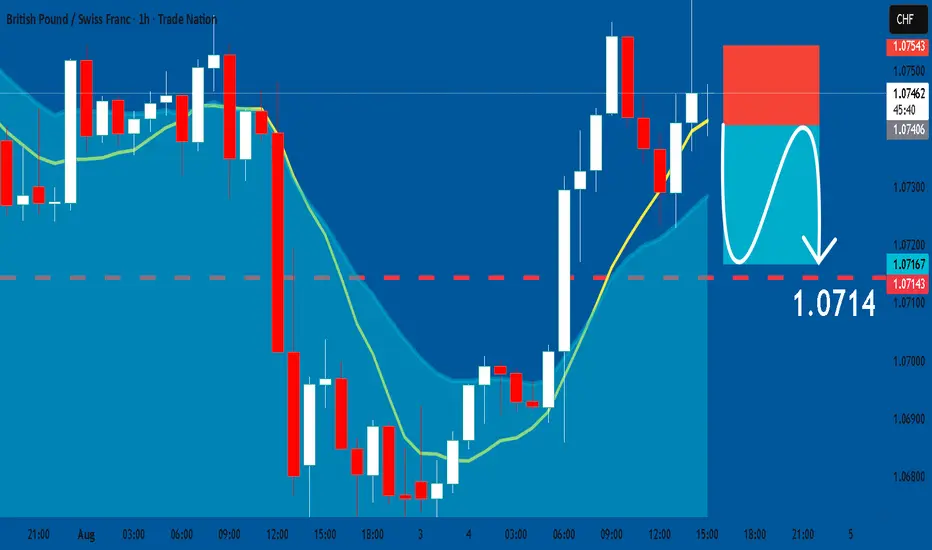
GBPCHF: Short Signal with Entry/SL/TP
GBPCHF
- Classic bearish setup
- Our team expects bearish continuation
SUGGESTED TRADE:
Swing Trade
Short GBPCHF
Entry Point - 1.0741
Stop Loss - 1.0754
Take Profit - 1.0714
Our Risk - 1%
Start protection of your profits from lower levels
Disclosure: I am part of Trade Nation's Influencer program and receive a monthly fee for using their TradingView charts in my analysis.
❤️ Please, support our work with like & comment! ❤️
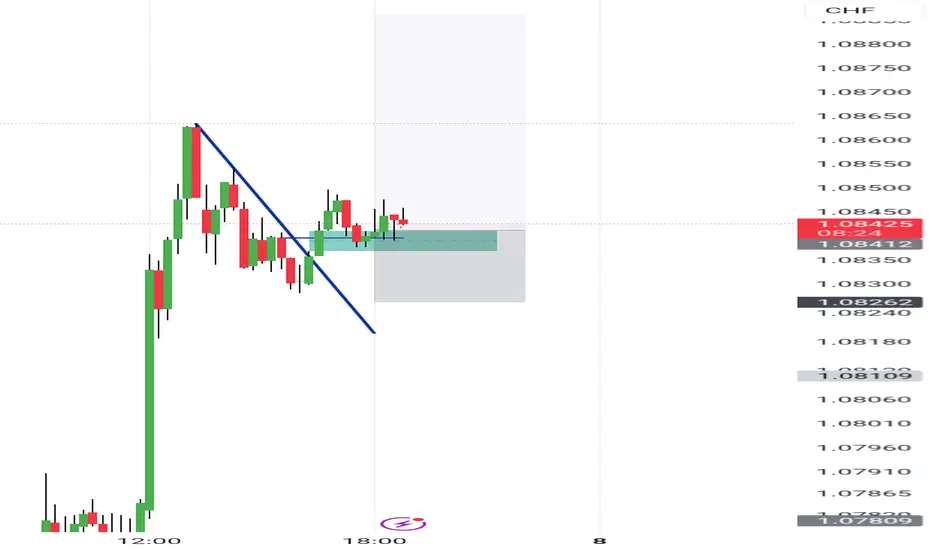
GBPCHF TRADE IDEA We were in on a continuation trade to the downside on GBPCHF.
Price moved back to our Fibonacci level and pulled back down south.

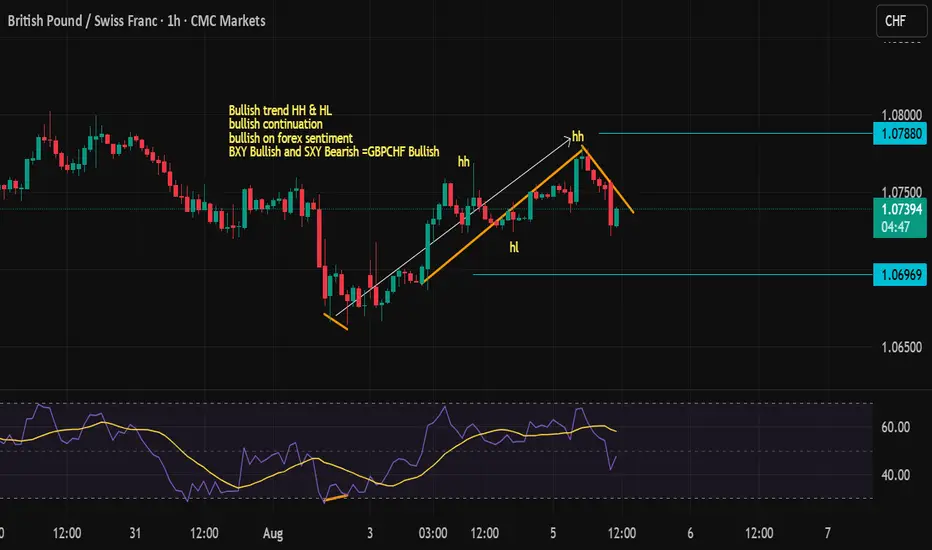
GBPCHFBullish trend HH & HL
bullish continuation
bullish on forex sentiment
BXY Bullish and SXY Bearish = GBPCHF Bullish
Buy GBPCHFPrice retraced into previous bullish order block.... targeting liquidity above previous days high

GBPCHF SHORT Market structure bearish on HTFs 3
Entry at Daily AOi
Weekly Rejection at AOi
Daily Rejection at AOi
Previous Structure point Daily
Around Psychological Level 1.07500
H4 EMA retest
H4 Candlestick rejection
Rejection from Previous structure
Levels 2.98
Entry 100%
REMEMBER : Trading is a Game Of Probability
: Manage Your Risk
: Be Patient
: Every Moment Is Unique
: Rinse, Wash, Repeat!
: Christ is King.
