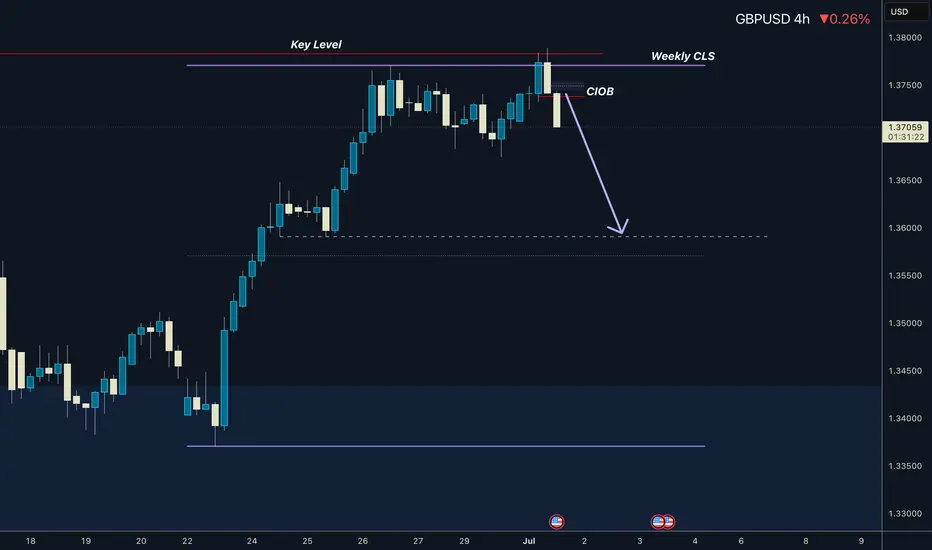
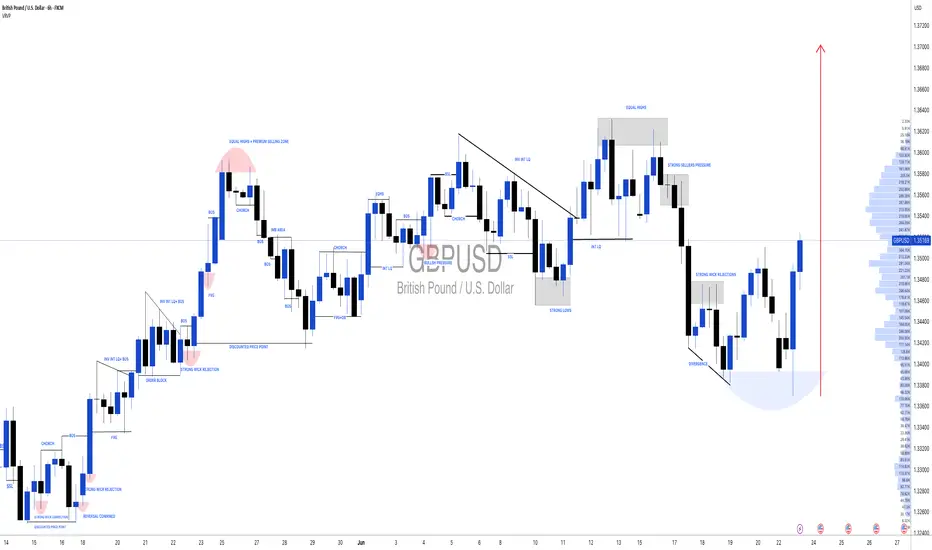
GBPUSD I Weekly CLS I Model 1 I Target 50%Hey, Market Warriors, here is another outlook on this instrument
If you’ve been following me, you already know every setup you see is built around a CLS Footprint, a Key Level, Liquidity and a specific execution model.
If you haven't followed me yet, start now.
My trading system is completely mechanical — designed to remove emotions, opinions, and impulsive decisions. No messy diagonal lines. No random drawings. Just clarity, structure, and execution.
🧩 What is CLS?
CLS is real smart money — the combined power of major investment banks and central banks moving over 6.5 trillion dollars a day. Understanding their operations is key to markets.
✅ Understanding the behavior of CLS allows you to position yourself with the giants during the market manipulations — leading to buying lows and selling highs - cleaner entries, clearer exits, and consistent profits.
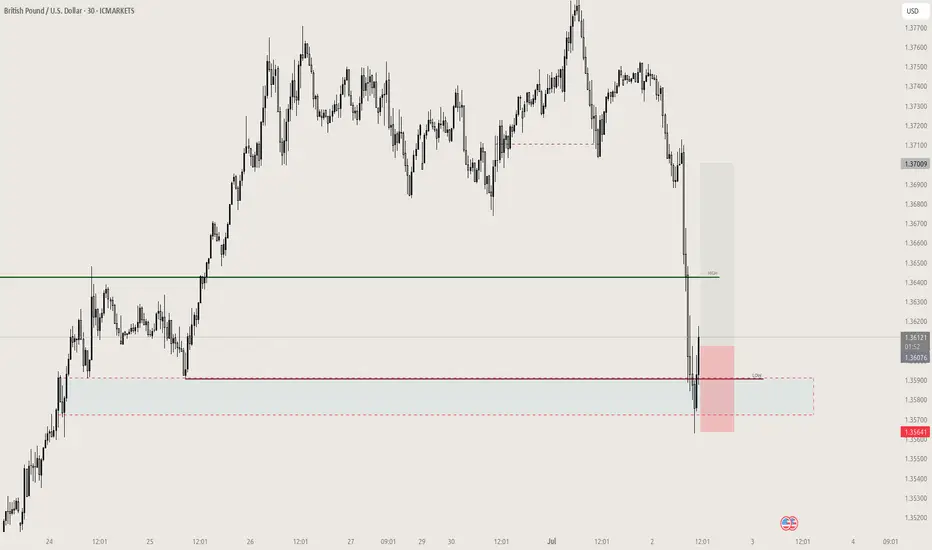
📍 Model 1
is right after the manipulation of the CLS candle when CIOD occurs, and we are targeting 50% of the CLS range. H4 CLS ranges supported by HTF go straight to the opposing range.
"Adapt what is useful, reject what is useless, and add what is specifically your own."
— David Perk aka Dave FX Hunter ⚔️
👍 Hit like if you find this analysis helpful, and don't hesitate to comment with your opinions, charts or any questions.
GBPUSD trade ideas
#GBPUSD: Detailed View Of Next Possible Price Move! GBPUSD exhibited a favourable movement after rejecting a pivotal level previously identified. We anticipate a smooth upward trajectory, potentially reaching approximately 1.45. Conversely, the US Dollar is on the brink of collapse around 90, which will directly propel the price into our take-profit range.
During GBPUSD trading, it is imperative to adhere to precise risk management principles. Significant news is scheduled to be released later this week.
We kindly request your support by liking, commenting, and sharing this idea.
Team Setupsfx_
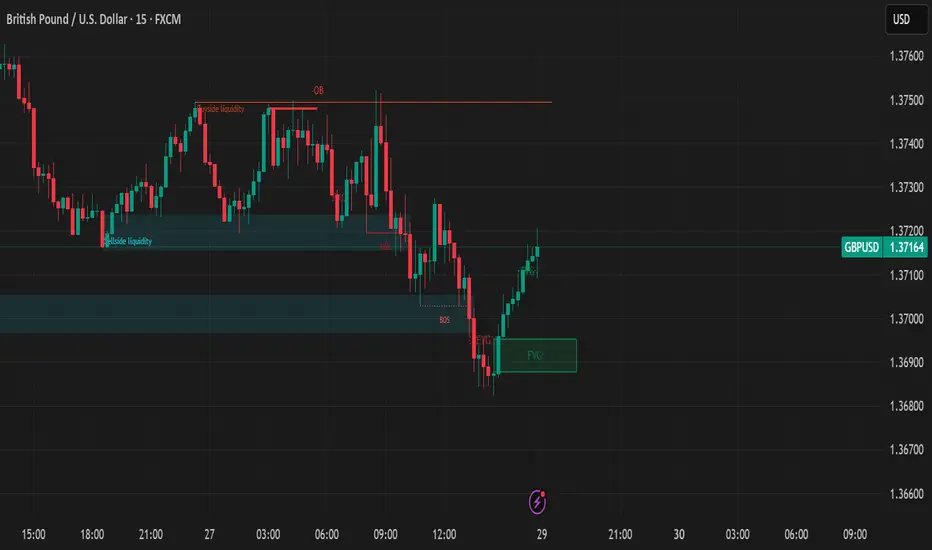
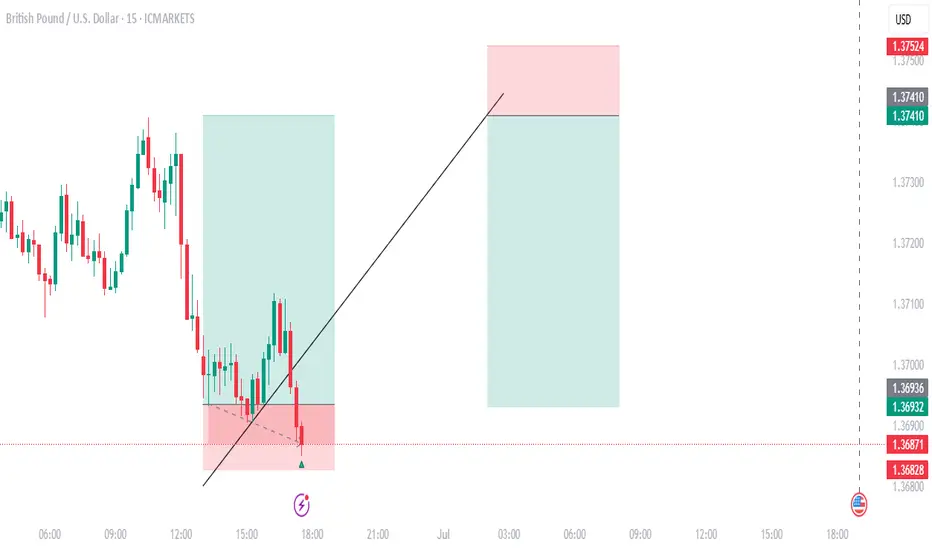
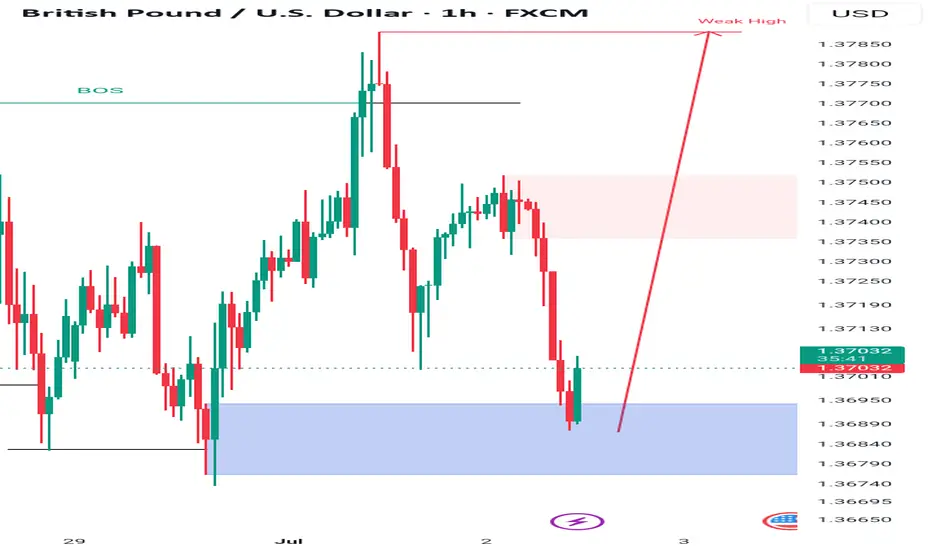
GBP/USD - Long 4H looks has formed bullish FVG
15 mins is also bullish - it might take out buyside liquidity at 1.37500 before retracing to 4H bullish FVG
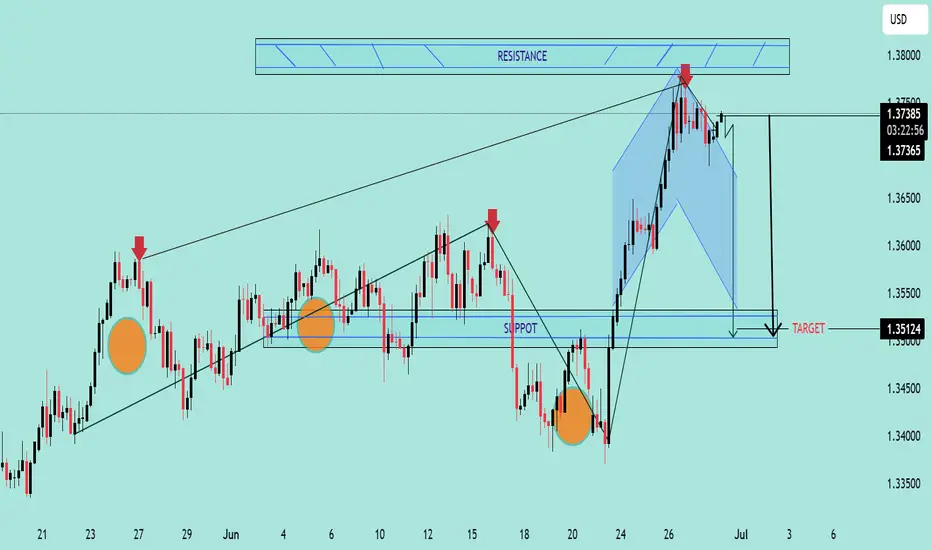
GBP/USD Bearish Reversal Pattern Detected GBP/USD Bearish Reversal Pattern Detected 🔻🦈
The chart illustrates a potential bearish Gartley pattern formation near the 1.3736 resistance zone, which has historically triggered price rejections (red arrows).
🔍 Key Observations:
📌 Price action completed a bearish harmonic pattern, suggesting a reversal setup.
💡 Multiple rejections at the upper resistance zone (1.3730–1.3780) highlight strong selling pressure.
📉 Break of trendline support confirms shift in structure.
🟠 Historical support zones (orange circles) now align with the projected target level: 1.3512.
🔽 A clean breakdown below 1.3650 could accelerate bearish momentum toward the target.
🎯 Target: 1.35124
🛑 Resistance: 1.3730–1.3780
✅ Support: 1.3510–1.3550 zone
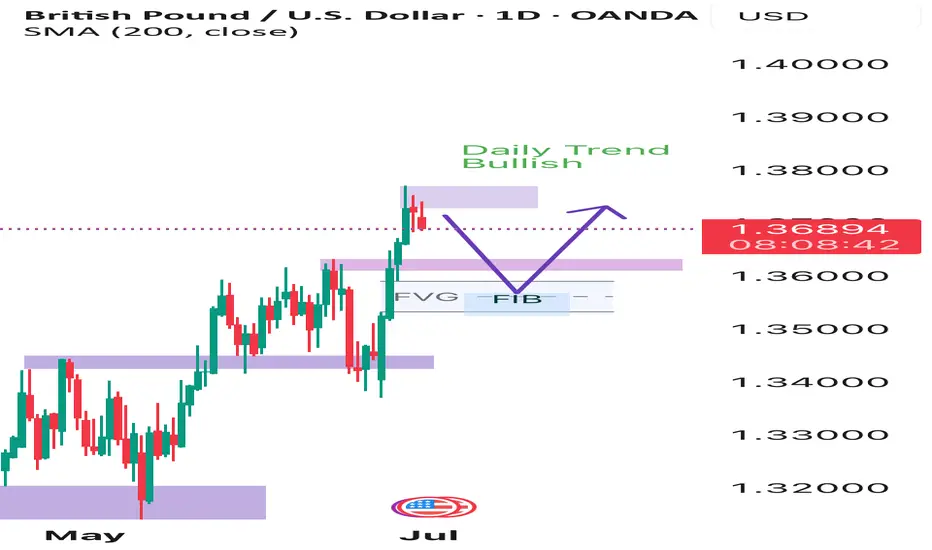
Trading Recommendation and Analysis for GBP/USDThe British pound is rising, but the accompanying Marlin oscillator is quite weak. Before the bulls are not just the desired targets - 1.3834, 1.3935, etc. - but also potential traps from which the bears could launch an unstoppable offensive.
On the daily chart, the trend remains upward, which is also confirmed by the Marlin oscillator breaking upward out of its own descending channel. However, there is also suspicion that this might be a trap - it may be a false breakout from the channel, similar to what occurred on May 12, when it was a breakout to the downside (highlighted by a yellow rectangle) .A trend reversal would occur if the price breaks below the support level at 1.3635, which is additionally reinforced by the MACD line.
On the four-hour chart, the price appears to be finishing a consolidation phase. During this consolidation, the Marlin oscillator has had time to decompress and prepare for further growth. As long as the trend remains intact the no signs of reversal appear, we expect the price to continue moving gradually upward.
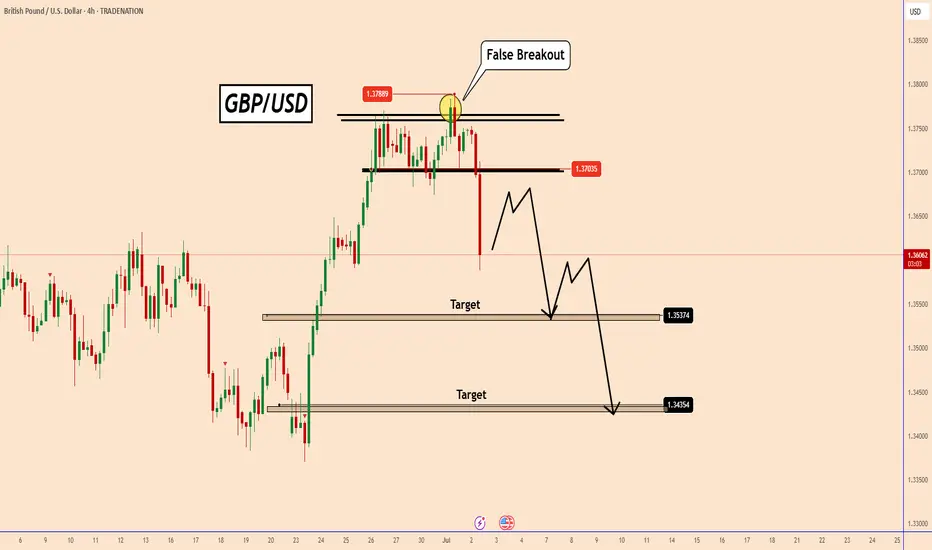
GBPUSD: Profit taking or a downward move?GBPUSD: Profit taking or a downward move?
Yesterday, GBPUSD reached a new high of 1.3788, last seen in February 2022.
From the chart it can be clearly seen that GBPUSD only created a false breakout to the upside.
Market participants expected USD to weaken, but it changed direction again and locked in many long positions.
Despite the ADP data today being a real dud from expectations of 95k to -33k, we can see that GBPUSD did not stop the decline.
I think this could be related to the FED and if they think that maybe this is the time to change Interest Rates at the July meeting. It could also be a liquidity release and it could rise again, but we cannot prove this yet with the current pattern.
Technical Analysis:
As long as the price stays below 1.3680 or below this small structure, the price could fall further.
Don't forget that tomorrow we also have NFP data and the US market will be preparing for a long weekend. The 4-hour candle is strong and bearish, so let's see.
You may find more details in the chart!
Thank you and Good Luck!
PS: Please support with a like or comment if you find this analysis useful for your trading day
Disclosure: I am part of Trade Nation's Influencer program and receive a monthly fee for using their TradingView charts in my analysis.
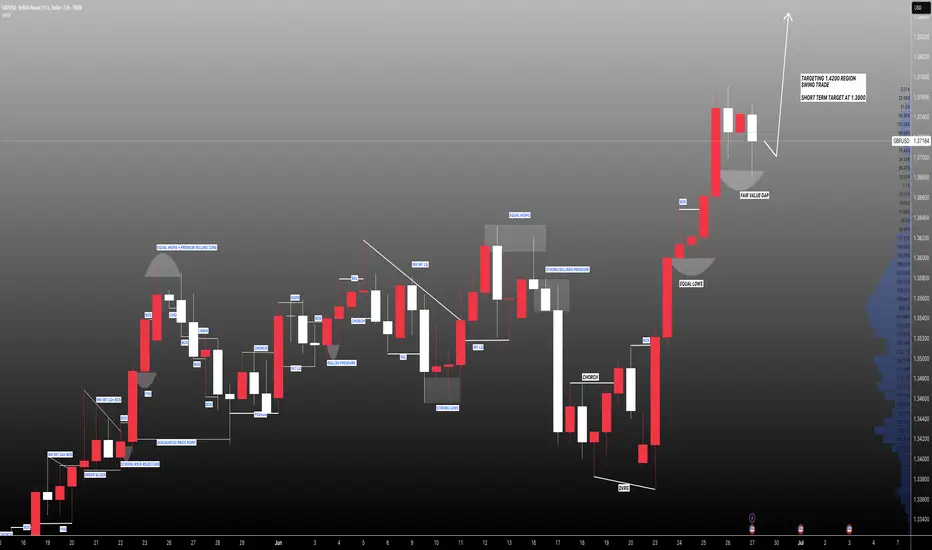
GBPUSD: Targeting 1.4200 Swing Move Target! Swing Trading GBPUSD: We’ve identified a key reversal zone where our long-term take-profit target is set at 1.4200. This is a long-term approach, but in the short term, we could target 1.3900, which is a reasonable take-profit area. Before taking any buying entry, please do your own analysis.
Good luck and trade safely!
Like
Comment
Share
Team Setupsfx_
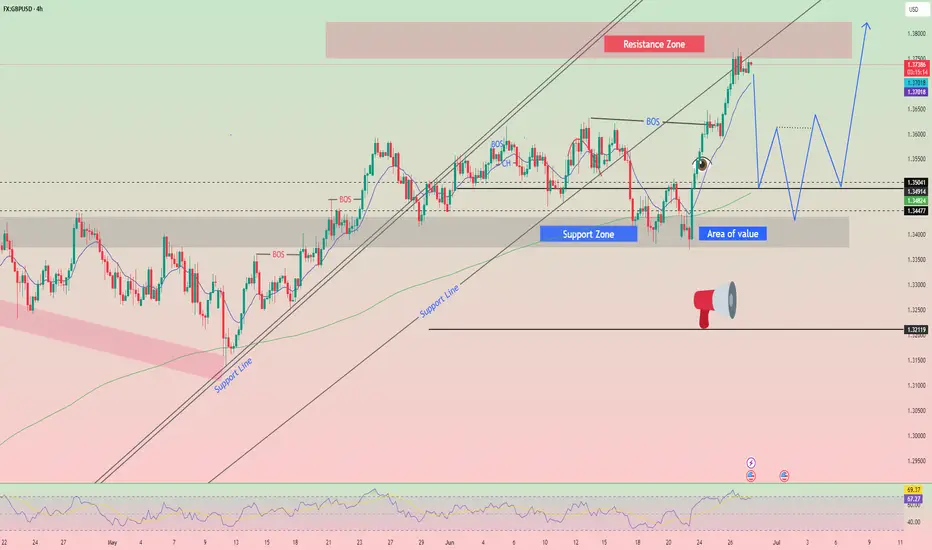
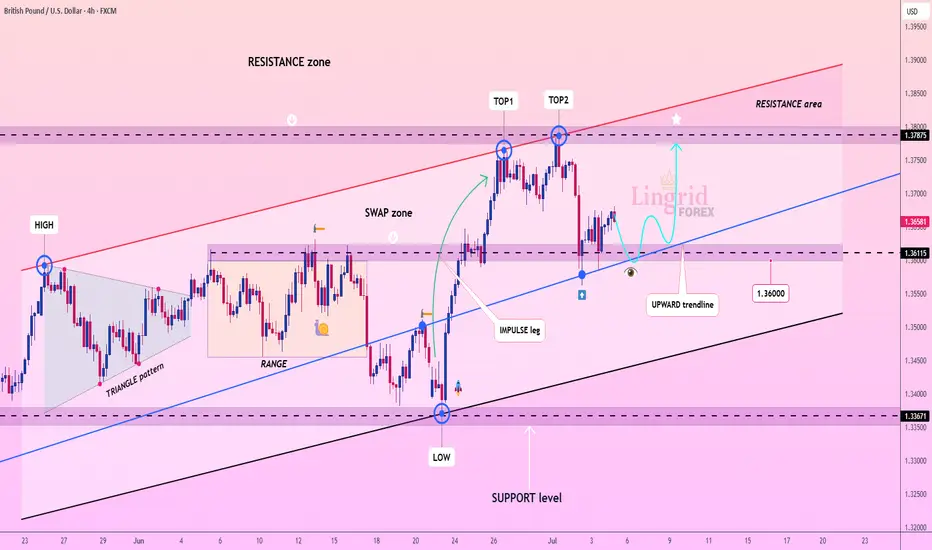
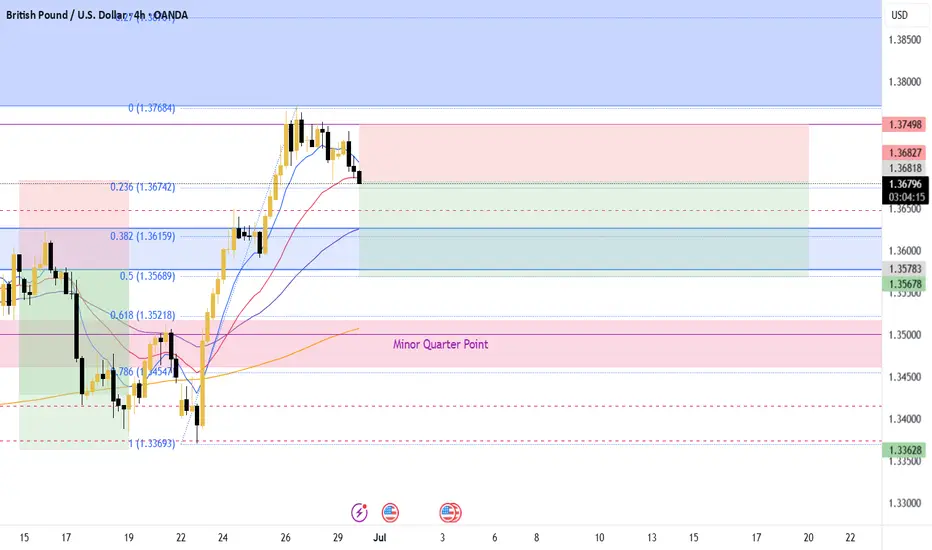
Lingrid | GBPUSD Potential Bounce at Key Psychological LevelThe price perfectly fulfilled my previous idea . FX:GBPUSD is consolidating above the upward trendline after forming a local double top near the 1.3787 resistance zone. The price is currently retesting the 1.3611–1.3660 support cluster, aligned with the trendline and previous impulse breakout area. A successful bounce from this zone could initiate another rally toward the upper boundary of the resistance range.
📈 Key Levels
Buy zone: 1.3600–1.3660 (trendline + support overlap)
Sell trigger: breakdown below 1.3600
Target: 1.3787 – resistance ceiling with prior rejection
Buy trigger: bullish reaction from 1.3611 area with strong candle close
💡 Risks
Breakdown below 1.3600 may expose deeper retracement to 1.3367
Repeated rejection at 1.3787 could form a longer-term double top
Macro data surprises could shift short-term direction suddenly
If this idea resonates with you or you have your own opinion, traders, hit the comments. I’m excited to read your thoughts!
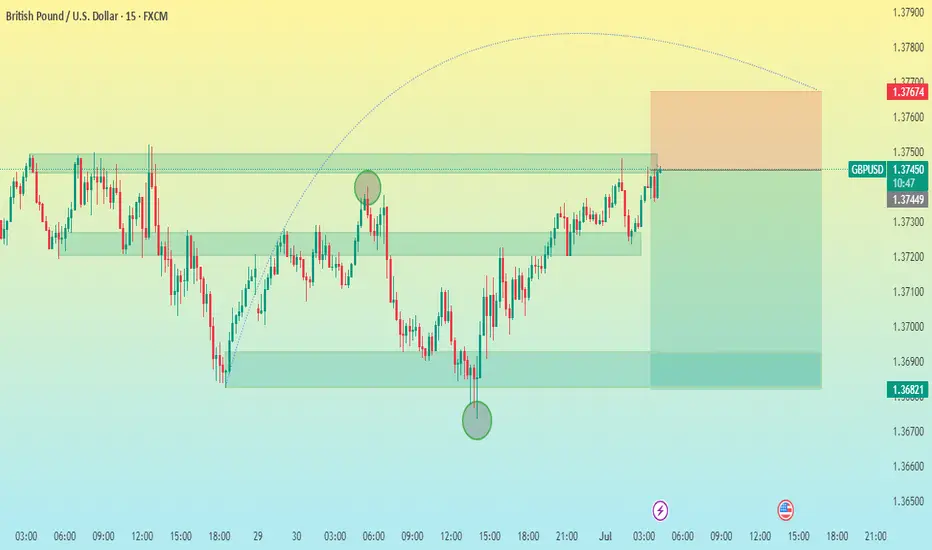
GBP/USD 15M CHART PATTERNHere's a clear summary of your GBP/USD sell trade setup:
---
Trade Type: Sell
Entry Price: 1.37440
✅ Take Profit Targets:
1. TP1: 1.37240
2. TP2: 1.37032
3. TP3: 1.36821
❌ Stop Loss:
SL: 1.37674
---
Risk-Reward Overview:
Risk (SL): 1.37674 - 1.37440 = +23.4 pips
Reward:
TP1: 1.37440 - 1.37240 = 20 pips
TP2: 1.37440 - 1.37032 = 40.8 pips
TP3: 1.37440 - 1.36821 = 61.9 pips
So the best-case reward-to-risk ratio is approximately 2.6:1.
Let me know if you’d like a risk management calculator, trailing stop plan, or chart visualization for this setup.
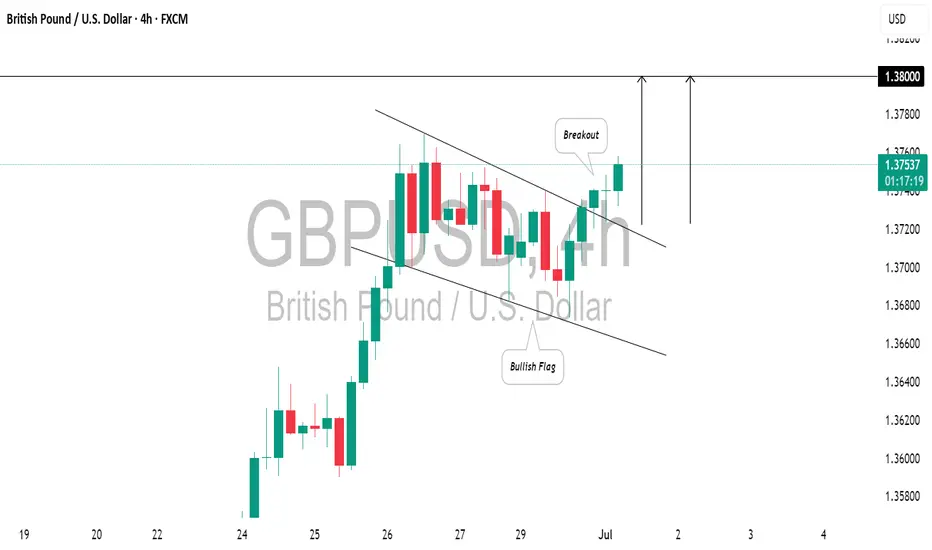
Bullish IdeaMarket forming what seems to be a bullish flag pattern, which results into an upward move. So we expect a good bullish pattern. Break out the structure and we
ready for the show now
GBPUSD is in Bearish Trend !GBPUSD in Bearish Trend Because in 1 hour Chart Pattarn Double Top Found there and in RSI Bearish Divergence also there so the Meaning is Market IS Down

GBP/USD What do people’s think about my chart 😅 waiting for hourly to match daily trend before placing a trade
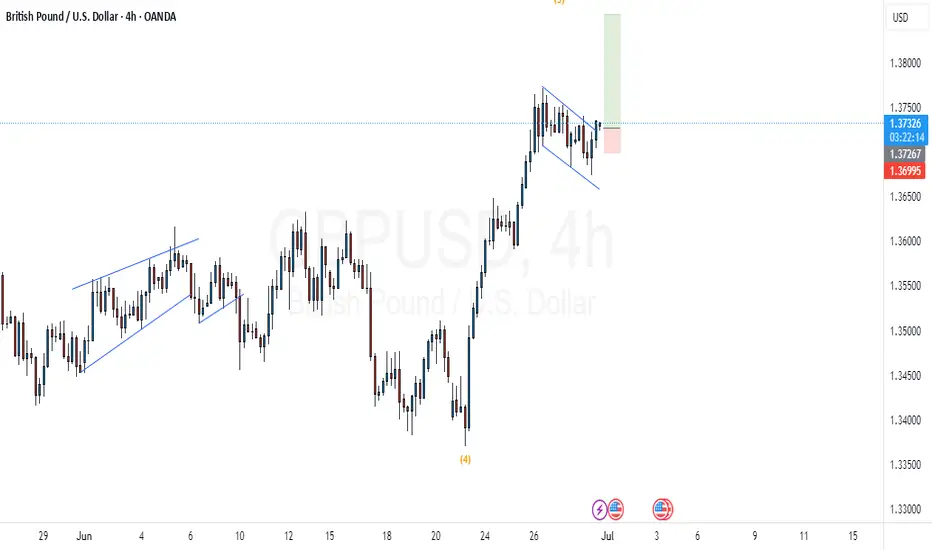
GBPUSD: Bullish Continuation Ahead.The GBPUSD has established a typical bullish trend following pattern.
Following a significant upward movement, the price entered a correction phase within a bullish flag.
Breaking above the resistance line serves as a strong indicator of continued upward momentum.
I anticipate that the pair could reach the 1.3800 level.
Smart Scalping on GBP/USD: 15-Minute Chart StrategyUnlock the power of precision trading with my exclusive GBP/USD 15-minute scalping strategy. This isn’t just another chart setup—it’s a battle-tested system built on real-time confluence: EMA crossovers, RSI confirmation, Supertrend alignment, and Fibonacci retracement zones. Every trade idea I share is backed by deep analysis, strict risk management, and a clear entry/exit plan.
Whether you're a beginner looking to learn or a trader seeking consistency, my strategy delivers clarity in the chaos of the markets. Join me to gain access to high-probability setups, live breakdowns, and mentorship that turns theory into profit.
💼 Ready to level up your trading? 💸 Invest in insights that pay for themselves. 📈 Let’s grow together—one smart trade at a time.
GBPUSD PullbackGBPUSD is in an overall bullish market
However, after a large bullish push, I am expecting price to pullback (sell off).
Price met resistance a weekly supply zone and closed as an indecision candle on the Daily.
The lower blue EMA crossed below the higher RED EMA on the 1hr chart.
Expecting price to selloff and find support at the 50.0 Fib level which also correlates with a demand zone, before continuing the overall trend.
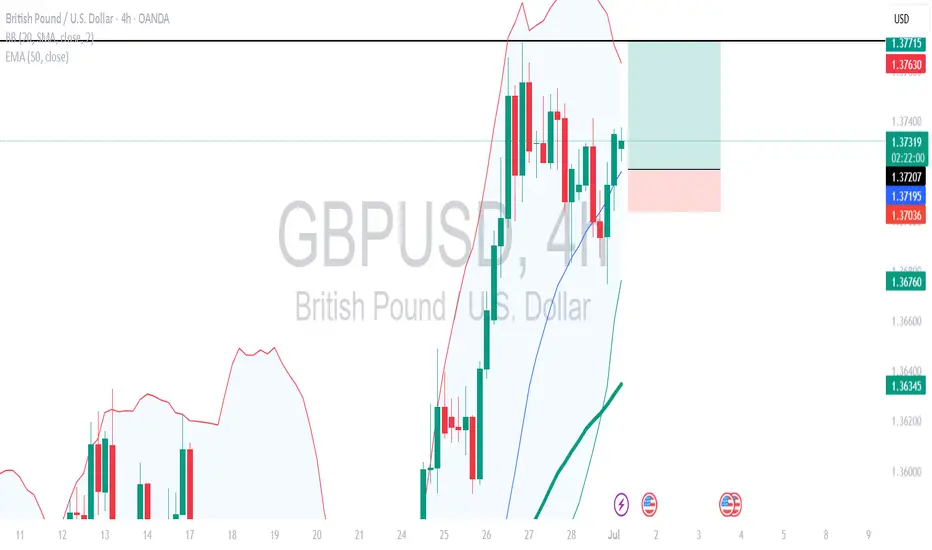
GBPUSD buyer in controlDaily candle closed with strong bullish.
Expecting a healthy retracement before another bullish movement
Good Luck
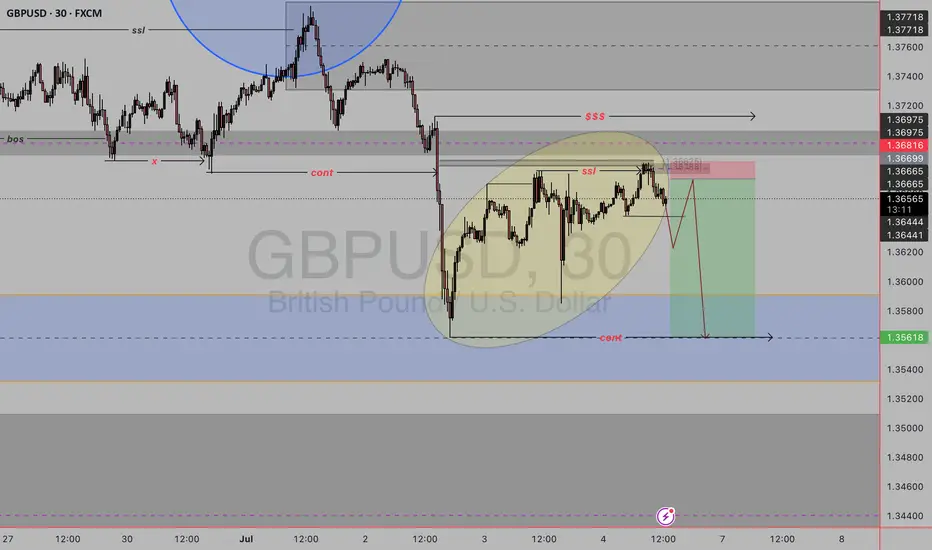
sell gbpusdAs noted there we are in a downtrend as price is breaking lows and forming lower lows but looking at weekly we are currently bullish having a retracement meaning this is a counter trend following the retracement no high has been broken to continue the trend and i see ssl liquidity swept on ltf waiting for trans and reteracement to my liquidity area to take sells but if no tr no trade
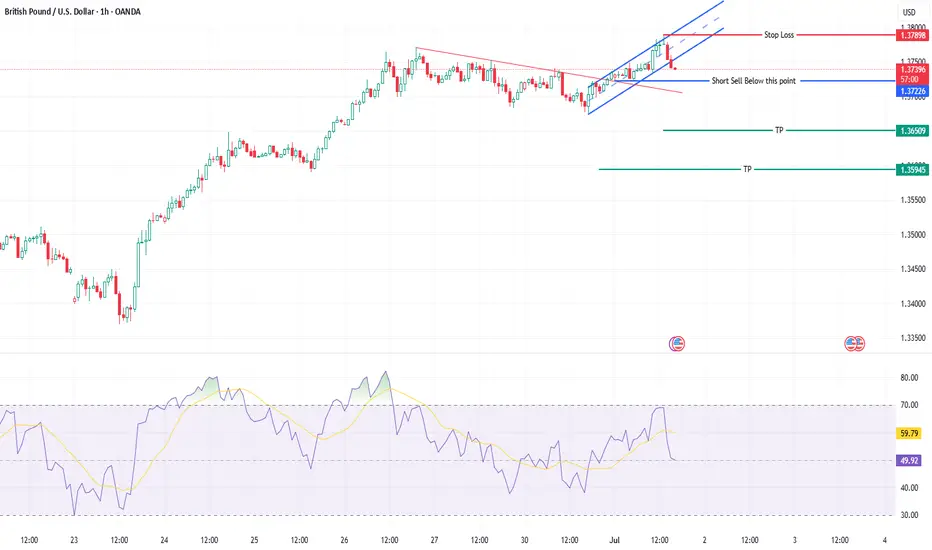
GBPUSD opportunity to go SHORTThe pair has been showing weakness for some time through RSI divergence.
On hourly chart it printed the indecision candle followed by two red candles. This gives us the cue for bearish momentum.
Since we need multiple reasons to short sell so we identify the recent low and if the price goes lower than this than we initiate a short trade.
For ready reference the TPs have been marked on chart.
wishing you a PROFIT-able trading.
#GBPUSD: Bulls are in control, DXY Dropping Sharply!Hello Team,
We have identified a promising opportunity with a favourable price movement. The Pound Sterling to US Dollar (GBPUSD) pair has exhibited strong bullish volume, indicating potential further appreciation.
The current geopolitical tensions, particularly the involvement of the United States in the Iran-Israel conflict, are expected to negatively impact the US Dollar. This decline could potentially lead to an appreciation of the GBPUSD pair and other USD-denominated currencies.
It is advisable to closely monitor the price behaviour of the GBPUSD pair and consider potential investment opportunities based on its current trend.
Best regards,
Team Setupsfx
GBPUSD Will Go Lower! Sell!
Take a look at our analysis for GBPUSD.
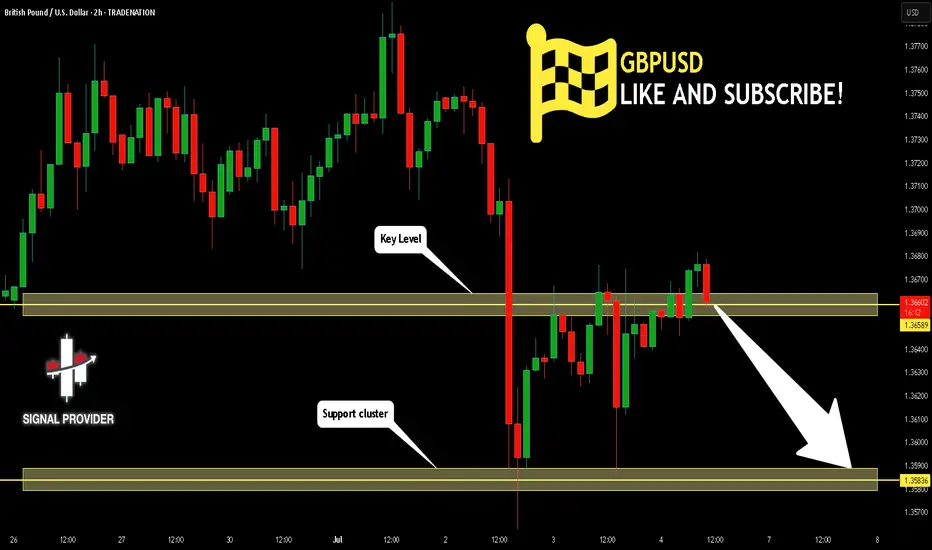
Time Frame: 2h
Current Trend: Bearish
Sentiment: Overbought (based on 7-period RSI)
Forecast: Bearish
The market is testing a major horizontal structure 1.365.
Taking into consideration the structure & trend analysis, I believe that the market will reach 1.358 level soon.
P.S
Overbought describes a period of time where there has been a significant and consistent upward move in price over a period of time without much pullback.
Disclosure: I am part of Trade Nation's Influencer program and receive a monthly fee for using their TradingView charts in my analysis.
Like and subscribe and comment my ideas if you enjoy them!
GBPUSD Will Move Lower! Short!
Please, check our technical outlook for GBPUSD.
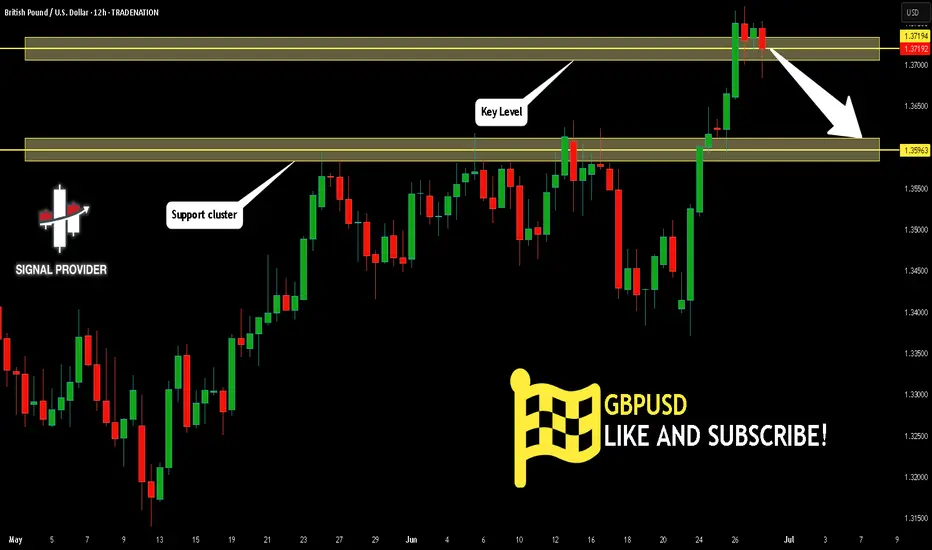
Time Frame: 12h
Current Trend: Bearish
Sentiment: Overbought (based on 7-period RSI)
Forecast: Bearish
The market is approaching a key horizontal level 1.371.
Considering the today's price action, probabilities will be high to see a movement to 1.359.
P.S
We determine oversold/overbought condition with RSI indicator.
When it drops below 30 - the market is considered to be oversold.
When it bounces above 70 - the market is considered to be overbought.
Disclosure: I am part of Trade Nation's Influencer program and receive a monthly fee for using their TradingView charts in my analysis.
Like and subscribe and comment my ideas if you enjoy them!
GBPUSD sweep of lowGBPUSD sweep of low reclaim of low and respecting liquidity aree take to weekly high cautiously after that short of lifetime