Looking ahead, several important economic events could impact the GBPUSD market. Key USD news to watch includes:
Non-Farm Payrolls (NFP): Scheduled for July 7, 2025, this report will provide insights into the U.S. job market and could significantly influence the USD's strength. A strong NFP report typically supports the USD, potentially leading to downward pressure on GBPUSD. 📉
Consumer Price Index (CPI): Set for July 12, 2025, this inflation report will be crucial for understanding consumer spending trends. Higher inflation could prompt the Federal Reserve to adjust interest rates, impacting the USD and subsequently the GBPUSD pair. 📈
FOMC Meeting Minutes: Scheduled for July 13, 2025, the release of these minutes will provide insights into the Federal Reserve's monetary policy outlook, which can affect market sentiment and the USD's value.
These upcoming events are vital for traders to consider, as they can lead to increased volatility and potential trading opportunities in the GBPUSD market.
Conclusion 📝
In summary, the GBPUSD is currently positioned within a bullish trend, supported by key indicators such as Fibonacci levels, EMAs, and MACD. However, traders should remain cautious of potential reversals indicated by RSI divergence and monitor critical support and resistance levels. With upcoming USD news events on the horizon, maintaining awareness of fundamental factors will be essential for making informed trading decisions. By integrating both technical and fundamental analyses, traders can enhance their strategies and navigate the GBPUSD market effectively.
As of the latest market data, the GBPUSD is trading at 1.36434 USD. This analysis aims to provide a detailed examination of the current market conditions using various technical indicators across daily and 4-hour time frames. Key indicators such as Fibonacci Retracement Levels, Exponential Moving Averages (EMA), RSI divergence, support and resistance levels, order blocks, and MACD will be analyzed to offer insights into potential price movements.
Current Market Analysis 🔍
Support and Resistance Levels
Daily Time Frame:
Support Levels:
1.35630: This level marks a significant swing low and acts as a crucial support zone. 1.36000: A psychological level that traders often watch for potential reversals.
Resistance Levels:
1.36326: This swing high has proven to be a critical resistance point. 1.37000: Another psychological resistance level that may attract sellers.
4-Hour Time Frame:
Support Levels:
1.36050: A minor support level that has held in recent trading sessions. 1.36200: A key level where buying interest may emerge.
Resistance Levels:
1.36500: A notable resistance level where price action has reversed in the past. 1.36800: A higher resistance level that traders should monitor.
Fibonacci Retracement Levels 📏
Using the Fibonacci Retracement tool on the recent swing high of 1.36326 and swing low of 1.35630, the key levels are as follows:
These levels can act as potential reversal points, with the 61.8% retracement being particularly significant for traders looking for entries on pullbacks.
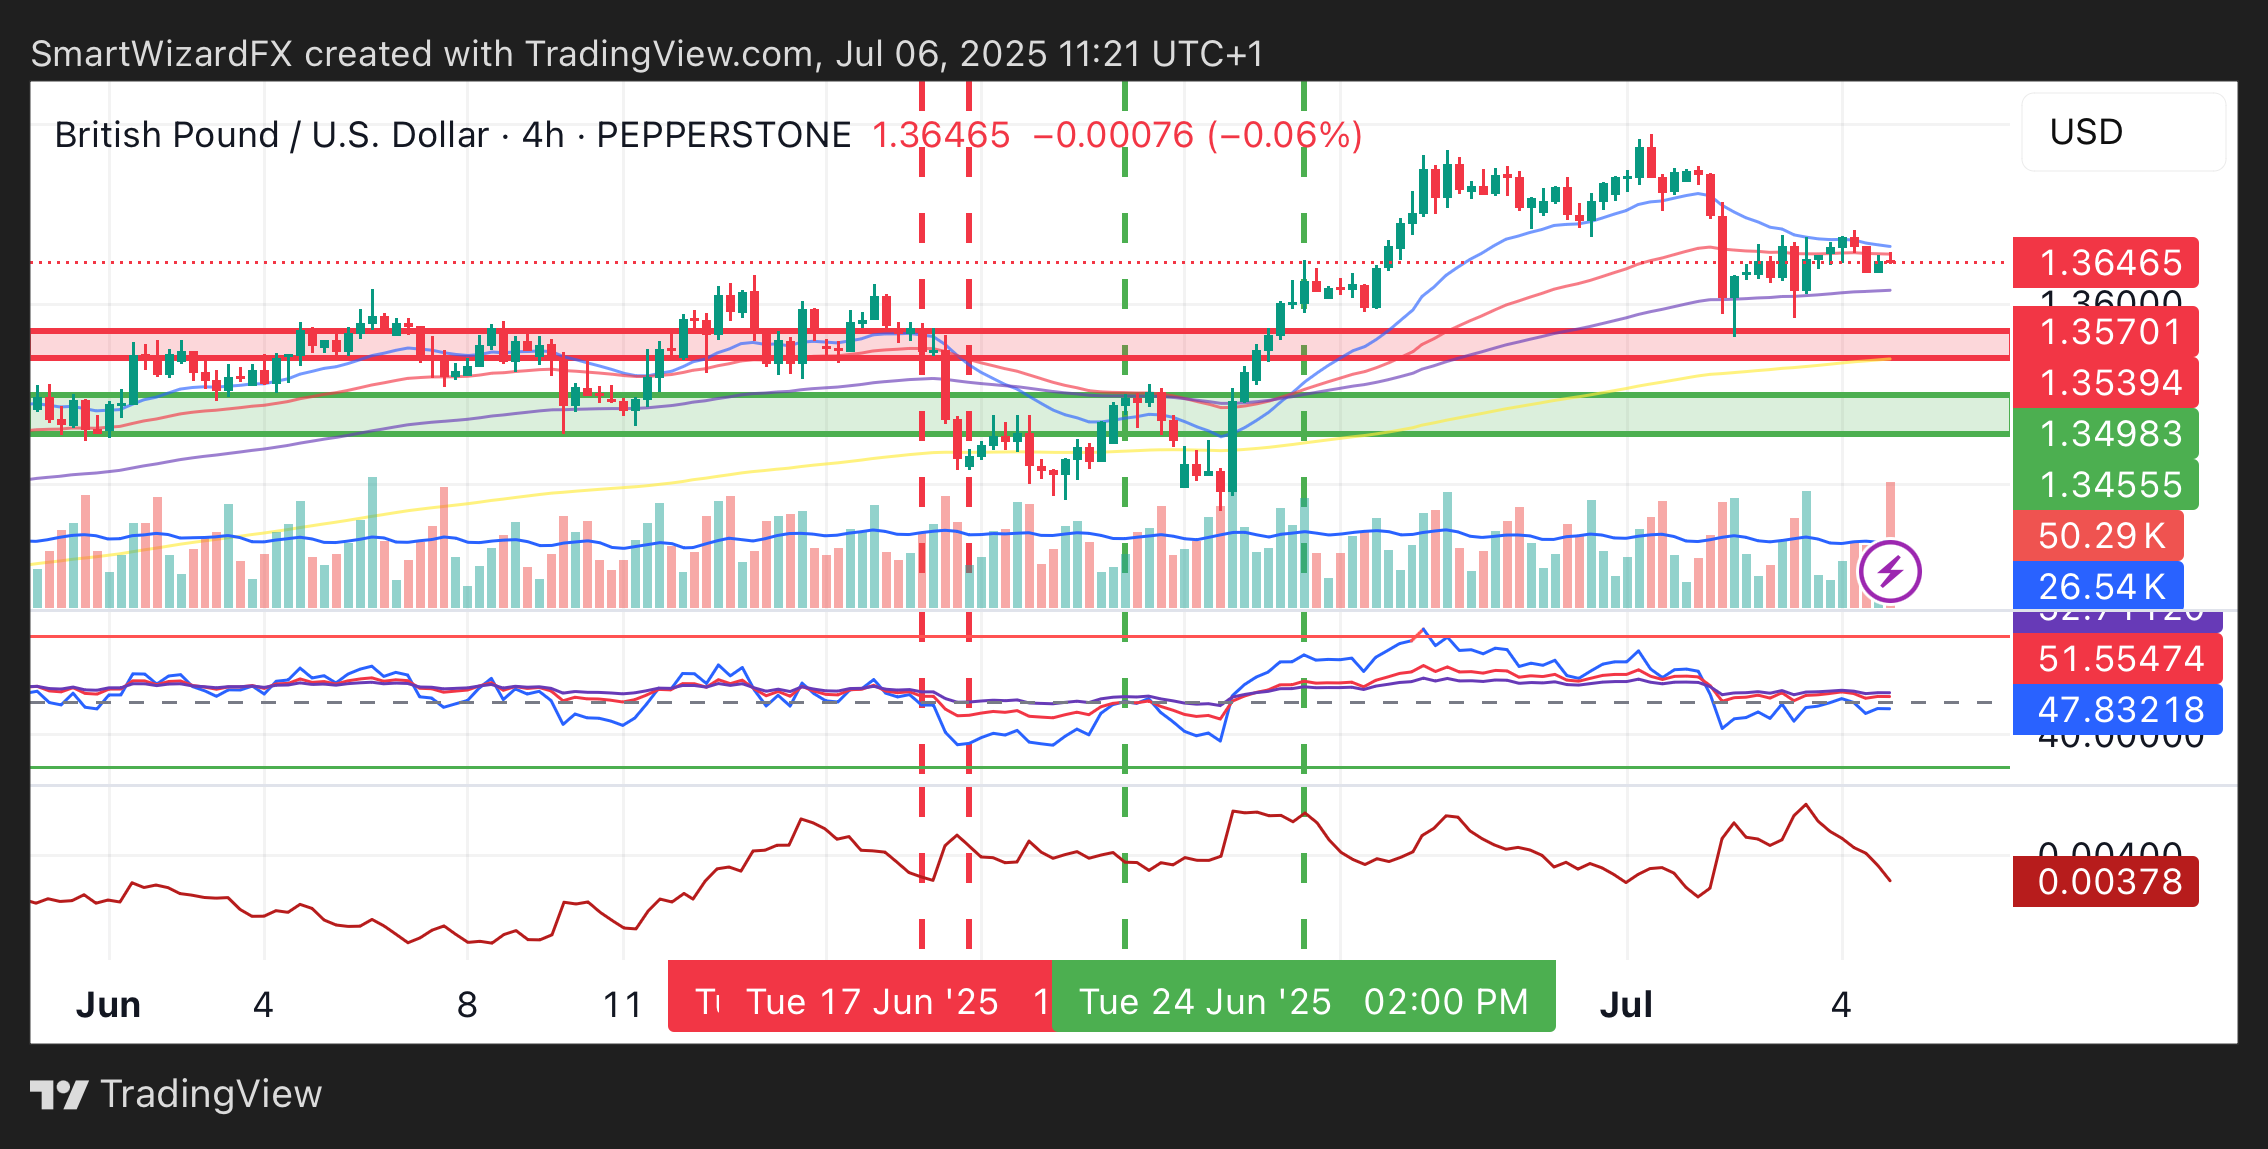
Exponential Moving Averages (EMA) 📈
Daily Time Frame:
EMA 50: 1.36100 EMA 100: 1.36250 EMA 200: 1.36400 EMA 400: 1.36550
The EMA levels indicate that the price is currently trading above the shorter-term EMAs (50 and 100), suggesting a bullish trend in the short to medium term.
4-Hour Time Frame:
EMA 50: 1.36220 EMA 100: 1.36300 EMA 200: 1.36380 EMA 400: 1.36450
On the 4-hour chart, the price is also above the 50 EMA, indicating continued bullish momentum. However, the proximity of the price to the EMA levels suggests that traders should remain cautious of potential pullbacks.
RSI Divergence 📉
The Relative Strength Index (RSI) is currently showing signs of divergence. While the price has reached new highs, the RSI has not confirmed this movement, indicating a potential weakening of momentum. This divergence suggests that traders should be vigilant for possible reversals or corrections, especially near the identified resistance levels.
Order Blocks 📦
Order blocks are areas where significant buying or selling has occurred, creating potential support or resistance zones. In the current market, the most notable order block is located near 1.36000, where buying interest has been strong. Traders should monitor this area for potential reversals or continuations.
MACD Analysis 📊
The Moving Average Convergence Divergence (MACD) indicator is currently in a bullish phase, with the MACD line above the signal line. This alignment suggests that the bullish momentum may continue in the short term. However, traders should watch for any signs of convergence that could indicate a weakening trend.

 GBPUSD