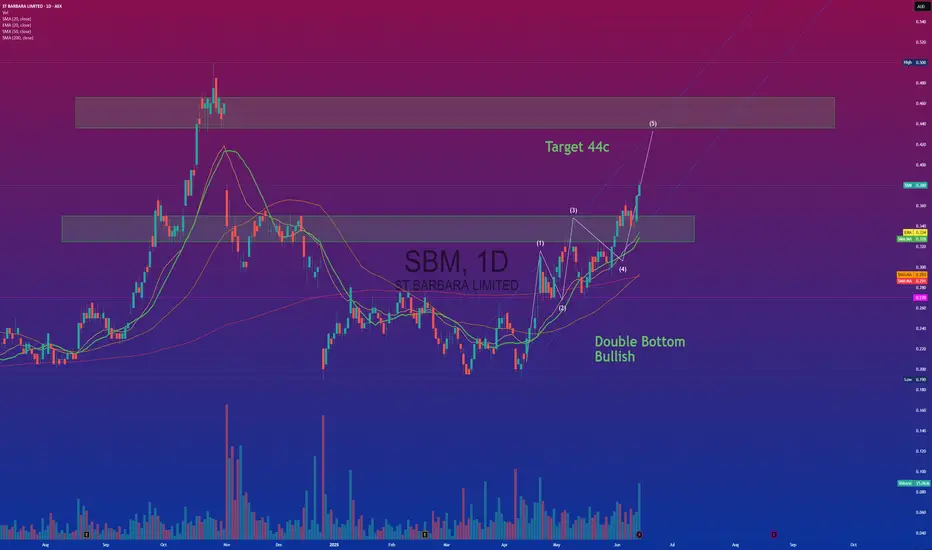
SBM Bullish to fill the gapTechnical Commentary – SBM (St Barbara Limited)
SBM has formed a textbook double bottom pattern, confirming a bullish reversal from prior downtrend conditions. The price action has since broken above neckline resistance and is now trending within a well-defined rising channel, supported by increasin
Next report date
—
Report period
—
EPS estimate
—
Revenue estimate
—
−0.04 EUR
−33.55 M EUR
139.16 M EUR
1.05 B
About ST BARBARA LIMITED
Sector
Industry
CEO
Andrew Strelein
Website
Headquarters
Perth
Founded
1969
ISIN
AU000000SBM8
FIGI
BBG000DJ64M4
St. Barbara Ltd. engages in the development and exploration of gold and mineral properties. It operates through the Simberi and Atlantic geographical segments. The company was founded on May 15, 1969 and is headquartered in Perth, Australia.
Related stocks
$SBM Bullish after forming a double bottomExpect to see SBM move into the Box after making a bullish double bottom. Gold is also bullish at 3300 USD.

short term trade for SBMSBM sitting at bottom of the cycle.
It had a massive run in the past decade
but has fallen back. Sentiment is low
and i Feel all the sellers have been exhausted. Everyone who wants out
of SBM is out so expect a short term bounce.
Gold price making new highs will help.
technically this setup looks
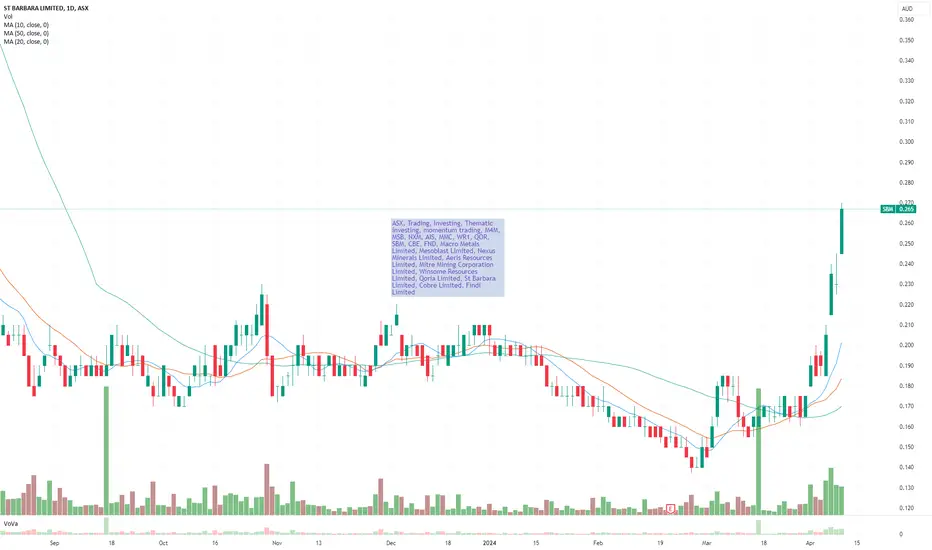
Finer Market Points: ASX Top 10 Momentum Stocks: 10 Apr 2024GETTEX:M4M NYSE:MSB ASX:NXM ASX:AIS NYSE:MMC ASX:WR1 ASX:QOR CSEMA:SBM GETTEX:CBE NYSE:FND
Momentum leading shares are the market's best performers today. They are the fastest-growing shares on the ASX over the last 90 days. These companies can't get to be leaders without first a
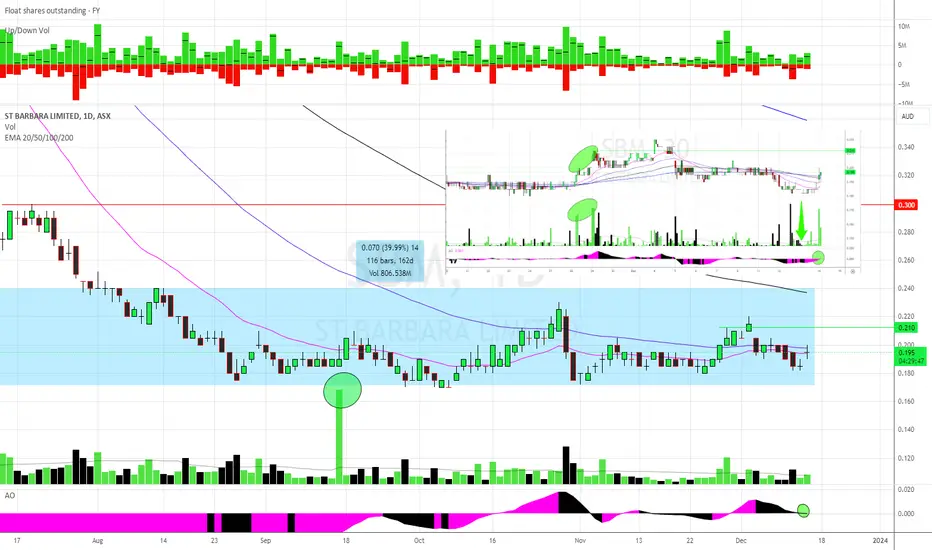
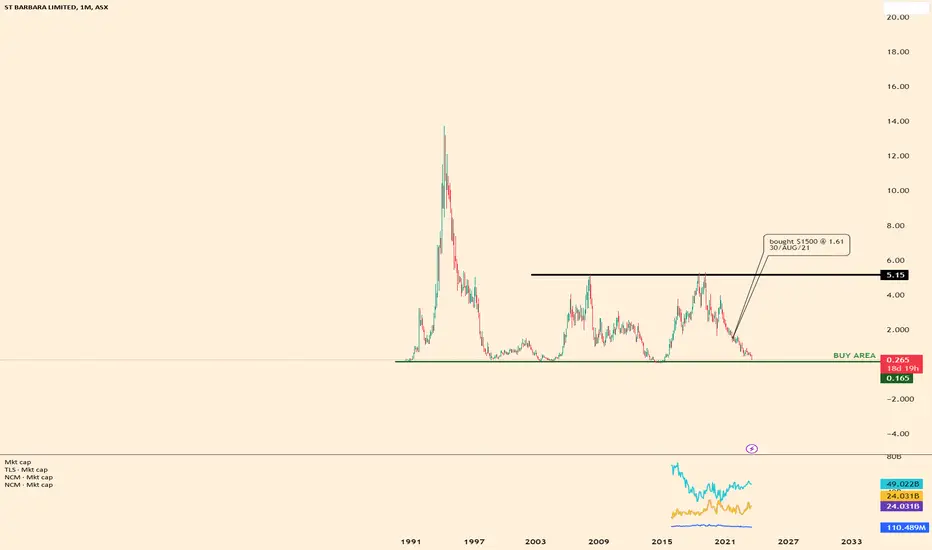
$SBM 0.190 GOLD MC $145m cash at hand $236MHow this has stayed down for so long is pretty impressive, big boys play HARD
Cash balance of $236 million as at 30 September 2023 (0.30 ps)
Sure theyve had/got issues BUT they got cash money too
770m SOI
Aside from the funnymentals
Chart looks ready for a leg up with target at 30, nice lil gai
SBM - ASX Gold MinerPrice resting on macro swing low.
RSI at lows of 30
Long towards $1 = TP
$5 macro target.
Gold ATH in AUD

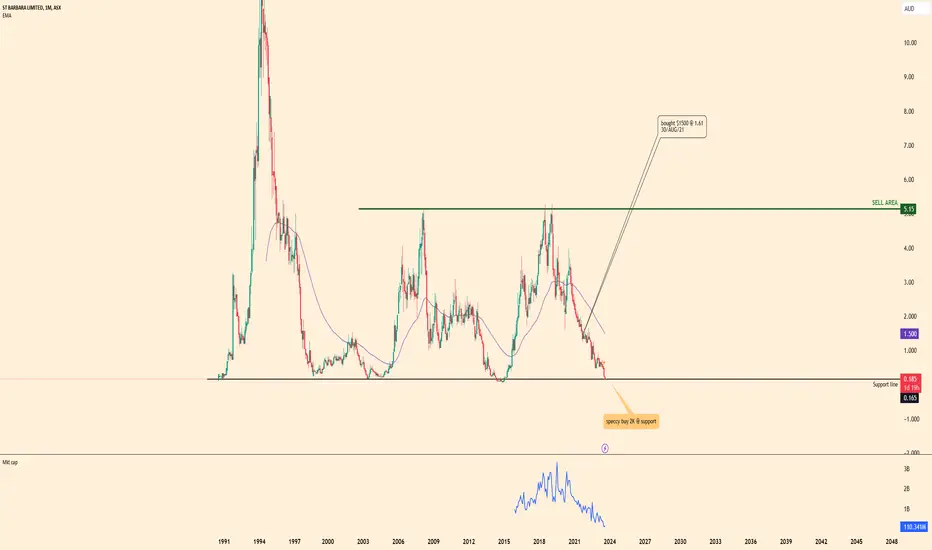
buy SBM @ the lower boundSBM looks bad. sentiment is bad.
price is bad. buy the support level which is close.
10-20 cents is a good buying area. speculate on this on
and hope it doesnt end up like BDR, TRY or X64.
we need the gold price to move higher to lift
all these gold miners. when the price of gold rockets
higher

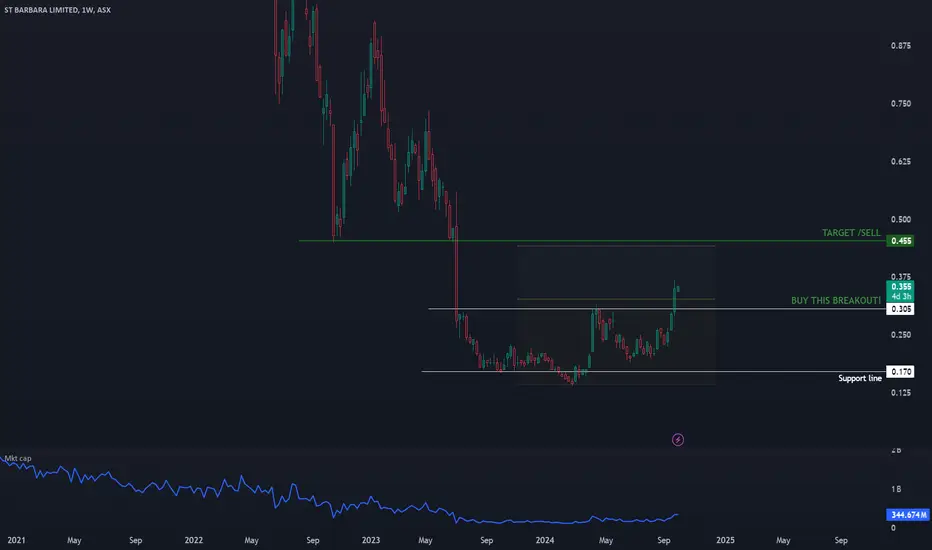
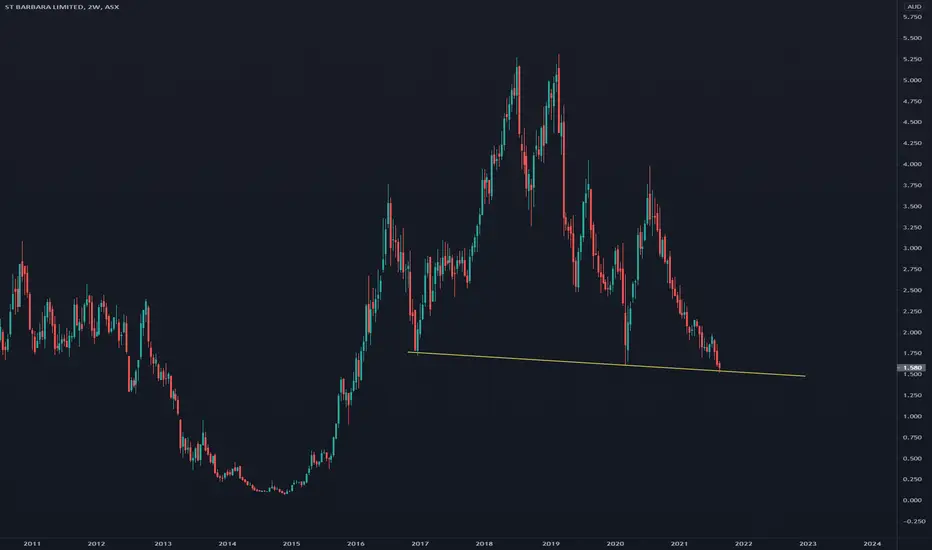
SBM price @ supportthe 2 week chart shows
price @ long term support level.
see the yellow trend line.
expect some strong buying to coming into SBM
in the coming weeks.
i will take a punt and buy a small parcel
of SBM
See all ideas
Summarizing what the indicators are suggesting.
Neutral
SellBuy
Strong sellStrong buy
Strong sellSellNeutralBuyStrong buy
Neutral
SellBuy
Strong sellStrong buy
Strong sellSellNeutralBuyStrong buy
Neutral
SellBuy
Strong sellStrong buy
Strong sellSellNeutralBuyStrong buy
An aggregate view of professional's ratings.
Neutral
SellBuy
Strong sellStrong buy
Strong sellSellNeutralBuyStrong buy
Neutral
SellBuy
Strong sellStrong buy
Strong sellSellNeutralBuyStrong buy
Neutral
SellBuy
Strong sellStrong buy
Strong sellSellNeutralBuyStrong buy
Displays a symbol's price movements over previous years to identify recurring trends.
Frequently Asked Questions
The current price of BM1 is 0.17 EUR — it has increased by 0.63% in the past 24 hours. Watch ST BARBARA LTD stock price performance more closely on the chart.
Depending on the exchange, the stock ticker may vary. For instance, on GETTEX exchange ST BARBARA LTD stocks are traded under the ticker BM1.
BM1 stock has risen by 5.02% compared to the previous week, the month change is a −8.57% fall, over the last year ST BARBARA LTD has showed a 14.50% increase.
We've gathered analysts' opinions on ST BARBARA LTD future price: according to them, BM1 price has a max estimate of 0.79 EUR and a min estimate of 0.15 EUR. Watch BM1 chart and read a more detailed ST BARBARA LTD stock forecast: see what analysts think of ST BARBARA LTD and suggest that you do with its stocks.
BM1 stock is 6.99% volatile and has beta coefficient of 1.41. Track ST BARBARA LTD stock price on the chart and check out the list of the most volatile stocks — is ST BARBARA LTD there?
Today ST BARBARA LTD has the market capitalization of 175.86 M, it has decreased by −2.37% over the last week.
Yes, you can track ST BARBARA LTD financials in yearly and quarterly reports right on TradingView.
ST BARBARA LTD is going to release the next earnings report on Aug 21, 2025. Keep track of upcoming events with our Earnings Calendar.
BM1 net income for the last half-year is −29.00 M EUR, while the previous report showed −7.00 M EUR of net income which accounts for −314.25% change. Track more ST BARBARA LTD financial stats to get the full picture.
EBITDA measures a company's operating performance, its growth signifies an improvement in the efficiency of a company. ST BARBARA LTD EBITDA is −34.75 M EUR, and current EBITDA margin is −20.52%. See more stats in ST BARBARA LTD financial statements.
Like other stocks, BM1 shares are traded on stock exchanges, e.g. Nasdaq, Nyse, Euronext, and the easiest way to buy them is through an online stock broker. To do this, you need to open an account and follow a broker's procedures, then start trading. You can trade ST BARBARA LTD stock right from TradingView charts — choose your broker and connect to your account.
Investing in stocks requires a comprehensive research: you should carefully study all the available data, e.g. company's financials, related news, and its technical analysis. So ST BARBARA LTD technincal analysis shows the buy rating today, and its 1 week rating is buy. Since market conditions are prone to changes, it's worth looking a bit further into the future — according to the 1 month rating ST BARBARA LTD stock shows the sell signal. See more of ST BARBARA LTD technicals for a more comprehensive analysis.
If you're still not sure, try looking for inspiration in our curated watchlists.
If you're still not sure, try looking for inspiration in our curated watchlists.