CX | Long | Triangle Breakout & Value Entry | (May 2025)CX | Long | Watching for Triangle Breakout & Value Entry | (May 2025)
1️⃣ Short Insight Summary:
CX has been stuck in a long-term consolidation pattern since 2008, but now it’s approaching a key decision point. We’re seeing signs of potential breakout movement, especially as price compresses within
Next report date
—
Report period
—
EPS estimate
—
Revenue estimate
—
0.08 EUR
760.94 M EUR
13.76 B EUR
15.11 B
About CEMEX S.A.B. DE C.V.
Sector
Industry
CEO
Jaime Muguiro Dominguez
Website
Headquarters
San Pedro Garza García
Founded
1906
ISIN
MXP225611567
FIGI
BBG000C37PQ8
CEMEX SAB de CV operates as a global construction materials company. It offers cement, ready-mixconcrete, aggregates, and urbanization solutions. The firm operates through the following geographical segments: Mexico, United States, Europe, Middle East, Africa and Asia (EMEAA) and South, Central America and the Caribbean (SCA&C). The company was founded by Lorenzo Zambrano Gutierrez in 1906 and is headquartered in San Pedro Garza Garcia, Mexico.
Related stocks

CEMEX/CPO - Buying OpportunityCEMEX/CPO - Buying Opportunity.
TF analysis: 4H.
According to technical analysis, we can observe that we are in an uptrend channel, in which the price is gaining greater inclination by making higher lows. The projection of the possible upward movement is located up to the upper end of the channel.
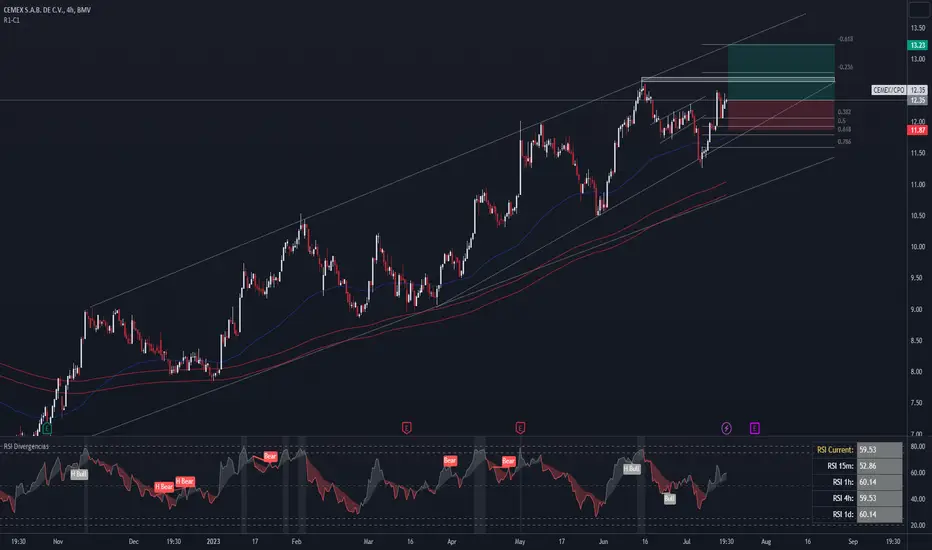
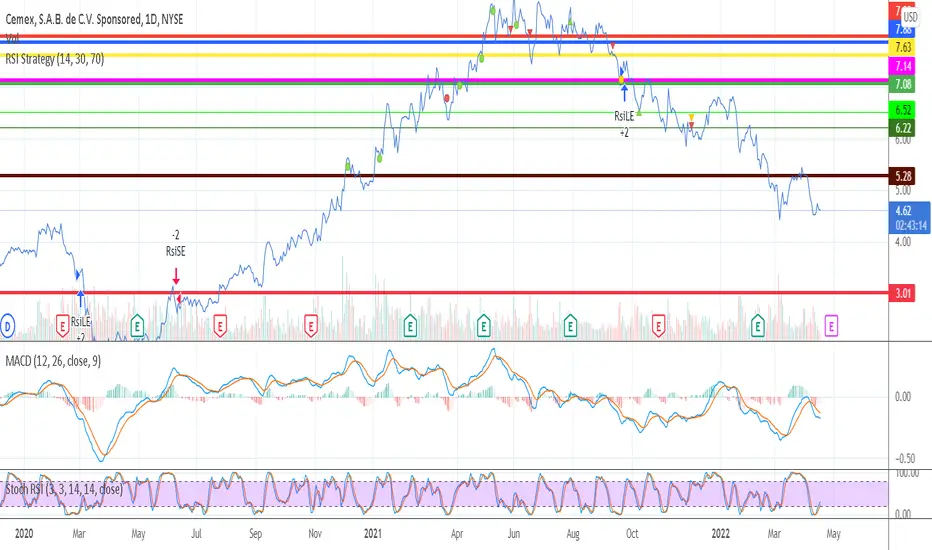
The new trend is hereCemex broke the downtrend line that began in June 2021 and has already made 2 higher lows. Interesting risk reward ratio to take into account.
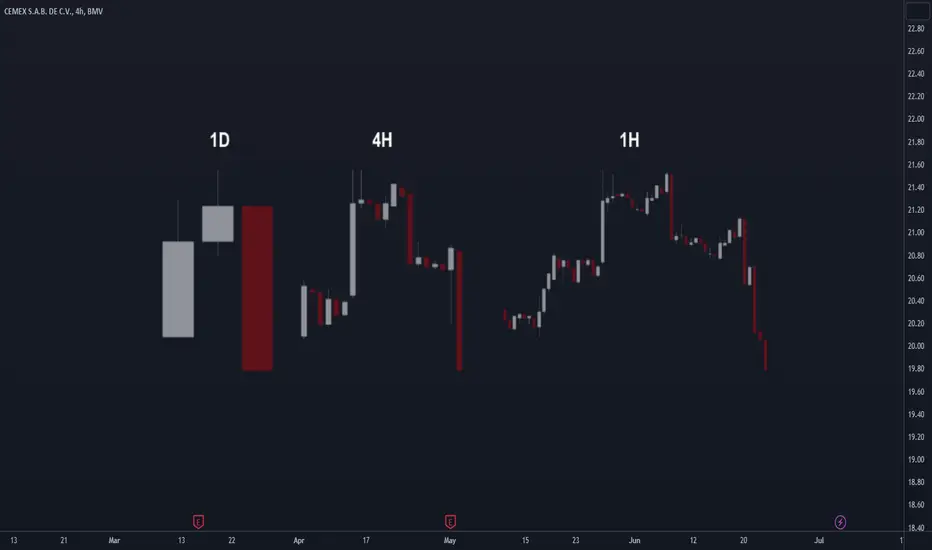
The importance of using different TimeframesWhen visualizing the market and conducting technical analysis, it is crucial to interpret different timeframes.
Multi-timeframe analysis can enhance the probability of success in our trading by utilizing support and resistance levels from higher timeframes than our base timeframe.
It is also usefu
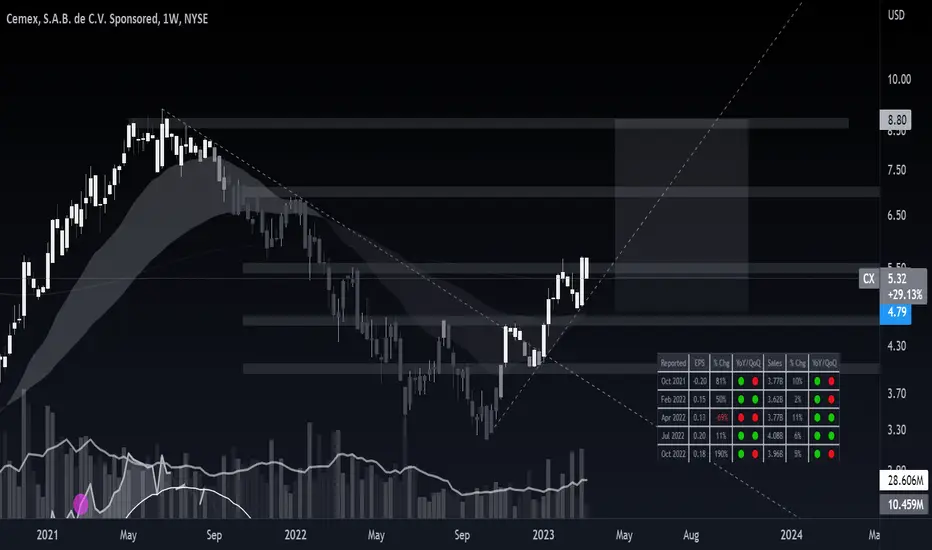
CX to buy We have good price to buy with high risk . CX could go down 4. 3.5 again or it could start between 4.50 to 4, 4.40, 4.30 for one month
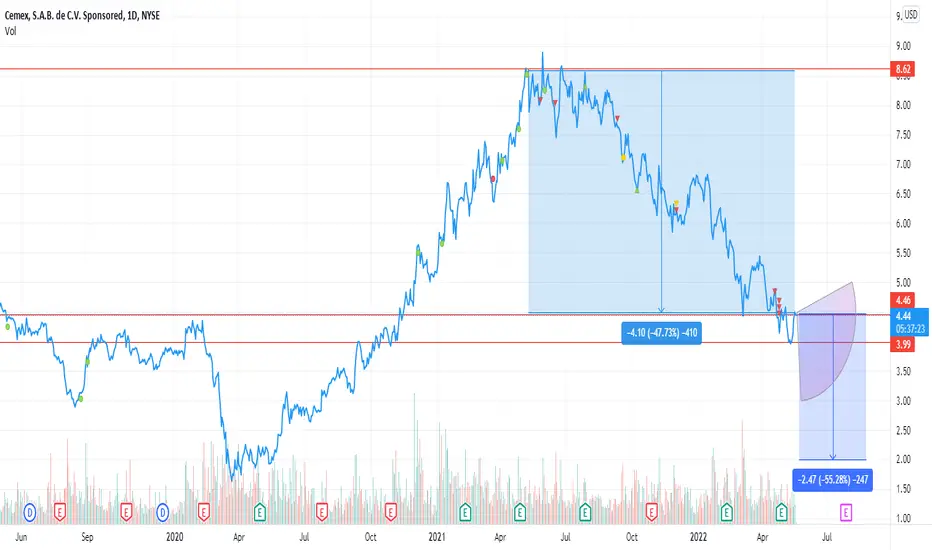


CX will go down to $ 3.00in the last 2 cycles during the last year. every time we lost $2.40 from the peak. Today the peak is 5.44 so the next price $3.04, I think CX is going to start buying back in the price of 2.60 to $ 3.00

See all ideas
Summarizing what the indicators are suggesting.
Neutral
SellBuy
Strong sellStrong buy
Strong sellSellNeutralBuyStrong buy
Neutral
SellBuy
Strong sellStrong buy
Strong sellSellNeutralBuyStrong buy
Neutral
SellBuy
Strong sellStrong buy
Strong sellSellNeutralBuyStrong buy
An aggregate view of professional's ratings.
Neutral
SellBuy
Strong sellStrong buy
Strong sellSellNeutralBuyStrong buy
Neutral
SellBuy
Strong sellStrong buy
Strong sellSellNeutralBuyStrong buy
Neutral
SellBuy
Strong sellStrong buy
Strong sellSellNeutralBuyStrong buy
CX5108068
CEMEX, S.A.B. de C.V. 3.875% 11-JUL-2031Yield to maturity
5.63%
Maturity date
Jul 11, 2031
CX4911672
CEMEX, S.A.B. de C.V. 5.45% 19-NOV-2029Yield to maturity
5.39%
Maturity date
Nov 19, 2029
CX5045771
CEMEX, S.A.B. de C.V. 5.2% 17-SEP-2030Yield to maturity
5.35%
Maturity date
Sep 17, 2030
CEXM
CEMEX S.A.B. 19/26 REGSYield to maturity
4.42%
Maturity date
Mar 19, 2026
CX5197272
CEMEX, S.A.B. de C.V. 5.125% PERPYield to maturity
—
Maturity date
—
USP2253TJW0
CEMEX S.A.B. 25/UND. FLRYield to maturity
—
Maturity date
—
See all CEXB bonds
Frequently Asked Questions
The current price of CEXB is 0.65 EUR — it hasn't changed in the past 24 hours. Watch CEMEX SAB DE CV stock price performance more closely on the chart.
Depending on the exchange, the stock ticker may vary. For instance, on GETTEX exchange CEMEX SAB DE CV stocks are traded under the ticker CEXB.
CEXB stock has risen by 7.28% compared to the previous week, the month change is a 14.40% rise, over the last year CEMEX SAB DE CV has showed a 22.64% increase.
We've gathered analysts' opinions on CEMEX SAB DE CV future price: according to them, CEXB price has a max estimate of 1.08 EUR and a min estimate of 0.46 EUR. Watch CEXB chart and read a more detailed CEMEX SAB DE CV stock forecast: see what analysts think of CEMEX SAB DE CV and suggest that you do with its stocks.
CEXB reached its all-time high on Jul 14, 2025 with the price of 0.66 EUR, and its all-time low was 0.42 EUR and was reached on Apr 11, 2025. View more price dynamics on CEXB chart.
See other stocks reaching their highest and lowest prices.
See other stocks reaching their highest and lowest prices.
CEXB stock is 0.00% volatile and has beta coefficient of 1.50. Track CEMEX SAB DE CV stock price on the chart and check out the list of the most volatile stocks — is CEMEX SAB DE CV there?
Today CEMEX SAB DE CV has the market capitalization of 9.87 B, it has increased by 6.03% over the last week.
Yes, you can track CEMEX SAB DE CV financials in yearly and quarterly reports right on TradingView.
CEMEX SAB DE CV is going to release the next earnings report on Jul 24, 2025. Keep track of upcoming events with our Earnings Calendar.
CEXB earnings for the last quarter are 0.04 EUR per share, whereas the estimation was 0.01 EUR resulting in a 622.67% surprise. The estimated earnings for the next quarter are 0.01 EUR per share. See more details about CEMEX SAB DE CV earnings.
CEMEX SAB DE CV revenue for the last quarter amounts to 3.22 B EUR, despite the estimated figure of 3.34 B EUR. In the next quarter, revenue is expected to reach 3.59 B EUR.
CEXB net income for the last quarter is 675.87 M EUR, while the quarter before that showed 44.98 M EUR of net income which accounts for 1.40 K% change. Track more CEMEX SAB DE CV financial stats to get the full picture.
CEMEX SAB DE CV dividend yield was 1.38% in 2024, and payout ratio reached 14.24%. The year before the numbers were 0.00% and 0.00% correspondingly. See high-dividend stocks and find more opportunities for your portfolio.
As of Jul 21, 2025, the company has 44.49 K employees. See our rating of the largest employees — is CEMEX SAB DE CV on this list?
EBITDA measures a company's operating performance, its growth signifies an improvement in the efficiency of a company. CEMEX SAB DE CV EBITDA is 2.56 B EUR, and current EBITDA margin is 19.00%. See more stats in CEMEX SAB DE CV financial statements.
Like other stocks, CEXB shares are traded on stock exchanges, e.g. Nasdaq, Nyse, Euronext, and the easiest way to buy them is through an online stock broker. To do this, you need to open an account and follow a broker's procedures, then start trading. You can trade CEMEX SAB DE CV stock right from TradingView charts — choose your broker and connect to your account.