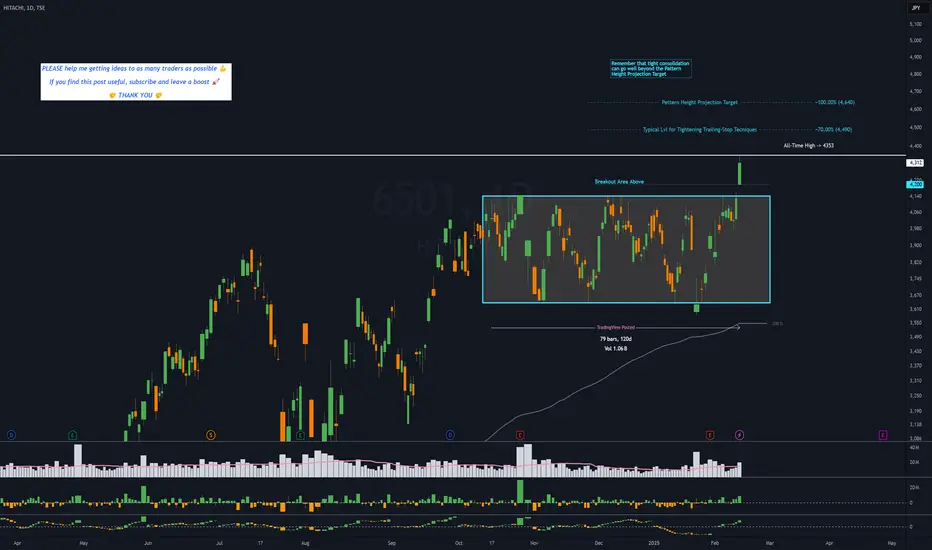
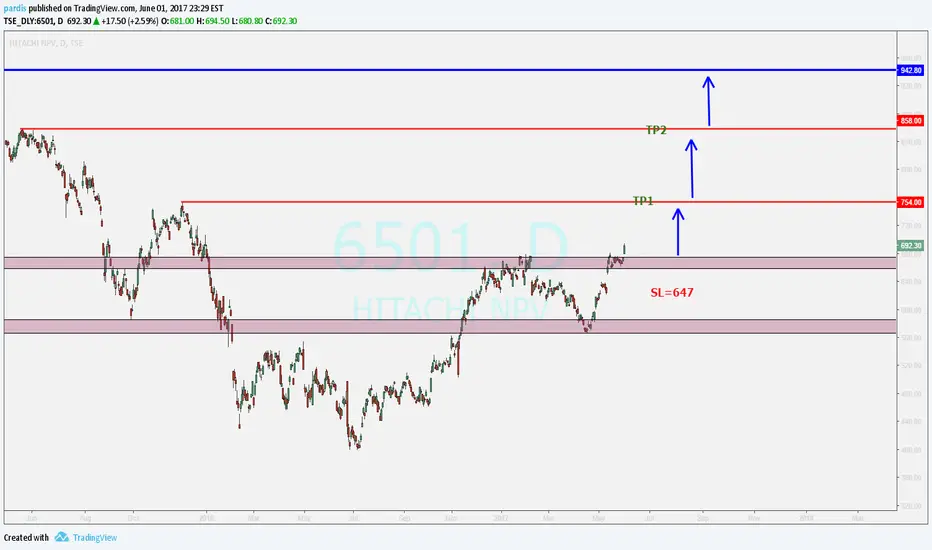
6501 - 4 months RECTANGLE══════════════════════════════
Since 2014, my markets approach is to spot
trading opportunities based solely on the
development of
CLASSICAL CHART PATTERNS
🤝Let’s learn and grow together 🤝
══════════════════════════════
Hello Traders ✌
After a careful consideration I came to the conclusion that:
-
Next report date
—
Report period
—
EPS estimate
—
Revenue estimate
—
0.83 EUR
3.79 B EUR
60.28 B EUR
4.39 B
About HITACHI
Sector
Industry
CEO
Toshiaki Tokunaga
Website
Headquarters
Tokyo
Founded
1980
ISIN
JP3788600009
FIGI
BBG000CZ8JJ8
Hitachi Ltd. engages in the manufacture and sale of electrical equipment. It operates through the following segments: Digital Systems & Services, Green Energy & Mobility and Connective Industries. The Digital Systems & Services segment includes digital solutions, IT products and ATM. The Green Energy & Mobility segment services includes energy solution and railway system. The Connective Industries segment services includes building systems, lifestyle, measurement and analysis systems, industrial and distribution solutions, water/environmental solutions and industrial equipment. The company was founded by Namihei Odaira in 1910 and is headquartered in Tokyo, Japan.
Related stocks
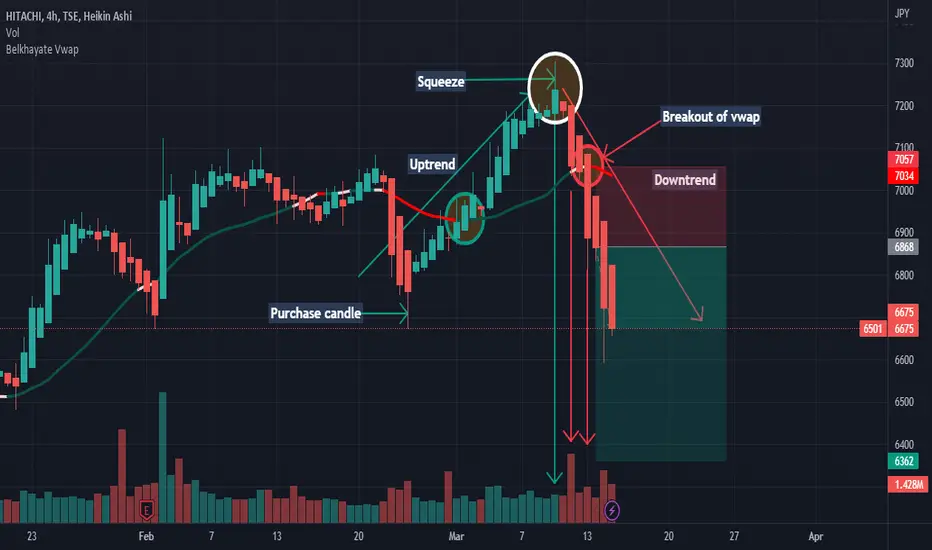
6501: Analysis:Sell ideaSell idea on 6501 as you see on the chart because we have a squeeze and also we have the breakout with force the vwap indicator by a big red candle with a large red volume so it's mean that the sellers took over the buyers.Thanks!
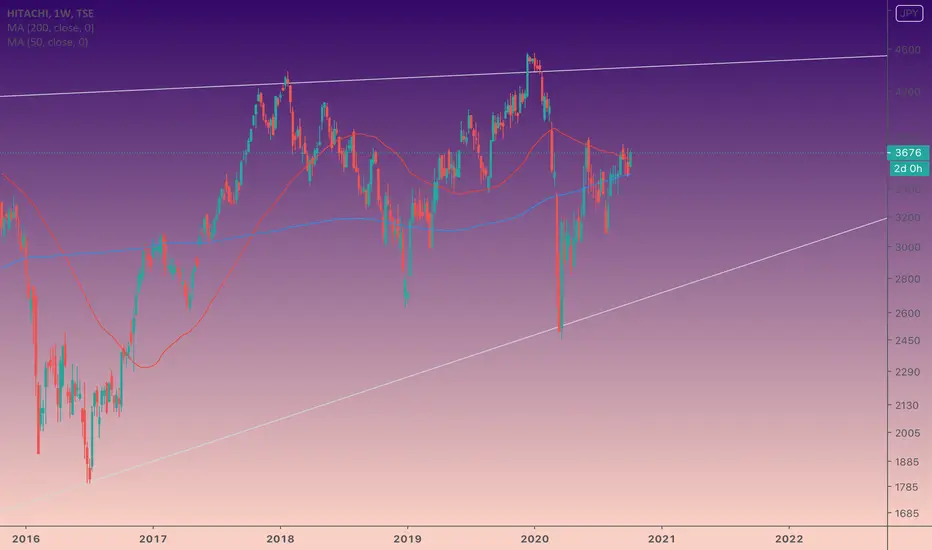
HITACHI BULL RUNBreak and test confirming Bull Run although volume seems a bit flat.
Japan turning up the production on a few things here, good to take a look at their Sector.
Good solid stock.I can't believe no on has published ideas on this solid stock. I'd like to see all those publishers and Idea people out there share their ideas on this one b/c this one has been very good to me. I am hoping they are getting into generation iv nuclear. Id' like to find more generation iv nuclear.
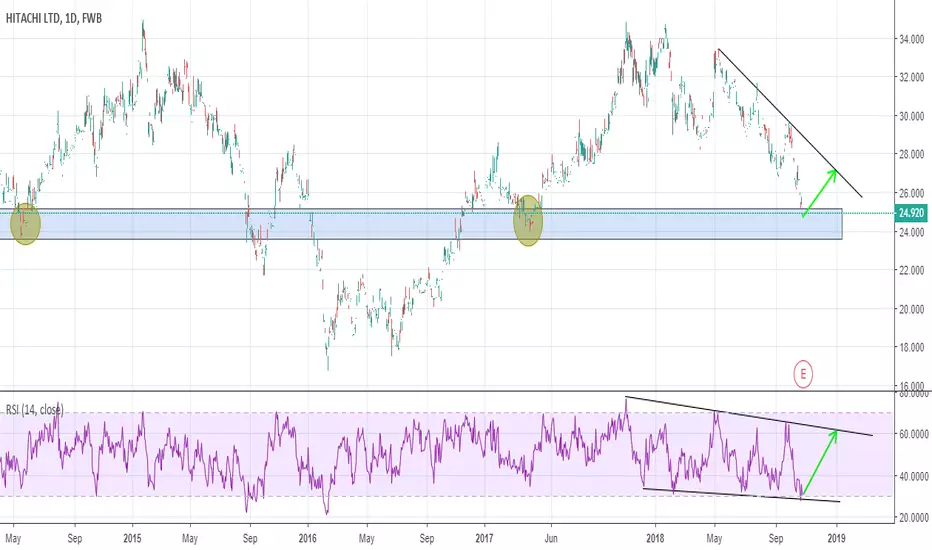
Hitachi Ltd (6501 - Tokyo) - Updated EW count - from previous Hitachi Ltd (6501 - Tokyo) is in 5th internal of 3rd minor of C wave up, which is about to end (if not extended further). Thereafter 4th wave correction will start, which will give opportunity for small trading. Alternatively it can be major 3rd of C wave, but next correction size will reveal the co

Hitachi Ltd (6501 - Tokyo) - C wave upHitachi Ltd (6501 - Tokyo) is in Technology stock in Japan, which in WXY pattern in Weekly time frame from 2010 low and currently in Y wave up in ABC sequence. Price is in C wave up, which confirmed when it completes five wave sequence in smaller time frame say 60 min. In 30 min time frame it made A


See all ideas
Summarizing what the indicators are suggesting.
Neutral
SellBuy
Strong sellStrong buy
Strong sellSellNeutralBuyStrong buy
Neutral
SellBuy
Strong sellStrong buy
Strong sellSellNeutralBuyStrong buy
Neutral
SellBuy
Strong sellStrong buy
Strong sellSellNeutralBuyStrong buy
An aggregate view of professional's ratings.
Neutral
SellBuy
Strong sellStrong buy
Strong sellSellNeutralBuyStrong buy
Neutral
SellBuy
Strong sellStrong buy
Strong sellSellNeutralBuyStrong buy
Neutral
SellBuy
Strong sellStrong buy
Strong sellSellNeutralBuyStrong buy
Displays a symbol's price movements over previous years to identify recurring trends.
Curated watchlists where HIA1 is featured.


Frequently Asked Questions
The current price of HIA1 is 24.42 EUR — it has decreased by −0.72% in the past 24 hours. Watch HITACHI LTD stock price performance more closely on the chart.
Depending on the exchange, the stock ticker may vary. For instance, on GETTEX exchange HITACHI LTD stocks are traded under the ticker HIA1.
HIA1 stock has fallen by −5.76% compared to the previous week, the month change is a −3.48% fall, over the last year HITACHI LTD has showed a 14.92% increase.
We've gathered analysts' opinions on HITACHI LTD future price: according to them, HIA1 price has a max estimate of 30.56 EUR and a min estimate of 19.98 EUR. Watch HIA1 chart and read a more detailed HITACHI LTD stock forecast: see what analysts think of HITACHI LTD and suggest that you do with its stocks.
HIA1 reached its all-time high on Jun 26, 2024 with the price of 105.20 EUR, and its all-time low was 3.40 EUR and was reached on Feb 12, 2016. View more price dynamics on HIA1 chart.
See other stocks reaching their highest and lowest prices.
See other stocks reaching their highest and lowest prices.
HIA1 stock is 3.99% volatile and has beta coefficient of 1.65. Track HITACHI LTD stock price on the chart and check out the list of the most volatile stocks — is HITACHI LTD there?
Today HITACHI LTD has the market capitalization of 106.53 B, it has decreased by −0.56% over the last week.
Yes, you can track HITACHI LTD financials in yearly and quarterly reports right on TradingView.
HITACHI LTD is going to release the next earnings report on Jul 31, 2025. Keep track of upcoming events with our Earnings Calendar.
HIA1 earnings for the last quarter are 0.25 EUR per share, whereas the estimation was 0.30 EUR resulting in a −16.25% surprise. The estimated earnings for the next quarter are 0.22 EUR per share. See more details about HITACHI LTD earnings.
HITACHI LTD revenue for the last quarter amounts to 17.08 B EUR, despite the estimated figure of 16.89 B EUR. In the next quarter, revenue is expected to reach 13.80 B EUR.
HIA1 net income for the last quarter is 1.14 B EUR, while the quarter before that showed 850.97 M EUR of net income which accounts for 33.91% change. Track more HITACHI LTD financial stats to get the full picture.
HITACHI LTD dividend yield was 1.24% in 2024, and payout ratio reached 32.12%. The year before the numbers were 1.29% and 28.37% correspondingly. See high-dividend stocks and find more opportunities for your portfolio.
As of Jul 8, 2025, the company has 282.74 K employees. See our rating of the largest employees — is HITACHI LTD on this list?
EBITDA measures a company's operating performance, its growth signifies an improvement in the efficiency of a company. HITACHI LTD EBITDA is 8.65 B EUR, and current EBITDA margin is 14.34%. See more stats in HITACHI LTD financial statements.
Like other stocks, HIA1 shares are traded on stock exchanges, e.g. Nasdaq, Nyse, Euronext, and the easiest way to buy them is through an online stock broker. To do this, you need to open an account and follow a broker's procedures, then start trading. You can trade HITACHI LTD stock right from TradingView charts — choose your broker and connect to your account.
Investing in stocks requires a comprehensive research: you should carefully study all the available data, e.g. company's financials, related news, and its technical analysis. So HITACHI LTD technincal analysis shows the buy rating today, and its 1 week rating is buy. Since market conditions are prone to changes, it's worth looking a bit further into the future — according to the 1 month rating HITACHI LTD stock shows the buy signal. See more of HITACHI LTD technicals for a more comprehensive analysis.
If you're still not sure, try looking for inspiration in our curated watchlists.
If you're still not sure, try looking for inspiration in our curated watchlists.