ESAB Possible LongESAB’s stock is showing strong potential with a bullish flag pattern, signaling accumulation and backed by significant buying interest, as seen in the volume spike and wick out of a bullish order block. Break above $129.19 and the confirmation of a **change of character** on a lower timeframe would
Next report date
—
Report period
—
EPS estimate
—
Revenue estimate
—
4.15 EUR
254.51 M EUR
2.65 B EUR
56.68 M
About ESAB Corporation
Sector
Industry
CEO
Shyam P. Kambeyanda
Website
Headquarters
North Bethesda
Founded
1904
ESAB Corp. engages in fabrication technology and gas control solutions. It operates through the Americas and EMEA and APAC segments. The Americas segment includes operations in North America and South America. The EMEA and APAC segment consists of Europe, Middle East, India, Africa and Asia Pacific. The firm provides its partners with advanced equipment, consumables, gas control equipment, robotics, and digital solutions. Its products are utilized to solve challenges in a wide range of industries, including cutting, joining, and automated welding. The company was founded by Oscar Kjellberg in 1904 and is headquartered in North Bethesda, MD.
Related stocks

Sustainability Stocks: ESAB ExampleNYSE:ESAB has been around for many years although it only went public on the NYSE as a Swedish-American company in 2022.
ESAB Corporation is focusing on sustainability and connected fabrication technology, which is an area headed for more growth.
The stock is 90% held by institutions. ALL of th

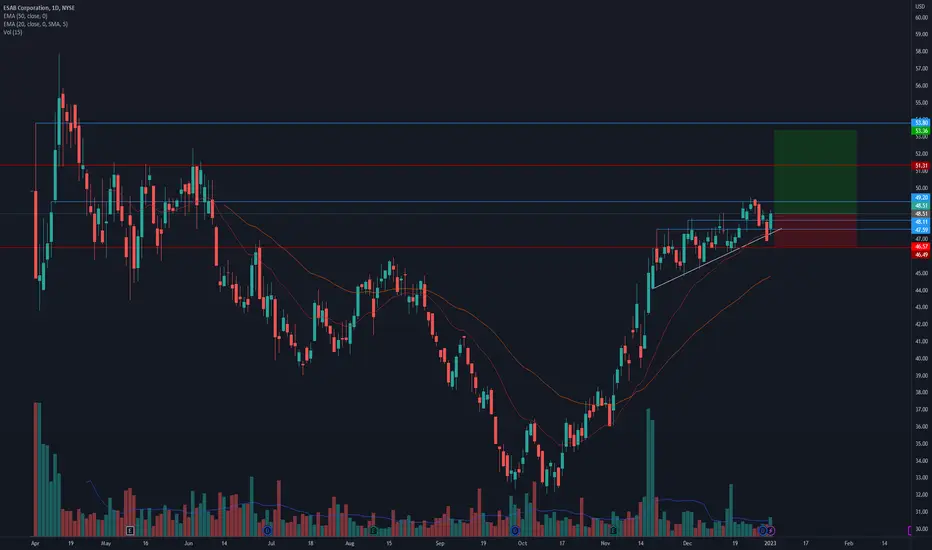
Can $ESAB go higher from here?Notes:
* Moving up on the right side of its IPO base
* Good earnings
* Breaking out of an ascending triangle with higher than average volume
* Has a 50 day UD ratio of 2.26 and a 15 day UD ratio of 5.27; indicating that there's been a ton more buying short term
* Has a solid relative strength in th
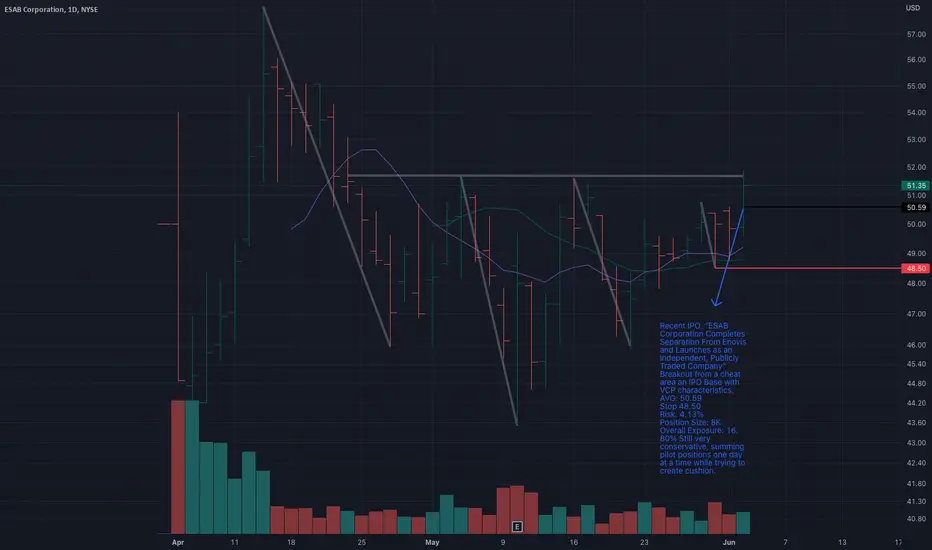
ESAB IPO BaseRecent IPO. "ESAB Corporation Completes Separation From Enovis and Launches as an Independent, Publicly Traded Company"
Breakout from a cheat area an IPO Base with VCP characteristics.
AVG: 50.59
Stop 48.50
Risk: 4.13%
Position Size: 8K
Overall Exposure: 16.80% Still very conservative, summing pilo
See all ideas
Summarizing what the indicators are suggesting.
Neutral
SellBuy
Strong sellStrong buy
Strong sellSellNeutralBuyStrong buy
Neutral
SellBuy
Strong sellStrong buy
Strong sellSellNeutralBuyStrong buy
Neutral
SellBuy
Strong sellStrong buy
Strong sellSellNeutralBuyStrong buy
An aggregate view of professional's ratings.
Neutral
SellBuy
Strong sellStrong buy
Strong sellSellNeutralBuyStrong buy
Neutral
SellBuy
Strong sellStrong buy
Strong sellSellNeutralBuyStrong buy
Neutral
SellBuy
Strong sellStrong buy
Strong sellSellNeutralBuyStrong buy
Displays a symbol's price movements over previous years to identify recurring trends.
CFX5780787
ESAB Corporation 6.25% 15-APR-2029Yield to maturity
6.17%
Maturity date
Apr 15, 2029
CFX5780788
ESAB Corporation 6.25% 15-APR-2029Yield to maturity
5.51%
Maturity date
Apr 15, 2029
See all O03 bonds
Frequently Asked Questions
The current price of O03 is 103.00 EUR — it hasn't changed in the past 24 hours. Watch ESAB CORPORATION stock price performance more closely on the chart.
Depending on the exchange, the stock ticker may vary. For instance, on GETTEX exchange ESAB CORPORATION stocks are traded under the ticker O03.
O03 stock hasn't changed in a week, the month change is a −6.42% fall, over the last year ESAB CORPORATION has showed a 15.73% increase.
We've gathered analysts' opinions on ESAB CORPORATION future price: according to them, O03 price has a max estimate of 131.96 EUR and a min estimate of 105.57 EUR. Watch O03 chart and read a more detailed ESAB CORPORATION stock forecast: see what analysts think of ESAB CORPORATION and suggest that you do with its stocks.
O03 stock is 0.98% volatile and has beta coefficient of 1.17. Track ESAB CORPORATION stock price on the chart and check out the list of the most volatile stocks — is ESAB CORPORATION there?
Today ESAB CORPORATION has the market capitalization of 6.15 B, it has decreased by −6.00% over the last week.
Yes, you can track ESAB CORPORATION financials in yearly and quarterly reports right on TradingView.
ESAB CORPORATION is going to release the next earnings report on Jul 31, 2025. Keep track of upcoming events with our Earnings Calendar.
O03 earnings for the last quarter are 1.16 EUR per share, whereas the estimation was 1.11 EUR resulting in a 4.34% surprise. The estimated earnings for the next quarter are 1.14 EUR per share. See more details about ESAB CORPORATION earnings.
ESAB CORPORATION revenue for the last quarter amounts to 597.96 M EUR, despite the estimated figure of 585.87 M EUR. In the next quarter, revenue is expected to reach 573.39 M EUR.
O03 net income for the last quarter is 62.04 M EUR, while the quarter before that showed 51.61 M EUR of net income which accounts for 20.21% change. Track more ESAB CORPORATION financial stats to get the full picture.
Yes, O03 dividends are paid quarterly. The last dividend per share was 0.07 EUR. As of today, Dividend Yield (TTM)% is 0.27%. Tracking ESAB CORPORATION dividends might help you take more informed decisions.
ESAB CORPORATION dividend yield was 0.25% in 2024, and payout ratio reached 6.96%. The year before the numbers were 0.27% and 6.85% correspondingly. See high-dividend stocks and find more opportunities for your portfolio.
As of Jun 27, 2025, the company has 9.3 K employees. See our rating of the largest employees — is ESAB CORPORATION on this list?
EBITDA measures a company's operating performance, its growth signifies an improvement in the efficiency of a company. ESAB CORPORATION EBITDA is 489.01 M EUR, and current EBITDA margin is 19.13%. See more stats in ESAB CORPORATION financial statements.
Like other stocks, O03 shares are traded on stock exchanges, e.g. Nasdaq, Nyse, Euronext, and the easiest way to buy them is through an online stock broker. To do this, you need to open an account and follow a broker's procedures, then start trading. You can trade ESAB CORPORATION stock right from TradingView charts — choose your broker and connect to your account.
Investing in stocks requires a comprehensive research: you should carefully study all the available data, e.g. company's financials, related news, and its technical analysis. So ESAB CORPORATION technincal analysis shows the sell today, and its 1 week rating is sell. Since market conditions are prone to changes, it's worth looking a bit further into the future — according to the 1 month rating ESAB CORPORATION stock shows the strong sell signal. See more of ESAB CORPORATION technicals for a more comprehensive analysis.
If you're still not sure, try looking for inspiration in our curated watchlists.
If you're still not sure, try looking for inspiration in our curated watchlists.