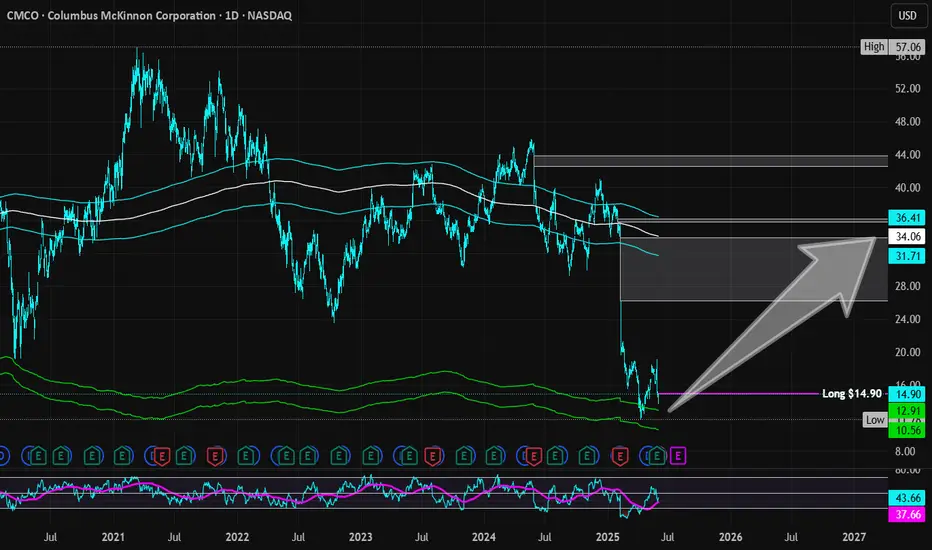
Columbus McKinnon Corp | CMCO | Long at $14.90Columbus McKinnon Corp NASDAQ:CMCO is a stock that is highly cyclical, moving in "boom and bust" cycles every 3-5 years. As indicated by its entry into my "crash" simple moving average area (currently between $11 and $13), it may be nearing the end of its bust cycle (time will tell). With a book v
Next report date
—
Report period
—
EPS estimate
—
Revenue estimate
—
−0.16 EUR
−4.75 M EUR
890.17 M EUR
27.86 M
About Columbus McKinnon Corporation
Sector
CEO
David J. Wilson
Website
Headquarters
Charlotte
Founded
1875
Columbus McKinnon Corp. engages in the design, manufacture, and marketing of material handling products and systems. Its products include hoists, chain and rigging tools, digital power control and delivery systems, actuators and rotary unions, industrial cranes, and elevator application drive systems which are distributed through STAHL, Herc-Alloy, Magnetek, Duff-Norton, Pfaff, and other brands. The company was founded in 1875 and is headquartered in Charlotte, NC.
Related stocks
CMCO - Upward channel formation short from CMCO looks decent short as it is breaking down from an upward channel formation. It has insider selling. We think it was strong downside potential.
* Trade Criteria *
Date First Found- February 6, 2018
Pattern/Why- Upward channel breakdown short
Entry Criteria- Current price (37.55) (Hi Febr

See all ideas
Summarizing what the indicators are suggesting.
Neutral
SellBuy
Strong sellStrong buy
Strong sellSellNeutralBuyStrong buy
Neutral
SellBuy
Strong sellStrong buy
Strong sellSellNeutralBuyStrong buy
Neutral
SellBuy
Strong sellStrong buy
Strong sellSellNeutralBuyStrong buy
An aggregate view of professional's ratings.
Neutral
SellBuy
Strong sellStrong buy
Strong sellSellNeutralBuyStrong buy
Neutral
SellBuy
Strong sellStrong buy
Strong sellSellNeutralBuyStrong buy
Neutral
SellBuy
Strong sellStrong buy
Strong sellSellNeutralBuyStrong buy
Displays a symbol's price movements over previous years to identify recurring trends.
Frequently Asked Questions
The current price of VC3 is 13.80 EUR — it has decreased by −0.72% in the past 24 hours. Watch COLUMBUS MCKINNON CORP NEW YORK stock price performance more closely on the chart.
Depending on the exchange, the stock ticker may vary. For instance, on GETTEX exchange COLUMBUS MCKINNON CORP NEW YORK stocks are traded under the ticker VC3.
VC3 stock has risen by 6.98% compared to the previous week, the month change is a 6.98% rise, over the last year COLUMBUS MCKINNON CORP NEW YORK has showed a −55.77% decrease.
We've gathered analysts' opinions on COLUMBUS MCKINNON CORP NEW YORK future price: according to them, VC3 price has a max estimate of 31.25 EUR and a min estimate of 13.02 EUR. Watch VC3 chart and read a more detailed COLUMBUS MCKINNON CORP NEW YORK stock forecast: see what analysts think of COLUMBUS MCKINNON CORP NEW YORK and suggest that you do with its stocks.
VC3 stock is 0.72% volatile and has beta coefficient of 1.10. Track COLUMBUS MCKINNON CORP NEW YORK stock price on the chart and check out the list of the most volatile stocks — is COLUMBUS MCKINNON CORP NEW YORK there?
Today COLUMBUS MCKINNON CORP NEW YORK has the market capitalization of 399.66 M, it has decreased by −5.08% over the last week.
Yes, you can track COLUMBUS MCKINNON CORP NEW YORK financials in yearly and quarterly reports right on TradingView.
COLUMBUS MCKINNON CORP NEW YORK is going to release the next earnings report on Jul 30, 2025. Keep track of upcoming events with our Earnings Calendar.
VC3 earnings for the last quarter are 0.55 EUR per share, whereas the estimation was 0.53 EUR resulting in a 4.35% surprise. The estimated earnings for the next quarter are 0.40 EUR per share. See more details about COLUMBUS MCKINNON CORP NEW YORK earnings.
COLUMBUS MCKINNON CORP NEW YORK revenue for the last quarter amounts to 228.22 M EUR, despite the estimated figure of 231.13 M EUR. In the next quarter, revenue is expected to reach 195.93 M EUR.
VC3 net income for the last quarter is −2.48 M EUR, while the quarter before that showed 3.83 M EUR of net income which accounts for −164.86% change. Track more COLUMBUS MCKINNON CORP NEW YORK financial stats to get the full picture.
Yes, VC3 dividends are paid quarterly. The last dividend per share was 0.06 EUR. As of today, Dividend Yield (TTM)% is 1.71%. Tracking COLUMBUS MCKINNON CORP NEW YORK dividends might help you take more informed decisions.
As of Jul 6, 2025, the company has 3.48 K employees. See our rating of the largest employees — is COLUMBUS MCKINNON CORP NEW YORK on this list?
EBITDA measures a company's operating performance, its growth signifies an improvement in the efficiency of a company. COLUMBUS MCKINNON CORP NEW YORK EBITDA is 95.06 M EUR, and current EBITDA margin is 11.07%. See more stats in COLUMBUS MCKINNON CORP NEW YORK financial statements.
Like other stocks, VC3 shares are traded on stock exchanges, e.g. Nasdaq, Nyse, Euronext, and the easiest way to buy them is through an online stock broker. To do this, you need to open an account and follow a broker's procedures, then start trading. You can trade COLUMBUS MCKINNON CORP NEW YORK stock right from TradingView charts — choose your broker and connect to your account.
Investing in stocks requires a comprehensive research: you should carefully study all the available data, e.g. company's financials, related news, and its technical analysis. So COLUMBUS MCKINNON CORP NEW YORK technincal analysis shows the neutral today, and its 1 week rating is sell. Since market conditions are prone to changes, it's worth looking a bit further into the future — according to the 1 month rating COLUMBUS MCKINNON CORP NEW YORK stock shows the sell signal. See more of COLUMBUS MCKINNON CORP NEW YORK technicals for a more comprehensive analysis.
If you're still not sure, try looking for inspiration in our curated watchlists.
If you're still not sure, try looking for inspiration in our curated watchlists.