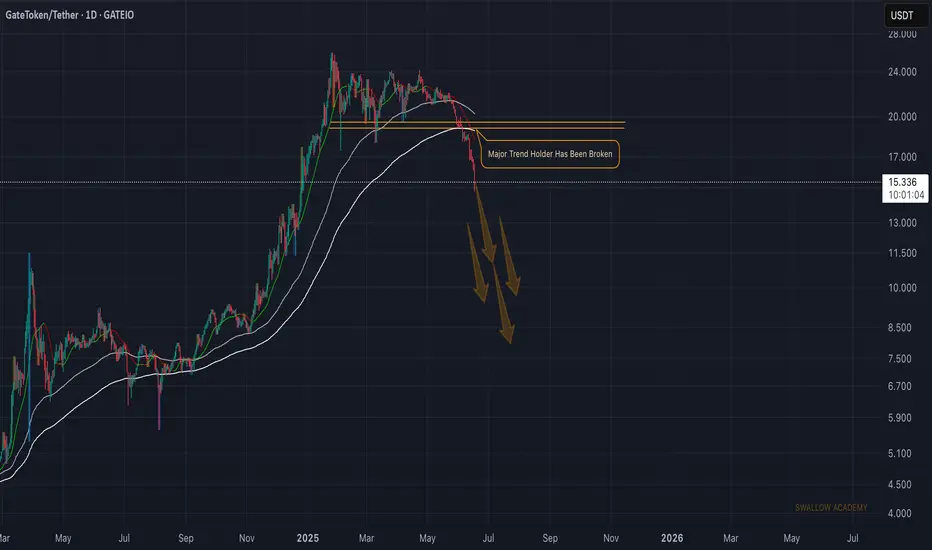
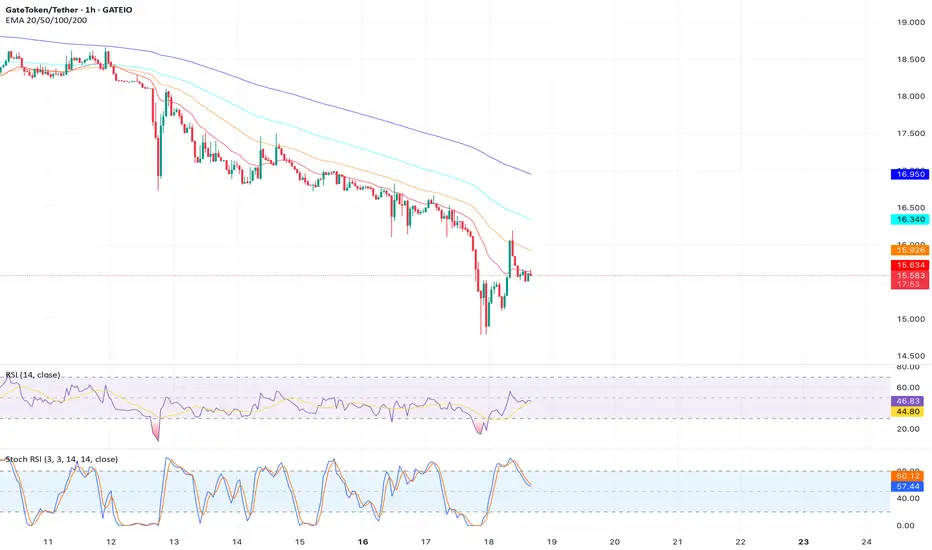
GateToken (GT): Major Trend Holder 200EMA Has Been BrokenGatecoin seems to be doomed, where we have had a market structure break (MSB), which then led to a break of the 200EMA.
Now if we do not see any foundation to form here (in form of support), then we are doomed, and price can dip as low as $9.20
Swallow Academy
GTUSDT trade ideas
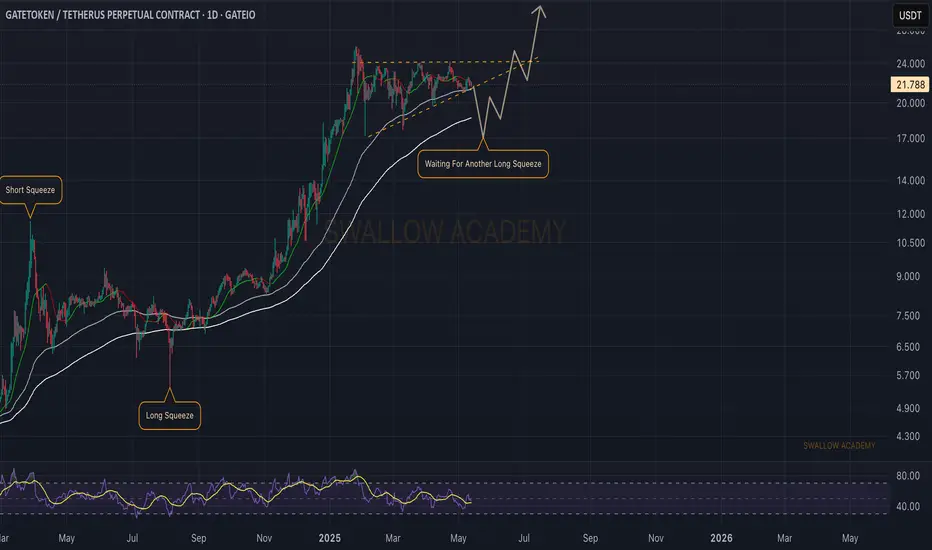
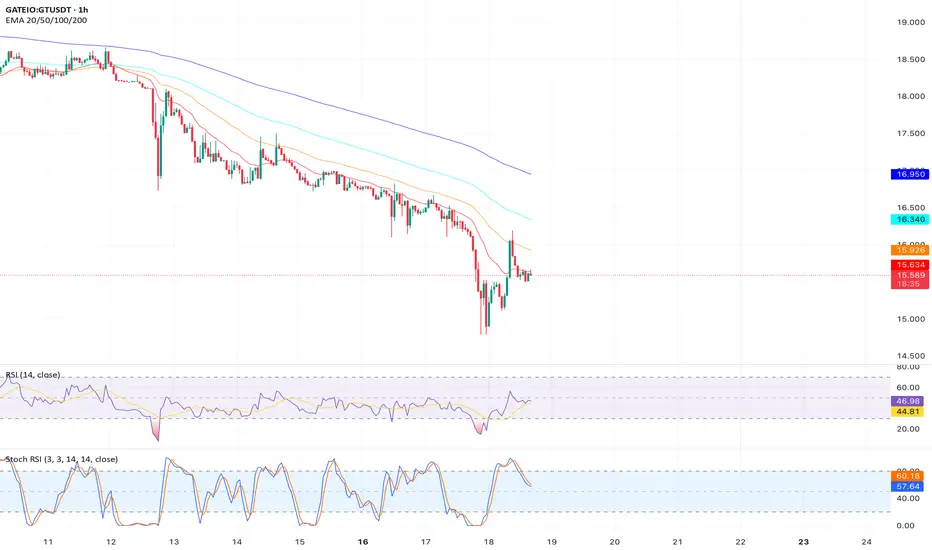
Gatetoken (GT): 200 EMA Is Strong Trend Holder | Long Squeeze?Gatetoken caught our attention with that strong 200EMA trend that price has been gliding on for some time now. As price has stumbled upon some sort of resistance area, we are seeing a nice bullish pattern forming here, but before a proper breakout, we might see another long squeeze, so watch out!
Swallow Academy
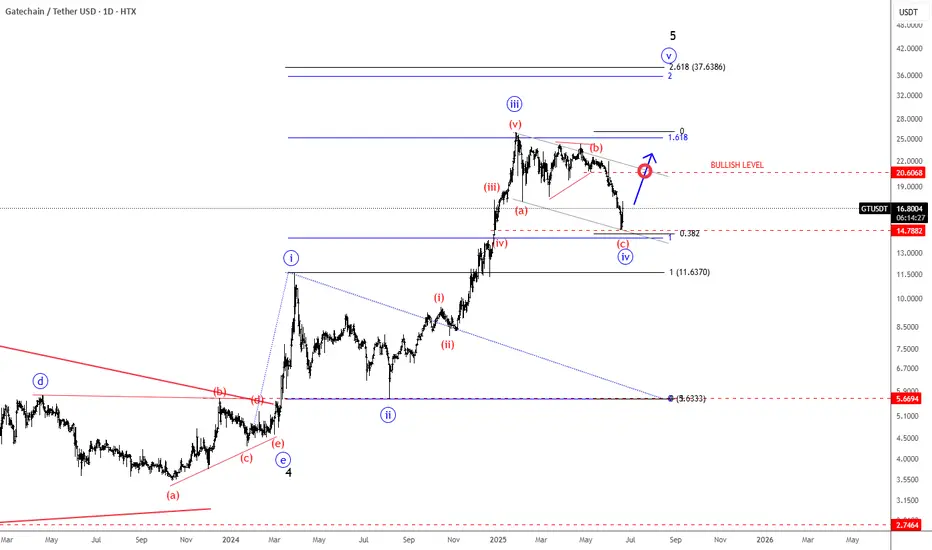
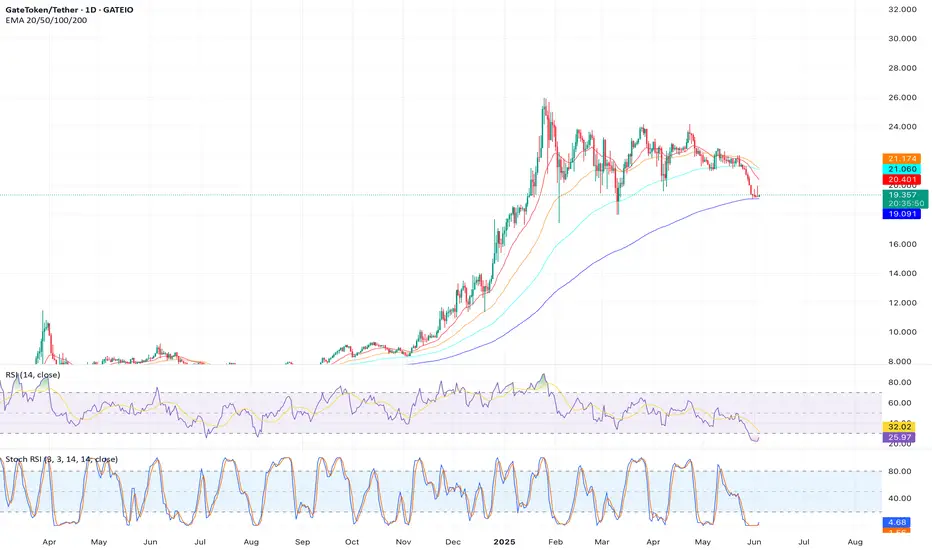
GateChain Slows Down Within An Impulsive Bullish TrendGateChain with ticker GTUSD came slightly lower, but we still see it trading in a higher degree wave »iv« correction that can resume the bullish trend for wave »v«. It can be actually finishing final subwave (c) of a three-wave (a)(b)(c) corrective decline, so keep an eye on strong support here at the former wave (iv) swing low and 38,2% Fibonacci retracement. If we get sharp rebound and impulsive rise back above channel resistance line near 20 bullish confirmation level, then we can easily expect further rally within final wave »v« of 5 this year, which can push the price even up to 35 – 40 target area.
$GT’s Inverted Adam & Eve Pattern Targets $13.50Analysis: On the weekly chart, NASDAQ:GT is forming an inverted Adam & Eve pattern, a bearish reversal signal. The price is below the 20-week SMA ($15.90), and trading volume is decreasing on rebounds, indicating reduced buyer interest. A break below $15.30 could trigger a sharp decline.
Key Levels:
Support: $14.50, $13.50
Resistance: $15.60, $16.00
Target: $13.50
Outlook: Short on a break below $15.30 with a stop loss above $15.90. Target $13.50 for a 13%+ decline. Watch for volume spike on the breakdown.

$GT’s Break Below 200-EMA Signals $14.00 TargetAnalysis: NASDAQ:GT has broken below the 200-day EMA ($15.50) on the daily chart, a significant bearish signal. The price is forming a bearish flag pattern, with the RSI at 42 trending downward. Recent posts on X highlight NASDAQ:GT ’s weak market structure, supporting a bearish bias.
Key Levels:
Support: $14.50, $14.00
Resistance: $15.50, $16.00
Target: $14.00
Outlook: Short on a close below $15.50 with a stop loss above $15.80. Target $14.00 for a 10% drop. Monitor for flag breakdown confirmation.

$GT’s Bearish Channel Targets $13.80 SupportAnalysis: NASDAQ:GT is trading within a descending channel on the daily chart, with the price rejecting the upper trendline at $16.00. The RSI is at 40, nearing oversold but with room for further downside. Volume is higher on bearish candles, indicating seller dominance.
Key Levels:
Support: $14.50, $13.80
Resistance: $15.80, $16.00
Target: $13.80
Outlook: Short on a rejection at $15.80 with a stop loss above $16.20. Target $13.80 for a 10%+ decline. Watch channel boundaries for price action.

$GT’s Lower Highs Confirm Bearish Trend to $14.2Analysis: On the 4-hour chart, NASDAQ:GT is forming lower highs, signaling a bearish trend. The price is below the 50-period SMA ($15.75), and the ADX is rising, indicating strengthening bearish momentum. Support at $15.30 was breached, setting up a move toward the next key level.
Key Levels:
Support: $14.50, $14.20
Resistance: $15.60, $16.00
Target: $14.20
Outlook: Short on a retest of $15.60 with a stop loss above $16.00. Target $14.20 for a 9% drop. Monitor ADX for trend strength.

$GT’s Failure at $16.00 Resistance Targets $13.5Analysis: NASDAQ:GT failed to break the $16.00 resistance on the daily chart, forming a bearish shooting star candle. The price is below the 50-day SMA ($15.80), and the MACD is showing a bearish crossover. Declining volume indicates fading bullish conviction, aligning with broader altcoin weakness.
Key Levels:
Support: $14.50, $13.50
Resistance: $16.00, $17.20
Target: $13.50
Outlook: Short on a close below $15.60 with a stop loss above $16.00. Target $13.50 for a 13%+ decline. Watch for bearish follow-through.
$GT’s Overbought RSI Signals Pullback to $14.5Analysis: The 1-hour chart shows NASDAQ:GT trading near the upper Bollinger Band ($16.20) with an RSI of 78, indicating overbought conditions. A bearish divergence is forming, as the RSI declines while price tests resistance at $15.80. Low volume on recent highs suggests fading momentum.
Key Levels:
Support: $14.80, $14.50
Resistance: $15.80, $16.20
Target: $14.50
Outlook: Short on a rejection at $15.80 with a stop loss above $16.20. Target $14.50 for a 7% pullback. Monitor RSI for continued divergence.

$GT Forms Bearish Head and Shoulders, Eyes $14.00Analysis: On the 4-hour chart, NASDAQ:GT is forming a head and shoulders pattern with a neckline at $15.50. The price is trading below the 20-day SMA ($15.70), and the Stochastic Oscillator is in overbought territory, signaling a potential reversal. A breakdown below $15.50 could accelerate selling.
Key Levels:
Support: $14.50, $14.00
Resistance: $15.50, $16.00
Target: $14.00
Outlook: Short on a break below $15.50 with a stop loss above $16.00. Target $14.00 for a 10% drop. Watch for confirmation via increased volume on the breakdown.
$GT Bearish Breakdown Below $15.30 Targets $13.80Analysis: NASDAQ:GT has broken below the 50-day SMA ($15.80) on the daily chart, confirming a bearish shift in market structure. The RSI at 45 is trending downward, and declining volume on rebounds suggests weak buying interest. A retest of the broken support at $15.30 failed, aligning with a bearish engulfing candle.
Key Levels:
Support: $14.50, $13.80
Resistance: $15.30 (former support), $16.00
Target: $13.80
Outlook: Short on a close below $15.30 with a stop loss above $15.80. Target $13.80 for a 10%+ decline. Monitor for continued selling pressure.
$GT Bullish Reversal at $15.00 Support Signals Upside to $19.00Analysis: NASDAQ:GT has bounced off the critical $15.00 support level on the 4-hour chart, forming a double bottom pattern. The MACD shows a bullish crossover, and the price is trading above the 20-period EMA ($15.45). The Fear & Greed Index is neutral, suggesting room for bullish sentiment. A move above $16.00 could trigger a rally toward the next resistance zone.
Key Levels:
Support: $15.00, $14.50
Resistance: $16.00, $17.72
Target: $19.00
Outlook: Long on a break above $16.00 with a stop loss below $14.80. Target $19.00 for a 20%+ move. Watch for increased buying volume to confirm momentum.
$GT Poised for Bullish Breakout Above Key Resistance at $16.5Analysis: On the daily chart, NASDAQ:GT is forming a bullish ascending triangle pattern, with price action respecting higher lows since early June 2025. The 50-day SMA ($15.80) is acting as dynamic support, while the RSI (currently at 52) indicates neutral momentum with room for upside. Volume is increasing on bullish candles, suggesting accumulation. A breakout above the $16.50 resistance could confirm bullish continuation.
Key Levels:
Support: $15.30 (50-day SMA), $14.80
Resistance: $16.50, $17.20
Target: $18.00 (measured move from triangle)
Outlook: Long on a close above $16.50 with a stop loss below $15.30. Target $18.00 for a 15%+ gain. Monitor volume for confirmation of breakout strength.

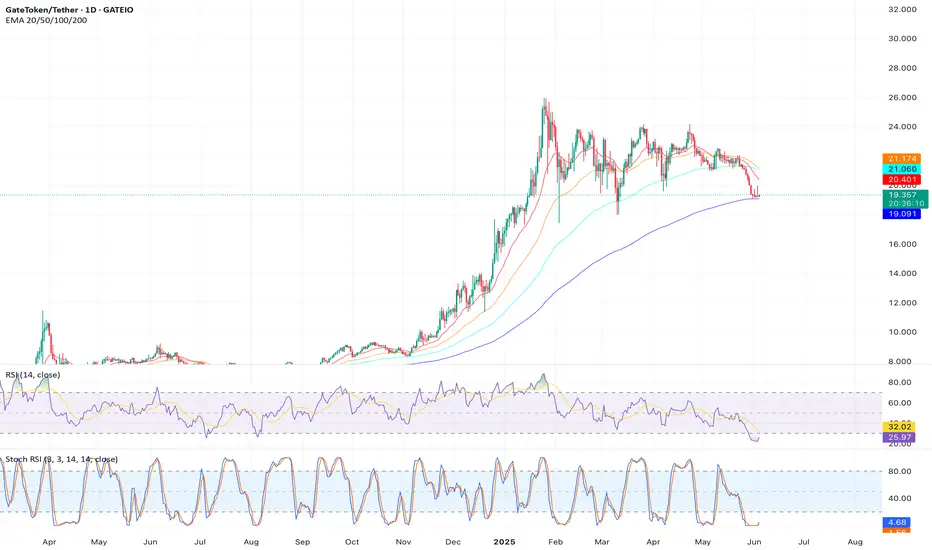
GT’s Weak Volume Suggests Decline to $19.08Analysis: At $19.37, GT is trading below the 50-day SMA ($21.37), with declining volume signaling weak bullish momentum. The 1-hour chart shows a bearish MACD crossover, and support at $19.15 is at risk. A break below could target $19.08, with further downside to $18.99.
Outlook: Short on a close below $19.15, targeting $19.08, with a stop-loss above $19.32.
GT’s Failure at $21.15 Signals Drop to $17.72Analysis: Trading at $19.37, GT has failed to break the $21.15 resistance, with a bearish engulfing candle on the daily chart. The RSI at 78 suggests overbought conditions, and the Fear & Greed Index at 64 (Greed) indicates potential selling pressure. Support at $17.72 is the next target.
Outlook: Short below $19.37, targeting $17.72, with a stop-loss above $21.15.
GT’s Bearish Pattern Targets $18.99 SupportAnalysis: GT at $19.37 is forming an inverted Adam & Eve pattern on the weekly chart, indicating a potential drop. The price is below the 20-day SMA ($21.37), and trading volume is decreasing, reflecting reduced buyer interest. A break below $19.15 could see prices fall to $18.99.
Outlook: Short below $19.15, targeting $18.99, with a stop-loss above $19.41.

GT’s Lower Highs Point to Bearish Trend Below $19.55Analysis: At $19.37, GT is forming lower highs on the 4-hour chart, signaling bearish momentum. The price is below the 50-day SMA ($21.37), and the Stochastic Oscillator is trending downward. Support at $19.55 is weakening, with $18.99 as the next target if breached.
Outlook: Short on a break below $19.55, targeting $18.99, with a stop-loss above $19.32.

GT’s Overbought RSI Warns of Pullback to $19.08Analysis: GT’s current price of $19.37 is near the upper Bollinger Band ($24.42), with the 14-day RSI at 78 indicating overbought conditions. The 1-day chart shows rejection at $21.15, and declining volume suggests a lack of conviction. A pullback to the pivot support at $19.08 is likely.
Outlook: Short below $19.37, targeting $19.08, with a stop-loss above $21.15.

GT’s Bearish Divergence Signals Correction to $17.72Analysis: At $19.37, GT exhibits bearish divergence on the 1-hour chart, with RSI declining while price attempts to hold support at $19.55. The 50-day SMA ($21.37) is acting as resistance, and low trading volume suggests waning buyer interest. A break below $19.15 could accelerate selling toward $17.72.
Outlook: Short on a close below $19.15, targeting $17.72, with a stop-loss above $19.55.

GT’s Momentum Fades, Eyes $18.99 SupportAnalysis: Trading at $19.37, GT is showing exhaustion after failing to hold above $21.15. The 4-hour chart displays a sell signal, with the price testing the pivot point at $19.24. The MACD is crossing bearish, and the Bollinger Bands show GT trading below the SMA ($22.59). A breakdown could see prices drop to $18.99.
Outlook: Short below $19.24, targeting $18.99, with a stop-loss above $19.48.

GT Faces Bearish Reversal at $21.66 ResistanceAnalysis: GT at $19.37 is struggling to break the $21.66 resistance, where a bearish shooting star candle formed on the daily chart. The RSI at 78 indicates overbought conditions, suggesting seller pressure. A drop below $19.55 could target the next support at $17.72. Declining trading volume further supports a bearish bias.
Outlook: Short on a break below $19.55, targeting $17.72, with a stop-loss above $21.15.
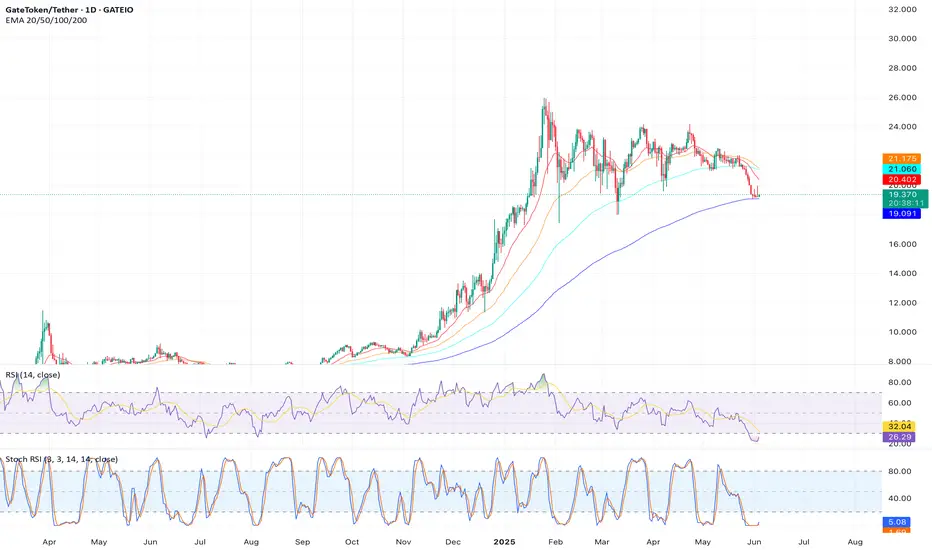
GT’s Bullish Rectangle Signals Potential Rally to $25Analysis: At $19.37, GT is forming a bullish rectangle pattern on the daily chart, with support at $19.55 and resistance at $21.15. The price is above the 50-day SMA ($21.37), indicating short-term bullishness. The 14-day RSI at 26.10 suggests oversold conditions, hinting at a potential reversal. A breakout above $21.15 could push GT toward $25, supported by Gate.io’s ecosystem growth and deflationary token burns.
Outlook: Long position on a breakout above $21.15, targeting $25. Place a stop-loss below $19.55 to manage risk. Monitor RSI for confirmation of momentum.

GT Poised for Breakout Above $21.15 ResistanceAnalysis: GateToken (GT) is trading at $19.37, consolidating above the 200-day SMA ($14.31), which signals long-term bullish strength. The weekly StochRSI shows a golden cross in the oversold zone, suggesting upward momentum. The price is testing the 50-day SMA ($21.37) but remains within a tight range of $19.55–$21.15. A breakout above $21.15 could target $22.71, with further potential to reclaim the all-time high near $25.94. Volume is steady, supporting buyer interest.
Outlook: Long entry on a close above $21.15 with a target of $22.71 and stop-loss below $19.55. Watch for increased volume to confirm the breakout.
