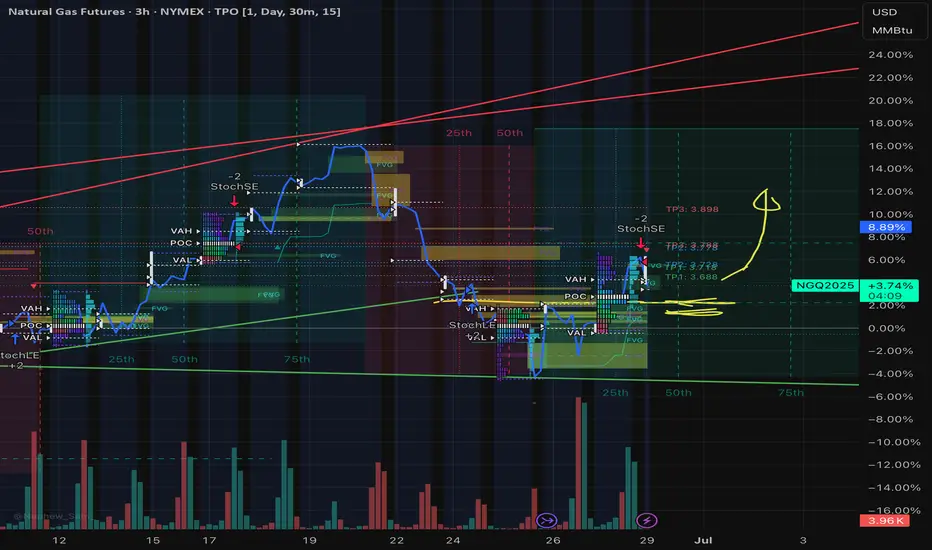
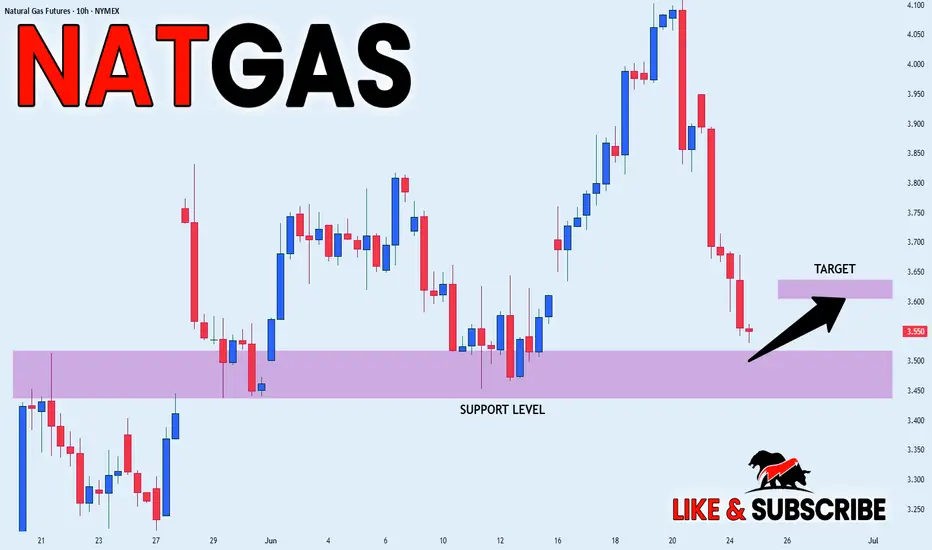
Nat Gas; Dip then RipA slight breather as expected for NG prices after such a strong reversal, from the storage report lows on 6/27/2025. Support for NG based on volume looks to be in the $3.55 to $3.65 range, before continuing a move up to $4+. NYMEX:NG1!
Related commodities
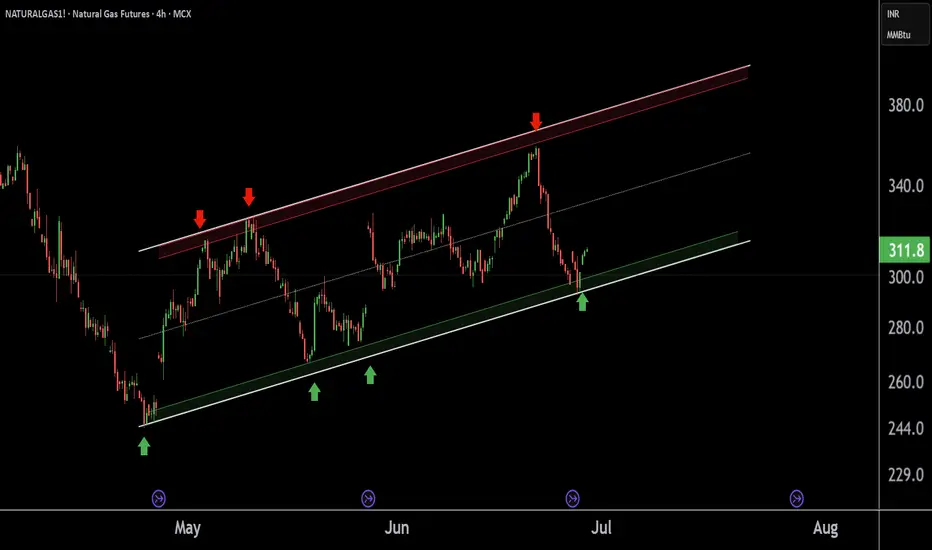
NATURALGAS at Best Support Zone This is the 4 hour chart of Natural Gas.
Natural Gas having a good Support Zone at 290-295 range.
Natural Gas has shown a reversal from its support zone.
Natural Gas is trading within a parallel channel support at 293 level Natural Gas.
Thank You !!
Natural Gas Long positionNatural Gas will be ready for LONG position from 295 to 297 Labels, be ready to catch the move till 395 and above..........
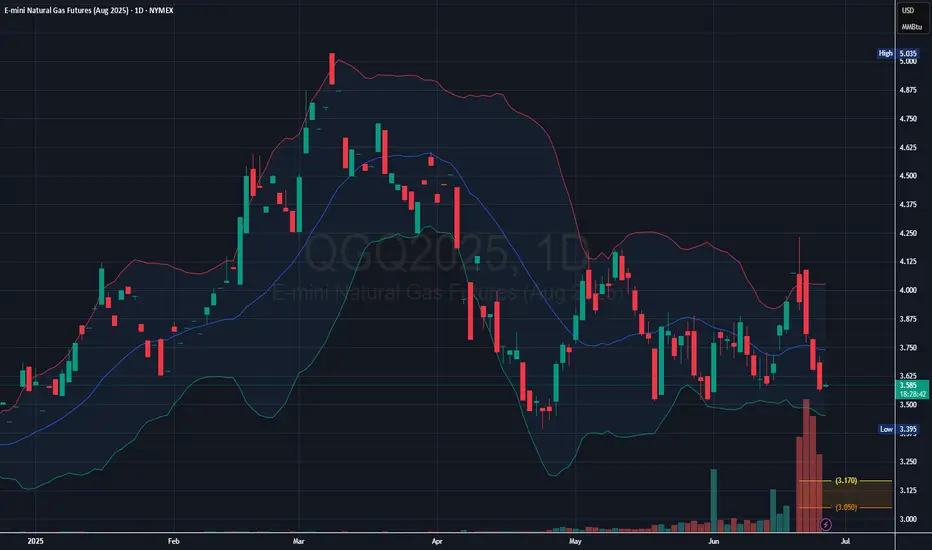
Natural Gas Futures Signal Breakdown Below Mid-Band Support
The most recent candle closed below the middle Bollinger Band (20 SMA), indicating potential downside momentum.
The price recently spiked toward the upper band (~$4.20) but was strongly rejected, creating a bearish reversal pattern.
Volume has been increasing on down days, especially the last fe
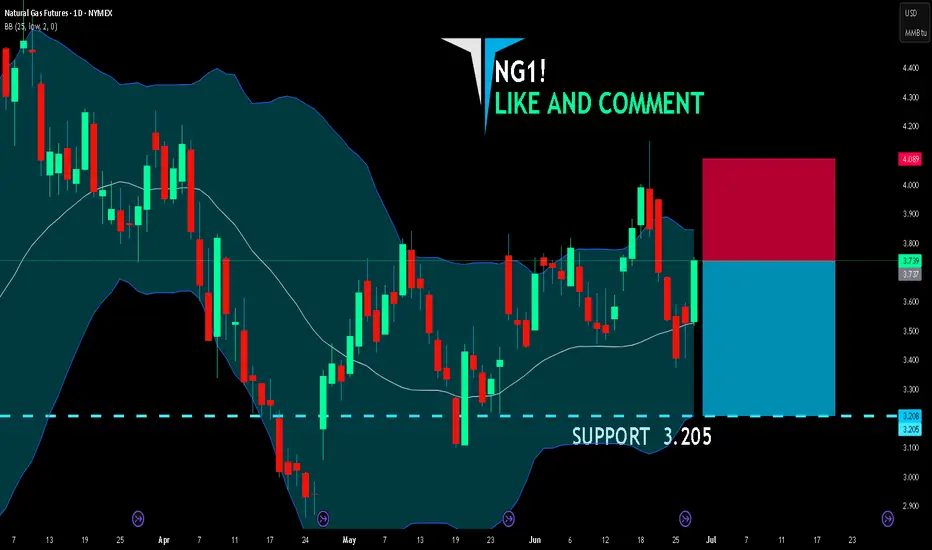
NG1! BEARS ARE GAINING STRENGTH|SHORT
NG1! SIGNAL
Trade Direction: short
Entry Level: 3.737
Target Level: 3.205
Stop Loss: 4.089
RISK PROFILE
Risk level: medium
Suggested risk: 1%
Timeframe: 1D
Disclosure: I am part of Trade Nation's Influencer program and receive a monthly fee for using their TradingView charts in my analysis.
✅L
NATGAS Long setupIf you like my Idea, Don't forget to Boost and comment on my Analysis. The recommendations are purely for educational purpose only, consult you financial advisor before trading.
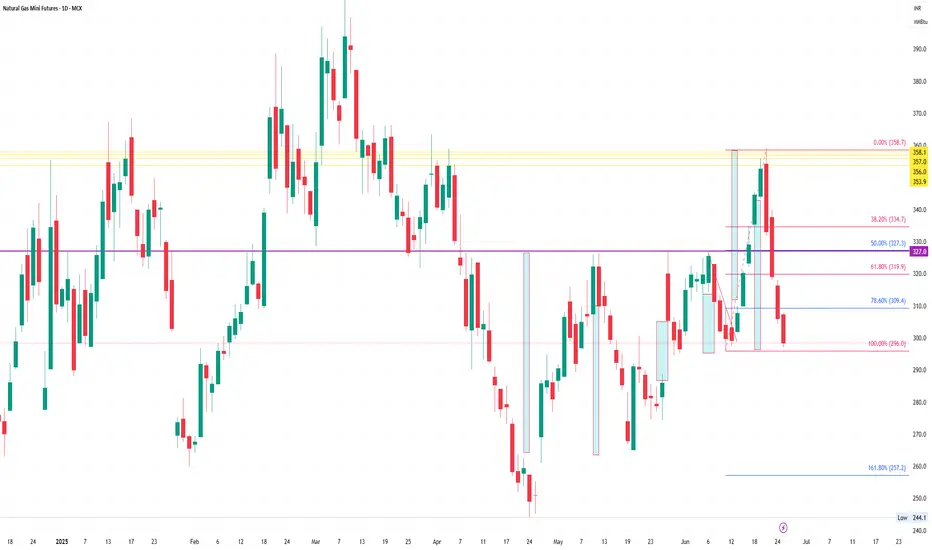
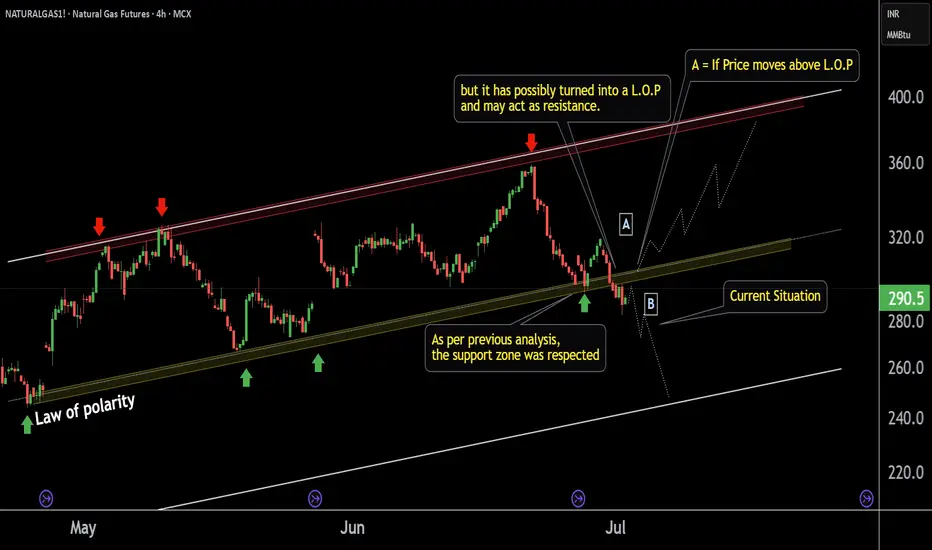
NATURALGAS1! Short time Breadkdown Alert !!This is the 4 hour chart of Natural Gas Futures.
NATURALGAS1 has given a short-term channel breakdown; the previous support may now possibly act as resistance at 300 level.
The breakdown target is the lower boundary of the broader channel, which may now act as support near at 240 level.
If lop is
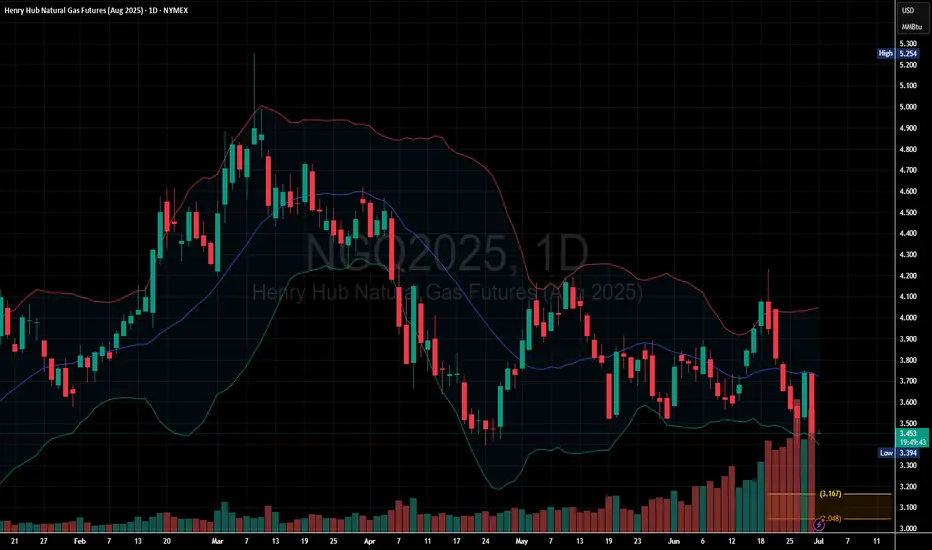
Natural Gas Slips Below Support – More Downside Ahead ?
Recent candles are large-bodied bearish candles, indicating strong selling pressure.
Bollinger Basis is sloping downward, showing short-term bearish momentum.
Price is currently below both the 20-day and 50-day moving averages, reinforcing the bearish outlook.
NATGAS: Forecast & Trading Plan
The analysis of the NATGAS chart clearly shows us that the pair is finally about to tank due to the rising pressure from the sellers.
Disclosure: I am part of Trade Nation's Influencer program and receive a monthly fee for using their TradingView charts in my analysis.
❤️ Please, support our wo
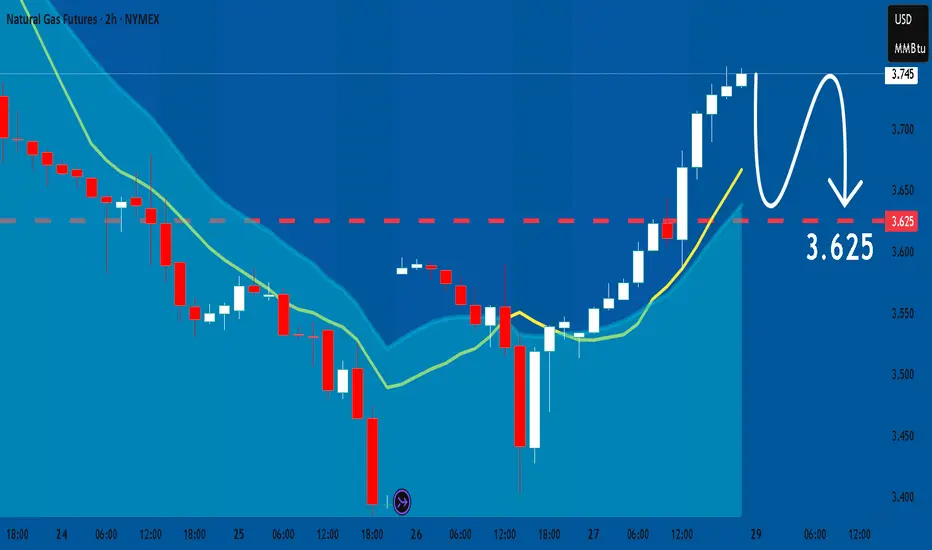
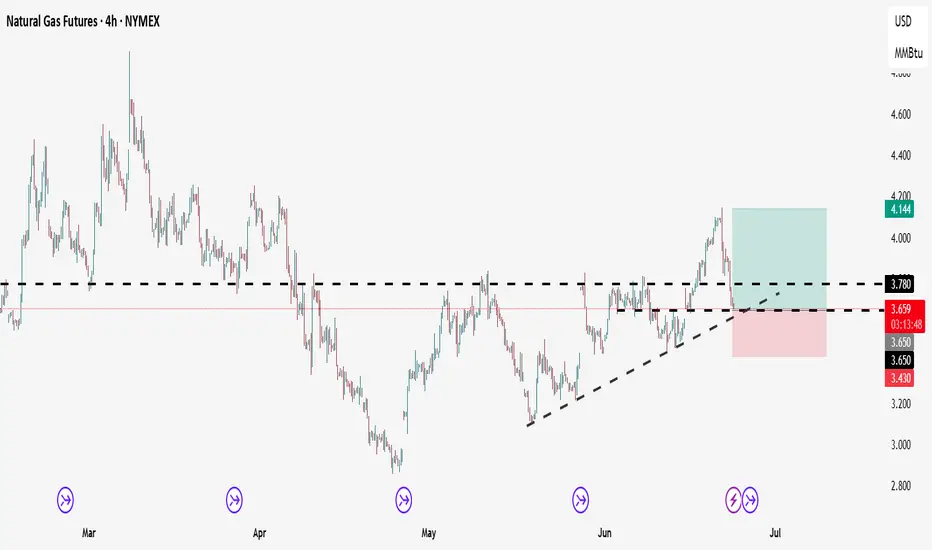
NATGAS SUPPORT AHEAD|LONG|
✅NATGAS is going down now
But a strong support level is ahead at 3.450$
Thus I am expecting a rebound
And a move up towards the target of 3.600$
LONG🚀
✅Like and subscribe to never miss a new idea!✅
Disclosure: I am part of Trade Nation's Influencer program and receive a monthly fee for u
See all ideas
Summarizing what the indicators are suggesting.
Neutral
SellBuy
Strong sellStrong buy
Strong sellSellNeutralBuyStrong buy
Neutral
SellBuy
Strong sellStrong buy
Strong sellSellNeutralBuyStrong buy
Neutral
SellBuy
Strong sellStrong buy
Strong sellSellNeutralBuyStrong buy
A representation of what an asset is worth today and what the market thinks it will be worth in the future.
Displays a symbol's price movements over previous years to identify recurring trends.
Frequently Asked Questions
The current price of French PEG Natural Gas Futures is 26.330 EUR / MWH — it has risen 0.24% in the past 24 hours. Watch French PEG Natural Gas Futures price in more detail on the chart.
Track more important stats on the French PEG Natural Gas Futures chart.
The nearest expiration date for French PEG Natural Gas Futures is Mar 28, 2029.
Traders prefer to sell futures contracts when they've already made money on the investment, but still have plenty of time left before the expiration date. Thus, many consider it a good option to sell French PEG Natural Gas Futures before Mar 28, 2029.
Open interest is the number of contracts held by traders in active positions — they're not closed or expired. For French PEG Natural Gas Futures this number is 0.00. You can use it to track a prevailing market trend and adjust your own strategy: declining open interest for French PEG Natural Gas Futures shows that traders are closing their positions, which means a weakening trend.
Buying or selling futures contracts depends on many factors: season, underlying commodity, your own trading strategy. So mostly it's up to you, but if you look for some certain calculations to take into account, you can study technical analysis for French PEG Natural Gas Futures. Today its technical rating is buy, but remember that market conditions change all the time, so it's always crucial to do your own research. See more of French PEG Natural Gas Futures technicals for a more comprehensive analysis.