INTUSDT – LONG RecommendationINTUSDT – LONG Recommendation
Trade Type: Spot or Intraday/Short-term Scalping
Entry: Current price ~$0.5347; accumulate incrementally if price drops lower.
Exit Strategy: Follow Daily timeframe (D1) peaks for closing positions.
Holding Period: Determined by D1 peak cycles (typically intrada
Related pairs

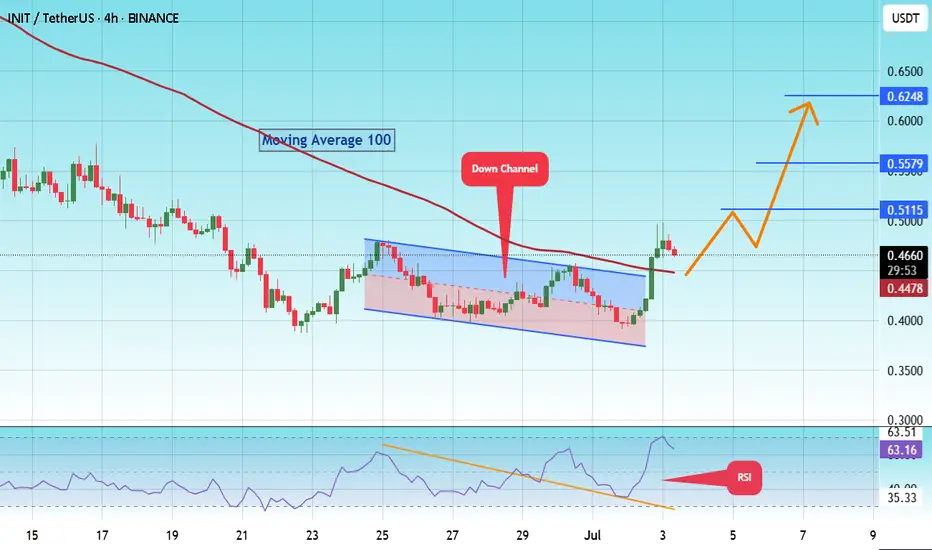
#INIT/USDT Potential Bullish Reversal After Down Channel Break #INIT
The price is moving within a descending channel on the 1-hour frame and is expected to break and continue upward.
We have a trend to stabilize above the 100 moving average once again.
We have a downtrend on the RSI indicator that supports the upward break.
We have a support area at the low
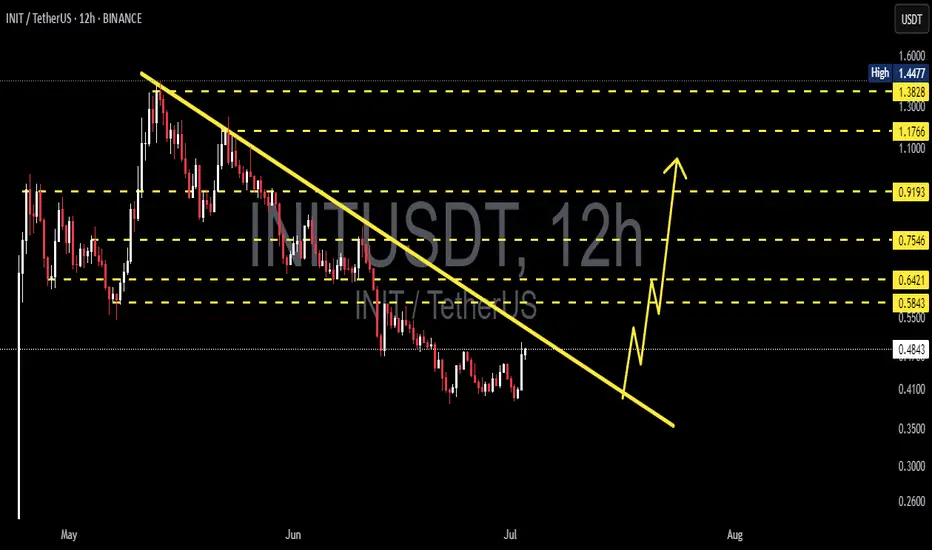
INIT/USDT Potential Bullish Reversal After Falling Wedge Break📊 Chart Pattern & Structure
Descending Trendline (Yellow Line): From early May to late June, INIT/USDT formed consistent lower highs and lower lows, creating a strong downtrend structure.
Accumulation Phase: In late June, the price consolidated around the $0.40 – $0.48 range, forming a base and is
INIT | Bullish DivergenceThe INIT/USDT daily chart shows a compelling bullish divergence setup that could signal a potential reversal from the current downtrend.
Bullish Divergence Pattern:
Price has made lower lows while RSI shows higher lows
This divergence often precedes trend reversals
Price is currently testing the

Init Bearish Entry recently experienced notable bearish momentum
actively interacting with critical liquidity and order flow areas.

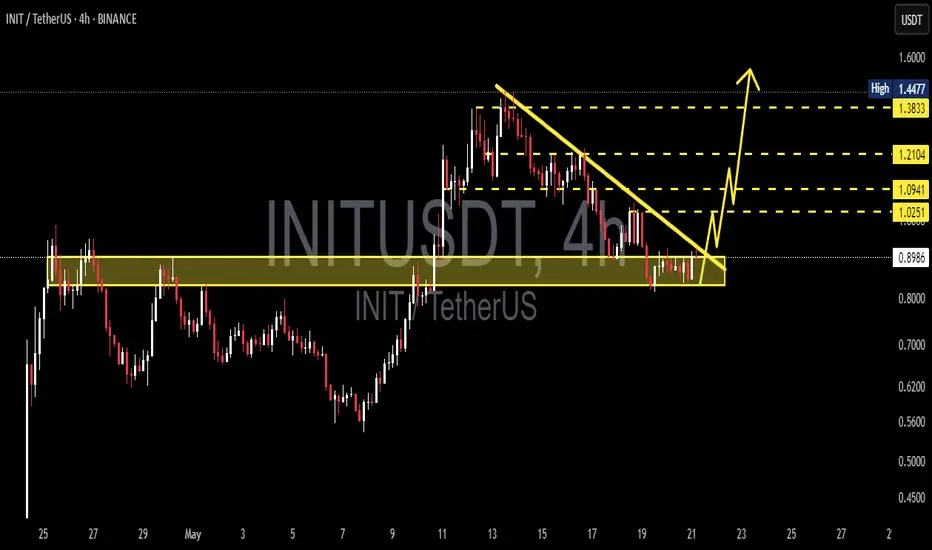
$INIT - Long Trade IdeaBINANCE:INITUSDT | 4h
Scaling into long here at cmp, dca around .72-.70
Stoploss: below .64
Targets:
.78-.82
.87-.94
$1 - 1.07

INIT SHORT RESULT Price is still in a major Falling channel as at when trade was executed and also in an overall bearish trend.
Was at the high of the resistance Trendline with low volume and price dumped down as expected.🔥👌
_THE_KLASSIC_TRADER_.

$INITUSDT Breakout AlertINIT just broke out of a falling wedge, a strong bullish signal.
Targeting a 58% move toward $1.4488.
Momentum looks solid. Watch for follow-through!
DYOR. Not financial advice.

INITUSDT 4H AnalysisINIT ~ 4H Analysis
#INIT This trade is very high risk
Buy gradually from here with a short-term target of at least 10%++ from here.
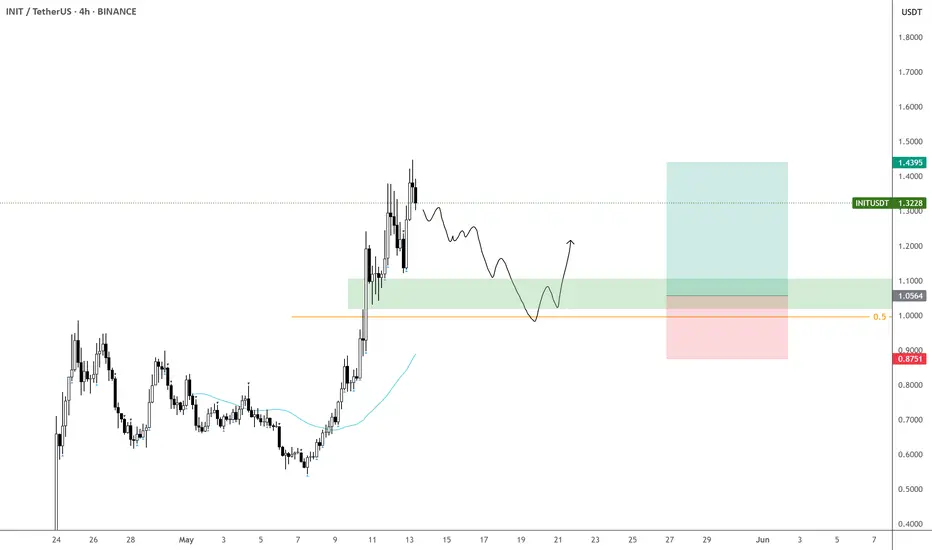
INIT – Missed the Move, Still Watching
Missed the entire move on INIT, but I still see a possible entry.
Will be waiting for prices closer to $1 in the coming weeks.
If it keeps pushing higher, I’ll just sit back and let it go. No chase here.
See all ideas
Summarizing what the indicators are suggesting.
Oscillators
Neutral
SellBuy
Strong sellStrong buy
Strong sellSellNeutralBuyStrong buy
Oscillators
Neutral
SellBuy
Strong sellStrong buy
Strong sellSellNeutralBuyStrong buy
Summary
Neutral
SellBuy
Strong sellStrong buy
Strong sellSellNeutralBuyStrong buy
Summary
Neutral
SellBuy
Strong sellStrong buy
Strong sellSellNeutralBuyStrong buy
Summary
Neutral
SellBuy
Strong sellStrong buy
Strong sellSellNeutralBuyStrong buy
Moving Averages
Neutral
SellBuy
Strong sellStrong buy
Strong sellSellNeutralBuyStrong buy
Moving Averages
Neutral
SellBuy
Strong sellStrong buy
Strong sellSellNeutralBuyStrong buy
Frequently Asked Questions
The current price of INIT / TetherUS (INIT) is 0.5139 USDT — it has risen 1.34% in the past 24 hours. Try placing this info into the context by checking out what coins are also gaining and losing at the moment and seeing INIT price chart.
INIT / TetherUS price has risen by 27.33% over the last week, its month performance shows a −0.43% decrease, and as for the last year, INIT / TetherUS has increased by 156.95%. See more dynamics on INIT price chart.
Keep track of coins' changes with our Crypto Coins Heatmap.
Keep track of coins' changes with our Crypto Coins Heatmap.
INIT / TetherUS (INIT) reached its highest price on May 13, 2025 — it amounted to 1.4477 USDT. Find more insights on the INIT price chart.
See the list of crypto gainers and choose what best fits your strategy.
See the list of crypto gainers and choose what best fits your strategy.
INIT / TetherUS (INIT) reached the lowest price of 0.2000 USDT on Apr 24, 2025. View more INIT / TetherUS dynamics on the price chart.
See the list of crypto losers to find unexpected opportunities.
See the list of crypto losers to find unexpected opportunities.
The safest choice when buying INIT is to go to a well-known crypto exchange. Some of the popular names are Binance, Coinbase, Kraken. But you'll have to find a reliable broker and create an account first. You can trade INIT right from TradingView charts — just choose a broker and connect to your account.
INIT / TetherUS (INIT) is just as reliable as any other crypto asset — this corner of the world market is highly volatile. Today, for instance, INIT / TetherUS is estimated as 4.84% volatile. The only thing it means is that you must prepare and examine all available information before making a decision. And if you're not sure about INIT / TetherUS, you can find more inspiration in our curated watchlists.
You can discuss INIT / TetherUS (INIT) with other users in our public chats, Minds or in the comments to Ideas.