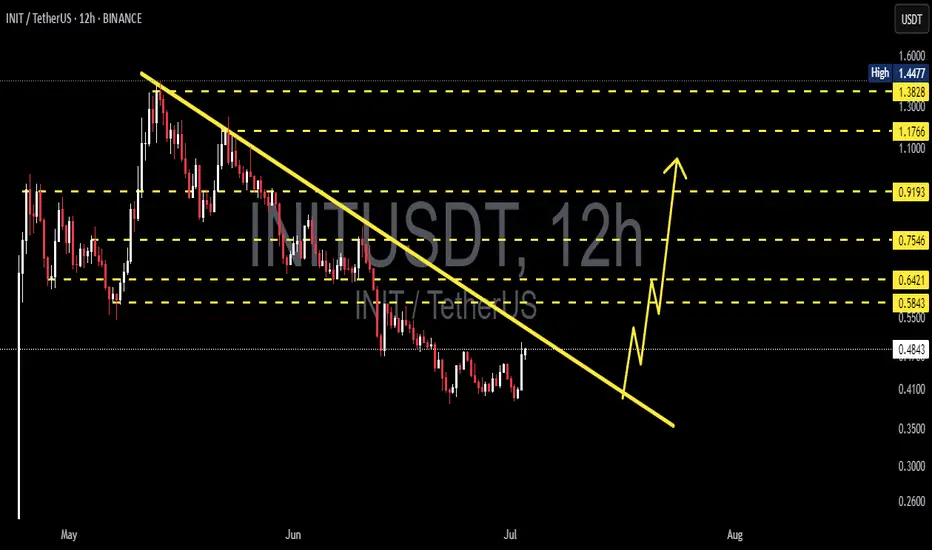
INIT/USDT Potential Bullish Reversal After Falling Wedge Break📊 Chart Pattern & Structure
Descending Trendline (Yellow Line): From early May to late June, INIT/USDT formed consistent lower highs and lower lows, creating a strong downtrend structure.
Accumulation Phase: In late June, the price consolidated around the $0.40 – $0.48 range, forming a base and is now attempting a breakout above the descending trendline.
Key Horizontal Resistance Levels (Yellow Dashed Lines):
$0.5843
$0.6421
$0.7546
$0.9193
$1.1766
$1.3828
🚀 Bullish Scenario
If INIT confirms a breakout above the descending trendline, it signals a potential trend reversal from bearish to bullish momentum.
📌 Short to Mid-Term Bullish Targets:
1. $0.5843 – Initial resistance.
2. $0.6421 – Previous support/resistance zone.
3. $0.7546 – Strong resistance with historical significance.
4. $0.9193 – $1.1766 – Mid-term upside targets.
5. $1.3828 – $1.4477 – Long-term target and previous high zone.
📈 Bullish Confirmation Signs:
Increased breakout volume.
Successful retest of the trendline as support.
🐻 Bearish Scenario
If the breakout fails and price falls back below the trendline:
⚠️ Possible Downside Risks:
Rejection back to the $0.4200 – $0.4800 range.
If $0.4200 breaks, price may retest deeper support around $0.3500 – $0.3000.
Breakdown below $0.3000 could lead to a move toward $0.2600 (historical demand).
📐 Pattern Analysis
Falling Wedge / Descending Channel: A typical bullish reversal pattern.
The breakout indicates accumulation and potential impulse movement to the upside.
Aligns with the beginning of a new Elliott Wave cycle (Wave 1 formation).
📝 Strategy Summary
Bullish Setup: Look for a pullback to retest the trendline for a potential long entry, targeting resistance levels step by step.
Bearish Setup: Watch out for a false breakout followed by a breakdown back below the trendline.
#INIT #INITUSDT #CryptoBreakout #FallingWedge #AltcoinAnalysis #TrendReversal #TechnicalAnalysis #CryptoTrading #BullishSetup #CryptoSignals #PriceAction
INITUSDT trade ideas
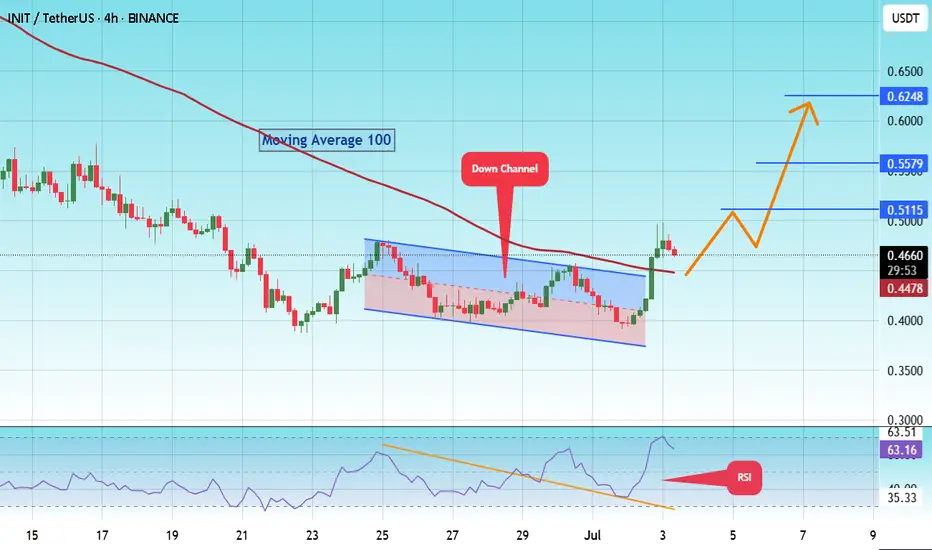
#INIT/USDT Potential Bullish Reversal After Down Channel Break #INIT
The price is moving within a descending channel on the 1-hour frame and is expected to break and continue upward.
We have a trend to stabilize above the 100 moving average once again.
We have a downtrend on the RSI indicator that supports the upward break.
We have a support area at the lower limit of the channel at 0.3800, acting as strong support from which the price can rebound.
Entry price: 0.4664
First target: 0.5115
Second target: 0.5579
Third target: 0.6248
To manage risk, don't forget stop loss and capital management.
When you reach the first target, save some profits and then change the stop order to an entry order.
For inquiries, please comment.
Thank you.
Init Bearish Entry recently experienced notable bearish momentum
actively interacting with critical liquidity and order flow areas.

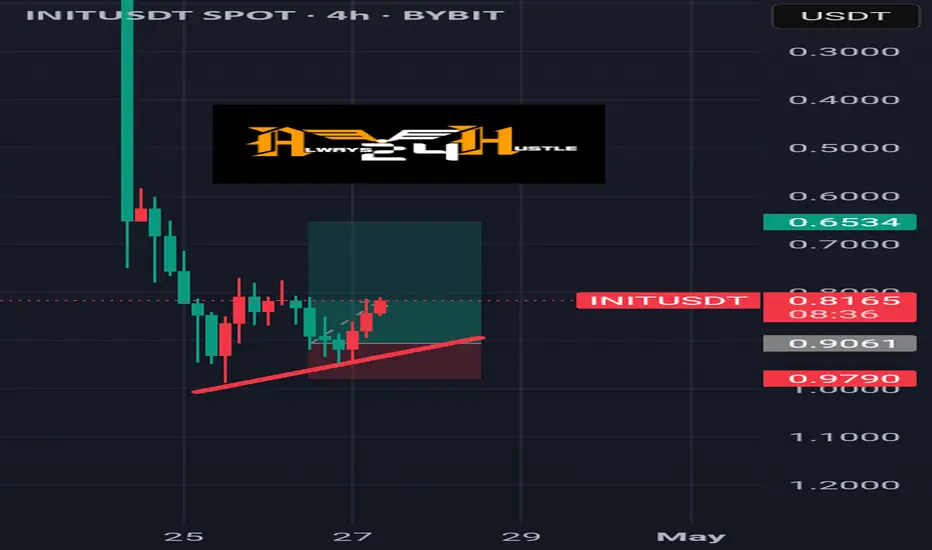
$INIT - Long Trade IdeaBINANCE:INITUSDT | 4h
Scaling into long here at cmp, dca around .72-.70
Stoploss: below .64
Targets:
.78-.82
.87-.94
$1 - 1.07

INIT SHORT RESULT Price is still in a major Falling channel as at when trade was executed and also in an overall bearish trend.
Was at the high of the resistance Trendline with low volume and price dumped down as expected.🔥👌
_THE_KLASSIC_TRADER_.

$INITUSDT Breakout AlertINIT just broke out of a falling wedge, a strong bullish signal.
Targeting a 58% move toward $1.4488.
Momentum looks solid. Watch for follow-through!
DYOR. Not financial advice.

INITUSDT 4H AnalysisINIT ~ 4H Analysis
#INIT This trade is very high risk
Buy gradually from here with a short-term target of at least 10%++ from here.
INIT – Missed the Move, Still Watching
Missed the entire move on INIT, but I still see a possible entry.
Will be waiting for prices closer to $1 in the coming weeks.
If it keeps pushing higher, I’ll just sit back and let it go. No chase here.

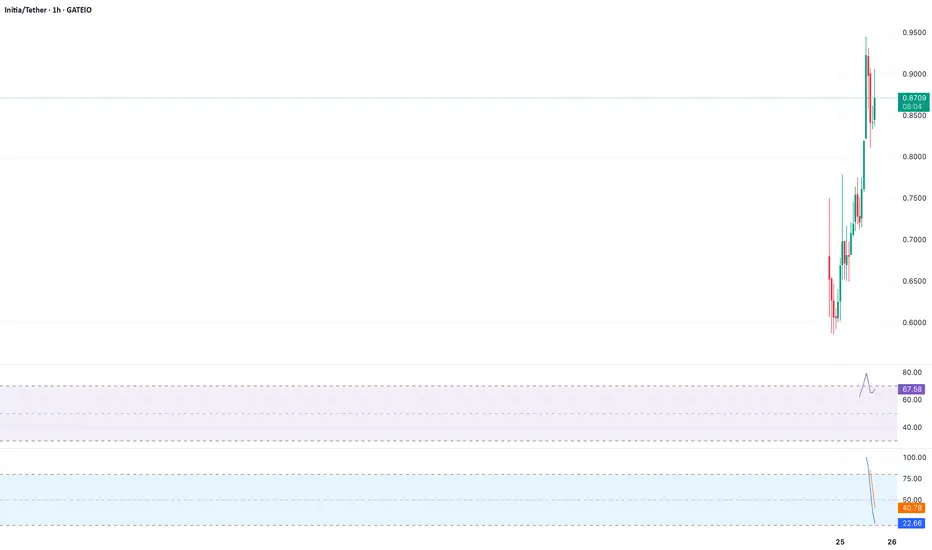
INIT – The New TIA? 🚀 INIT – The New TIA? 👀
OMXSTO:INIT just broke through key resistance and is now retesting the breakout zone with strength.
Current price: $1.31
Next major level: $1.58 📈
🧠 With a clean structure and explosive momentum, INIT is starting to look like the early days of TIA.
Could this be the next big thing in the altcoin space?
🔁 A healthy retest of the $1.00–$1.10 zone could offer one of the best R/R setups this cycle.
⚠️ Not financial advice, but definitely something to keep on your radar.
Init bullish gartley still in tactSpotted this bullish gartley on init. Had good reaction at the D leg. Still intact. As you can see it’s not totally perfect but is very close so should be a powerful harmonic structure.

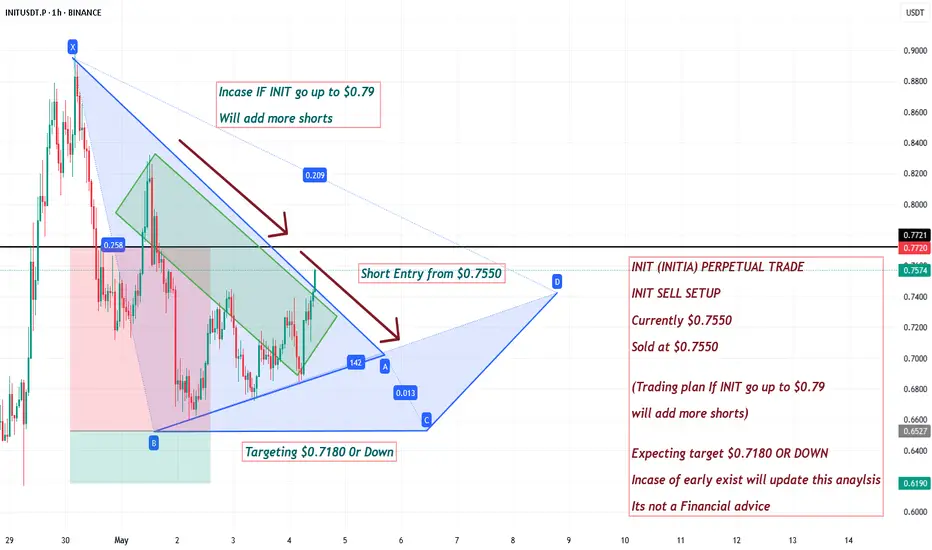
INIT (INITIA) PERPETUAL TRADE, Sold at $0.7550INIT (INITIA) PERPETUAL TRADE
INIT SELL SETUP
Currently $0.7550
,
Sold at $0.7550
(Trading plan If INIT go up to $0.79
will add more shorts)
Expecting target $0.7180 OR DOWN
Incase of early exist will update this anaylsis
Its not a Financial advice
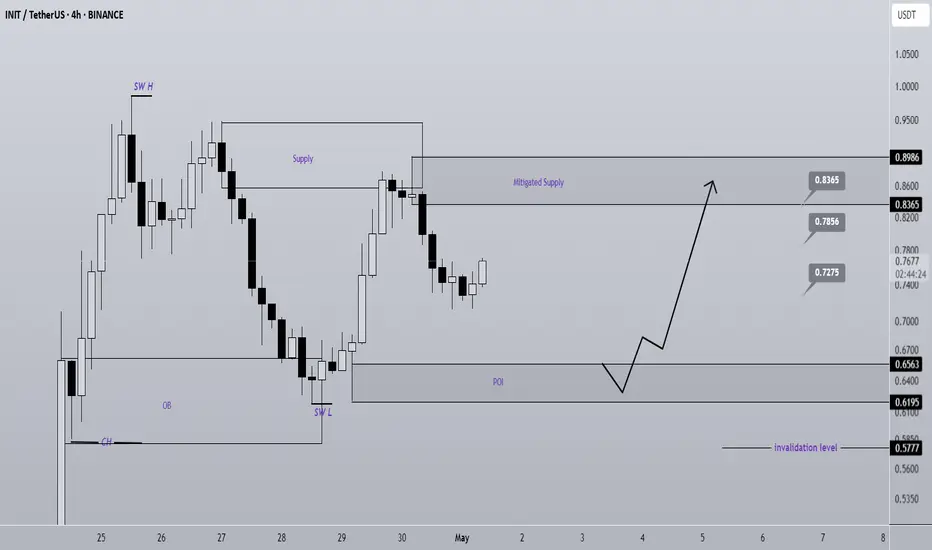
INIT buy/Long Setup (4H)On INIT chart we do not yet have a bearish CH on the chart, and within the substructure, we can look for potential buy/long positions.
There is an unmitigated POI zone, and once the price reaches this area, we can look for buy/long setups.
The targets are marked on the chart.
A daily candle close below the invalidation level will invalidate this analysis
Do not enter the position without capital management and stop setting
Comment if you have any questions
thank you

Get ready for big bull.It look like it is not time to buy INIT.
Look for good entry.
Use proper management.
Take small profit.
$INIT Bearish Trend ConfirmationAnalysis: OMXSTO:INIT is forming lower highs on the 4H chart, confirming a bearish trend below $0.85. The CCI is at -120, indicating oversold conditions, but no bullish reversal is visible. Short on a retest of $0.84, targeting $0.77, with a stop-loss at $0.86.
Key Levels: Resistance: $0.84, $0.86 | Support: $0.77, $0.73
Indicators: CCI (-120), Lower Highs Pattern

$INIT High Volatility Signals CorrectionAnalysis: OMXSTO:INIT ’s 24.5% daily range indicates extreme volatility, with the price at $0.85 showing no follow-through after a recovery. The 4H MACD is bearish, and the Parabolic SAR flipped above the price. Short at $0.85, targeting $0.78, with a stop-loss at $0.87.
Key Levels: Resistance: $0.85, $0.87 | Support: $0.78, $0.73
Indicators: MACD (Bearish), Parabolic SAR
$INIT Showing Weakness Below $0.85Analysis: OMXSTO:INIT ’s momentum is fading, with the price slipping below $0.85 and the 1H Bollinger Bands contracting, signaling low volatility before a drop. The ADX is weakening (20), showing no trend strength. Short at $0.84, targeting $0.79, with a stop-loss at $0.86.
Key Levels: Resistance: $0.85, $0.86 | Support: $0.79, $0.75
Indicators: Bollinger Bands (Contracting), ADX (20)
$INIT Bearish Setup on Resistance RejectionAnalysis: OMXSTO:INIT failed to break $0.85, forming a bearish pinbar on the 2H chart. The Stochastic RSI is dropping from overbought (85), and open interest is rising, indicating short pressure. Short at $0.84, targeting $0.80, with a stop-loss at $0.86.
Key Levels: Resistance: $0.85, $0.86 | Support: $0.80, $0.77
Indicators: Stochastic RSI (85), Pinbar Pattern

$INIT Testing Critical Support BreakdownAnalysis: OMXSTO:INIT is struggling to hold the $0.85 level, with a 4H chart showing a breakdown below the 20-day EMA ($0.84). The RSI is oversold at 23, but no reversal candle has formed. Short on a retest of $0.84, targeting $0.77, with a stop-loss at $0.86.
Key Levels: Resistance: $0.84, $0.86 | Support: $0.77, $0.73
Indicators: 20-day EMA ($0.84), RSI (23)

$INIT Risks Pullback After Volatile SpikeAnalysis: OMXSTO:INIT ’s 24H volume spiked to 673M, but the price failed to hold above $0.85, suggesting distribution. The 1H chart shows a bearish engulfing candle, and the MACD is crossing bearish. Short at $0.84, targeting $0.78, with a stop-loss at $0.87.
Key Levels: Resistance: $0.85, $0.87 | Support: $0.78, $0.75
Indicators: MACD (Bearish), Volume (High)

$INIT Overbought with Bearish DivergenceAnalysis: OMXSTO:INIT ’s rapid rise to $0.85 has pushed the 4H RSI to 75, indicating overbought conditions. A bearish divergence is visible, with lower RSI highs despite price peaks. The price is stalling below the 61.8% Fibonacci retracement ($0.86). Short at $0.85, aiming for $0.79, with a stop-loss at $0.88.
Key Levels: Resistance: $0.86, $0.88 | Support: $0.79, $0.75
Indicators: RSI (75, Divergence), Fibonacci (61.8%)
