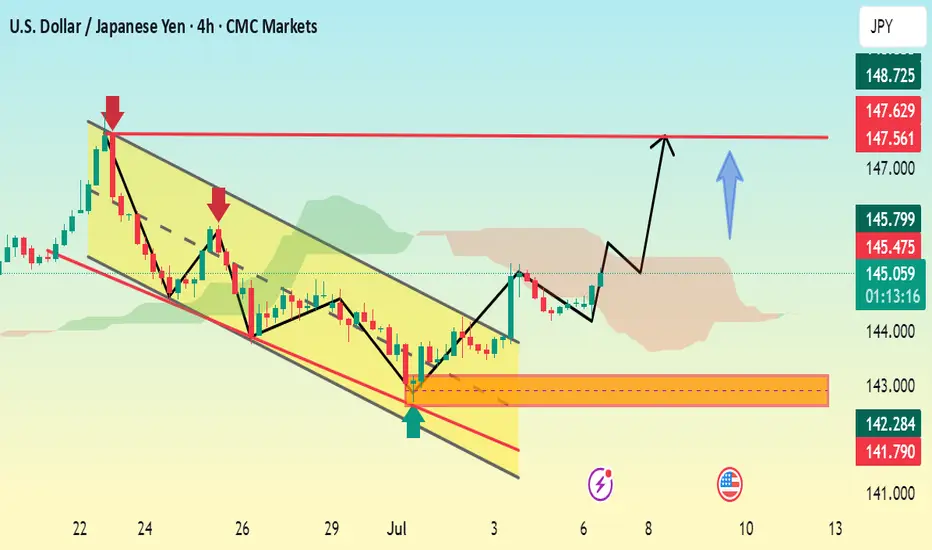
BULLISH H4 MOMENTUM ACTIVATED...?📊 Pattern & Structure:
The chart shows a downward channel (falling wedge) pattern that has recently been broken to the upside, indicating a bullish breakout.
The breakout is clean, with a sharp upward move, confirming the reversal from the bearish trend.
🔍 Key Levels Identified:
Support Zone:
Related currencies
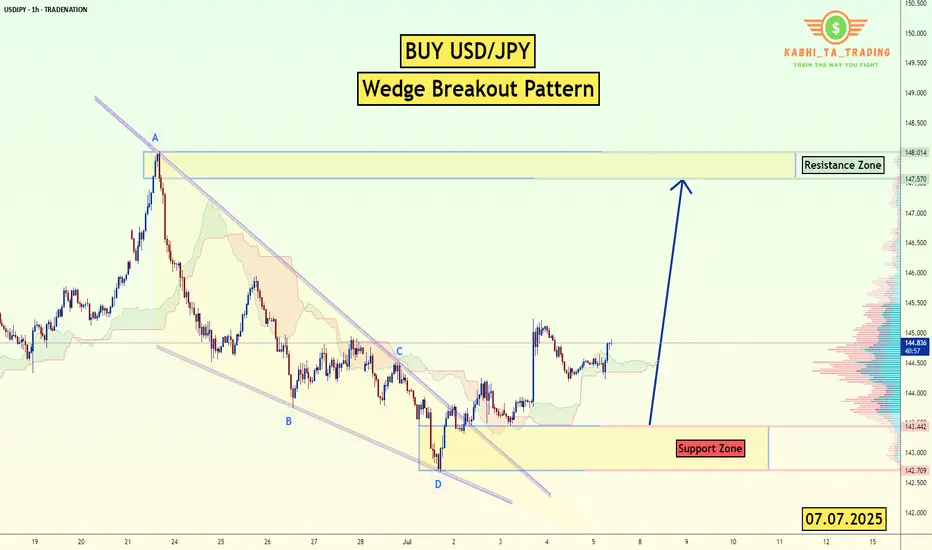
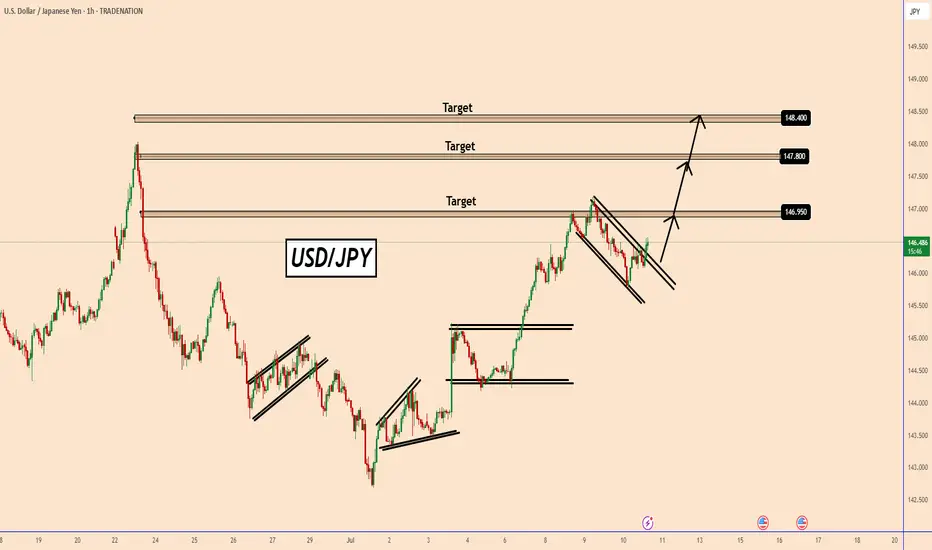
USD/JPY - H1- Wedge Breakout (07.07.2025)The USD/JPY pair on the H1 timeframe presents a Potential Buying Opportunity due to a recent Formation of a Wedge Breakout Pattern. This suggests a shift in momentum towards the upside and a higher likelihood of further advances in the coming hours.
Possible Long Trade:
Entry: Consider Entering A
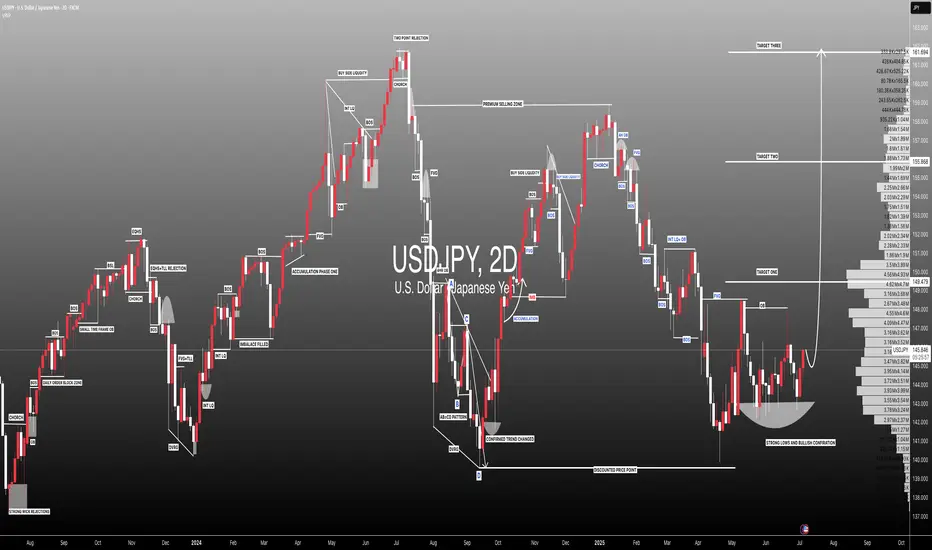
USDJPY Price Accumulated|Time For Bullish Distribution|Setupsfx|The price has accumulated nicely and is now distributing. We have three targets in mind, but set your own based on your analysis. Our approach is purely technical, but also includes a basic fundamental approach. This analysis concludes over 1500 pips and is a swing move. Please use this analysis as
USDJPY 30Min Engaged ( Bullish Entry Detected )➕ Objective: Precision Volume Execution
Time Frame: 30-Minute Warfare
Entry Protocol: Only after volume-verified breakout
🩸 Bullish Break : 145.100
➗ Hanzo Protocol: Volume-Tiered Entry Authority
➕ Zone Activated: Dynamic market pressure detected.
The level isn’t just price — it’s a memory of wh
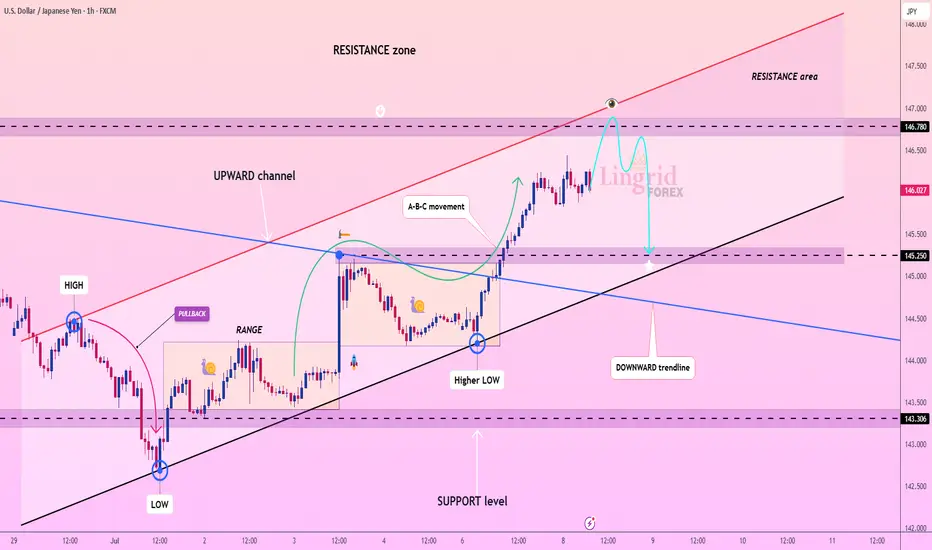
Lingrid | USDJPY Pullback From the Key Resistance ZoneThe price perfectly fulfilled my previous idea . FX:USDJPY is moving inside an upward channel after reclaiming support near 145.25 and breaking out from its previous range. The pair printed a higher low and is now approaching resistance around 146.78, testing the upper boundary of the ascending
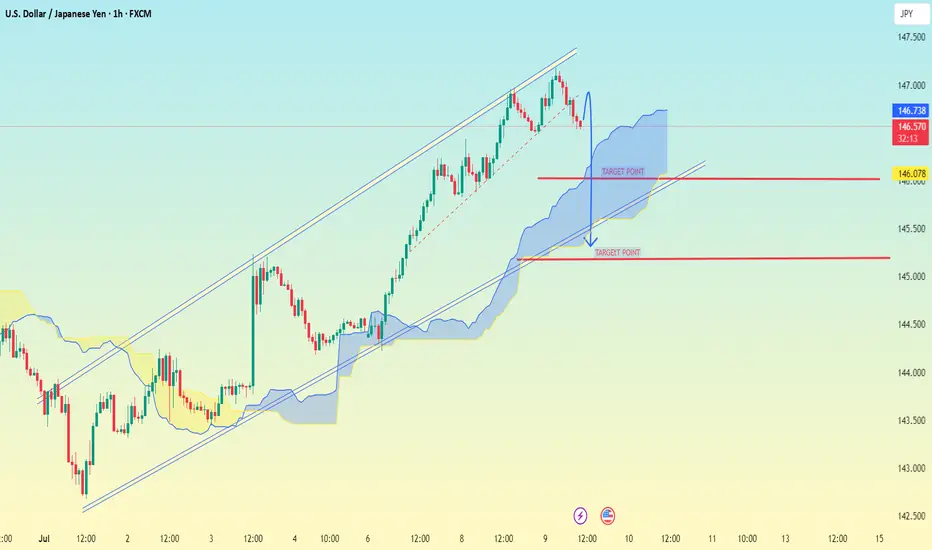
USD/JPY 1H chart PATTERNUSD/JPY 1H chart, the pair has broken below an ascending channel, which is typically a bearish signal. The price is currently inside the Ichimoku cloud, indicating uncertainty, but a breakdown seems likely.
📉 Bearish Target Points:
1. First Target:
✅ 146.078 — Near the bottom edge of the Ichimoku
USDJPY : More Upside Ahead?USDJPY : More Upside Ahead?
USDJPY remains firmly in a bullish trend, largely driven by renewed tariff concerns.
The yen weakened sharply after U.S. President Donald Trump reaffirmed plans to impose 25% tariffs on Japanese goods starting August 1st.
Since that announcement, USDJPY has rallied ne
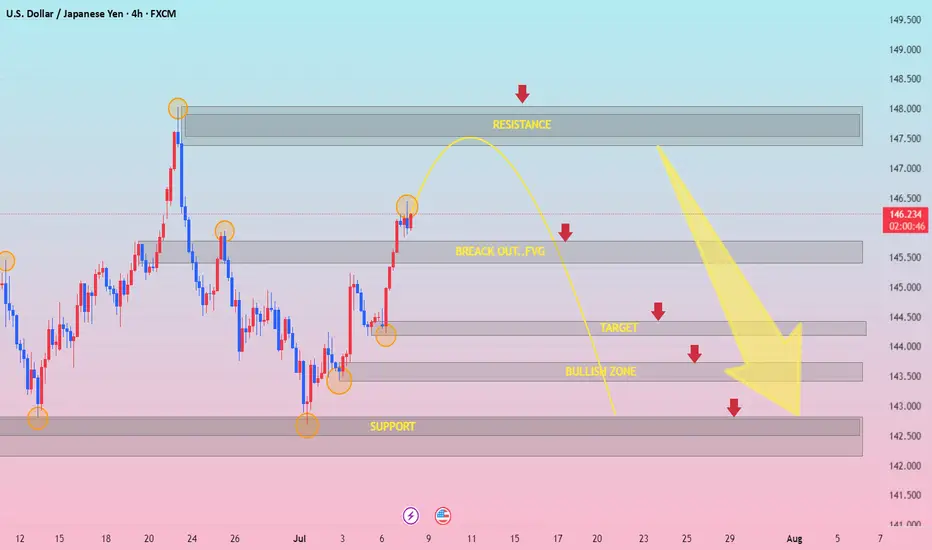
USDJPY h4 strongly downBearish Expectation Disruption / Bullish Counterpoint
Resistance (147.5) Rejection and drop Breakout and continuation toward 148.5+
Breakout FVG Fakeout and reversal True breakout — bullish trend continues
Bullish Zone (~144) Clean break below Accumulation zone, strong buying interest may emerge
Tar
10.07.25 Morning ForecastPairs on Watch -
FX:USDJPY (live position)
FX:EURNZD
FX:EURUSD
A short overview of the instruments I am looking at for today, multi-timeframe analysis down to what I will be looking at for an entry. Enjoy!

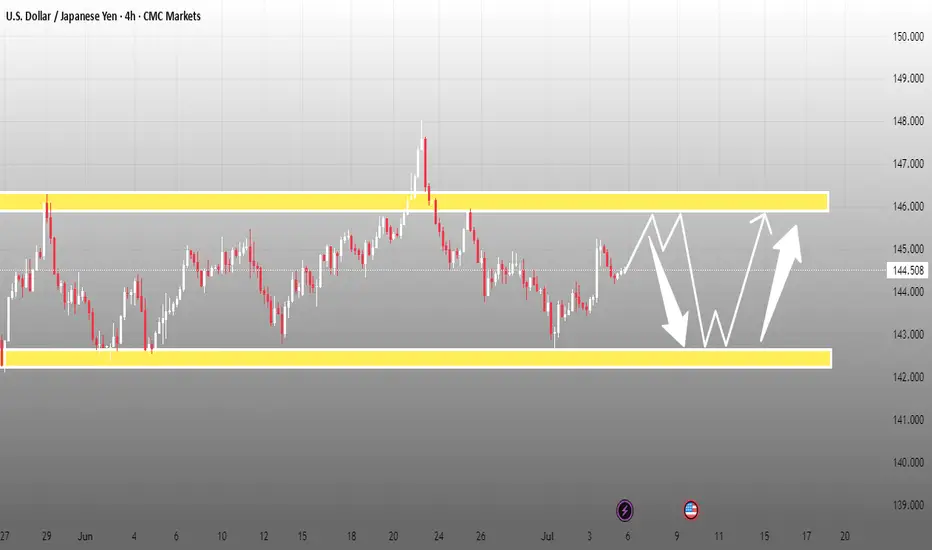
USD/JPY Range- weekly chart setupUSD/JPY abhi ek strong range-bound structure mein trade kar raha hai jisme clearly defined support aur resistance zones dikhai de rahe hain. Chart par price 144.50 ke aas paas consolidate kar raha hai, jahan se dono directions mein breakout ka potential bana hua hai.
📉 Resistance Zone: 145.80 – 146
See all ideas
Summarizing what the indicators are suggesting.
Oscillators
Neutral
SellBuy
Strong sellStrong buy
Strong sellSellNeutralBuyStrong buy
Oscillators
Neutral
SellBuy
Strong sellStrong buy
Strong sellSellNeutralBuyStrong buy
Summary
Neutral
SellBuy
Strong sellStrong buy
Strong sellSellNeutralBuyStrong buy
Summary
Neutral
SellBuy
Strong sellStrong buy
Strong sellSellNeutralBuyStrong buy
Summary
Neutral
SellBuy
Strong sellStrong buy
Strong sellSellNeutralBuyStrong buy
Moving Averages
Neutral
SellBuy
Strong sellStrong buy
Strong sellSellNeutralBuyStrong buy
Moving Averages
Neutral
SellBuy
Strong sellStrong buy
Strong sellSellNeutralBuyStrong buy
Displays a symbol's price movements over previous years to identify recurring trends.
Frequently Asked Questions
The current rate of JPYUSD is 0.0067928 USD — it has decreased by −0.80% in the past 24 hours. See more of JPYUSD rate dynamics on the detailed chart.
The value of the JPYUSD pair is quoted as 1 JPY per x USD. For example, if the pair is trading at 1.50, it means it takes 1.5 USD to buy 1 JPY.
The term volatility describes the risk related to the changes in an asset's value. JPYUSD has the volatility rating of 0.49%. Track all currencies' changes with our live Forex Heatmap and prepare for markets volatility.
The JPYUSD showed a −1.69% fall over the past week, the month change is a −1.92% fall, and over the last year it has increased by 7.94%. Track live rate changes on the JPYUSD chart.
Learn how you can make money on rate changes in numerous trading ideas created by our community.
Learn how you can make money on rate changes in numerous trading ideas created by our community.
JPYUSD is a major currency pair, i.e. a popular currency paired with USD.
Currencies are usually traded through forex brokers — choose the one that suits your needs and go ahead. You can trade JPYUSD right from TradingView charts — just log in to you broker account. Check out the list of our integrated brokers and find the best one for your needs and strategy.
When deciding to buy or sell currency one should keep in mind many factors including current geopolitical situation, interest rates, and other. But before plunging into a deep research, you can start with JPYUSD technical analysis. The technical rating for the pair is sell today, but don't forget that markets can be very unstable, so don't stop here. According to our 1 week rating the JPYUSD shows the neutral signal, and 1 month rating is sell. See more of JPYUSD technicals for a more comprehensive analysis.