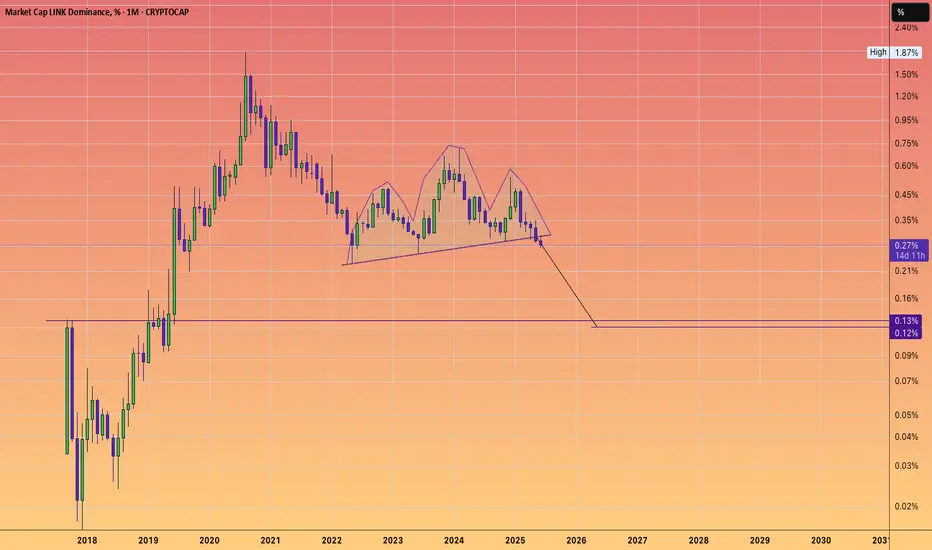
LINK MARINES are becoming a dwindling force.It was likely a fabricated tag solely for Crypto Twitter, conceived by early ICO investors. Something to rally a war cry behind.
Similar to the LINK Crypto dominance chart.
There’s a continuation head & shoulders pattern with a logarithmic target indicated.
Indeed, the token might increase in do
Key data points
Previous close
—
Open
—
Day's range
—
About Market Cap LINK Dominance, %
Coin
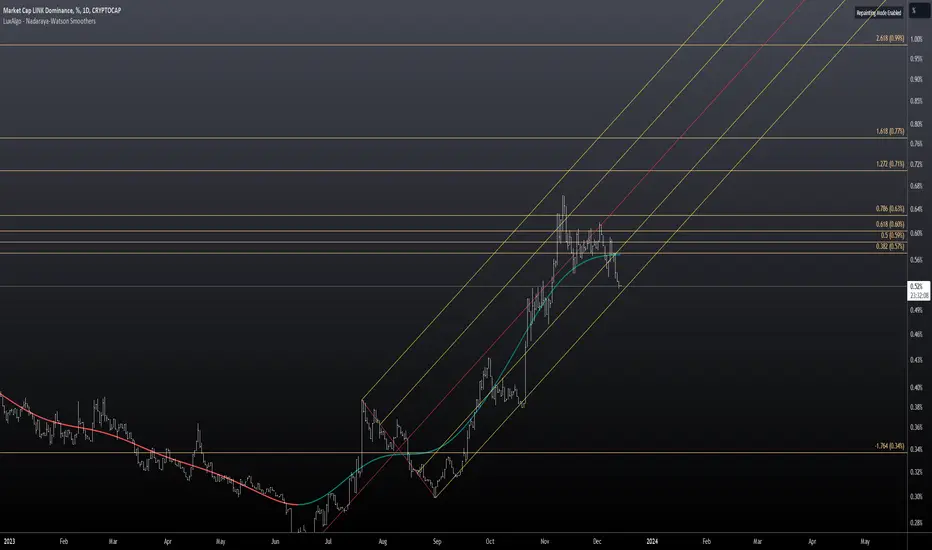
ChainLink Dominance is a thing of Beauty Look at this thing, it should catch here and when it breaks the downtrend it should really take off. Good things for Link in 2023-2024 I think.

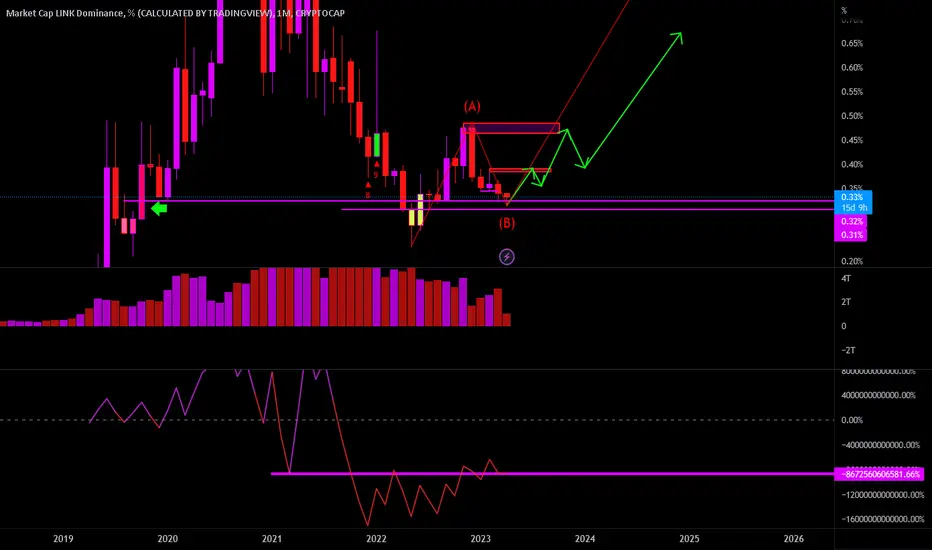
Link Dominance - I think it's time to flyI think this is a giant B pullback from the 2017 bottom, also a B pullback from May 2022, C wave to follow. So far this is a big monthly re-tested and it looks great on shorter-timeframes too.
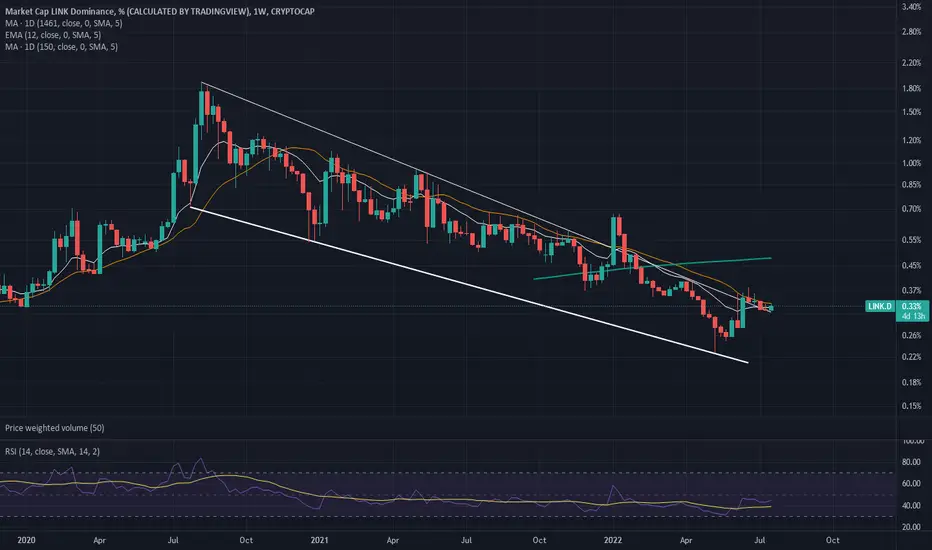
LINK Dominance - Breakout PotentialLINK positioned well for relative strength against bitcoin and major alts. Looking for some follow-through and ideally some support test at 150MA.
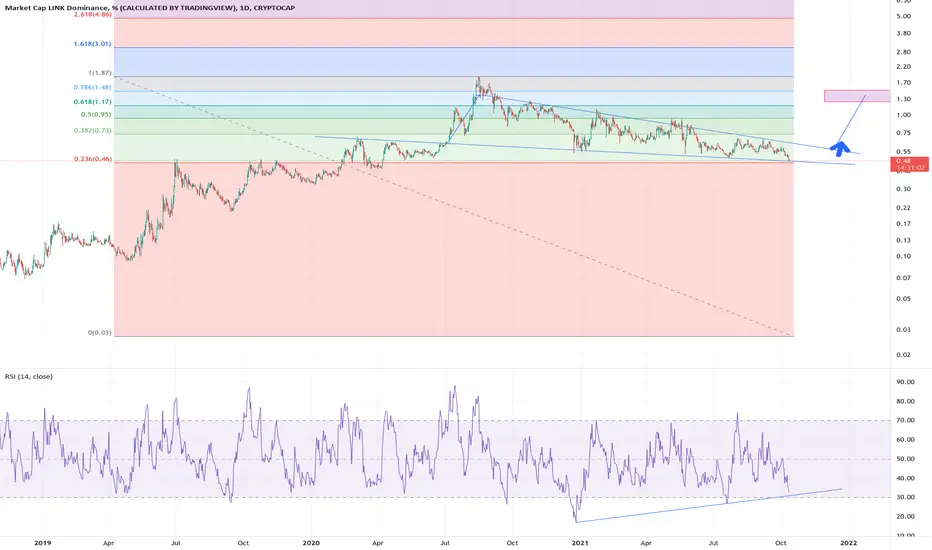
LINK 1 Year Trend LineLink on the Edge and this is dangerous for LINK Holders
Link.D drops to 0.47 and if that goes down to 0.4
Link Price could be drops to ~ 20$
But in best scenario, if LINK.D can break this trend line again like September 6th or Sep 16th
Link price Rise Above 35$ Again

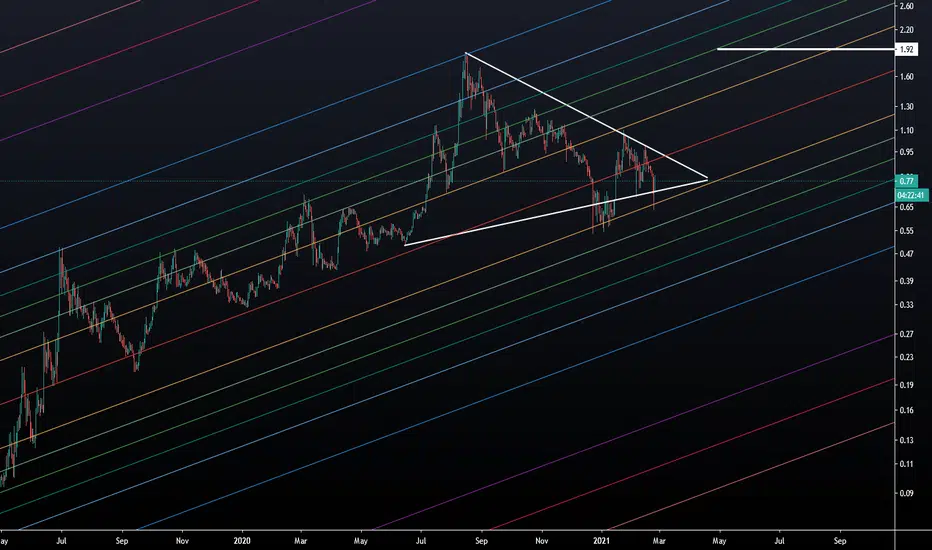
Chainlink analysis.... to look at the other charts Chainlink looks a lite bit confusing.
Against ETH and BTC is very undervalued. This is the only chart that makes sense. Falling wedge on a Dominance.
I think, that we are in a final squeeze for chainlink. Everybody speaks about how undervalued it is.
We see a clear
LINK- Marketcap dominance. New high commingIt's time for Link to outperform the market. Money will flow into Link.
Not financial advice. Just sharing my opinion

LINK.D in short term falling wedgeTruly I have no idea if charting dominance charts works, but I have been following LINK for a long time and the dominance has been growing exponentially for a few years. The link/btc chart is sort of trash at the moment, I’m not sure what will change the narrative. The fundamentals are solid, top 1%

LINK.DLots of people very disappointed in LINK, incl me ... But it will get there, months to come! Just hold and do nothing except buying more.
See all ideas
Summarizing what the indicators are suggesting.
Oscillators
Neutral
SellBuy
Strong sellStrong buy
Strong sellSellNeutralBuyStrong buy
Oscillators
Neutral
SellBuy
Strong sellStrong buy
Strong sellSellNeutralBuyStrong buy
Summary
Neutral
SellBuy
Strong sellStrong buy
Strong sellSellNeutralBuyStrong buy
Summary
Neutral
SellBuy
Strong sellStrong buy
Strong sellSellNeutralBuyStrong buy
Summary
Neutral
SellBuy
Strong sellStrong buy
Strong sellSellNeutralBuyStrong buy
Moving Averages
Neutral
SellBuy
Strong sellStrong buy
Strong sellSellNeutralBuyStrong buy
Moving Averages
Neutral
SellBuy
Strong sellStrong buy
Strong sellSellNeutralBuyStrong buy
Displays a symbol's price movements over previous years to identify recurring trends.