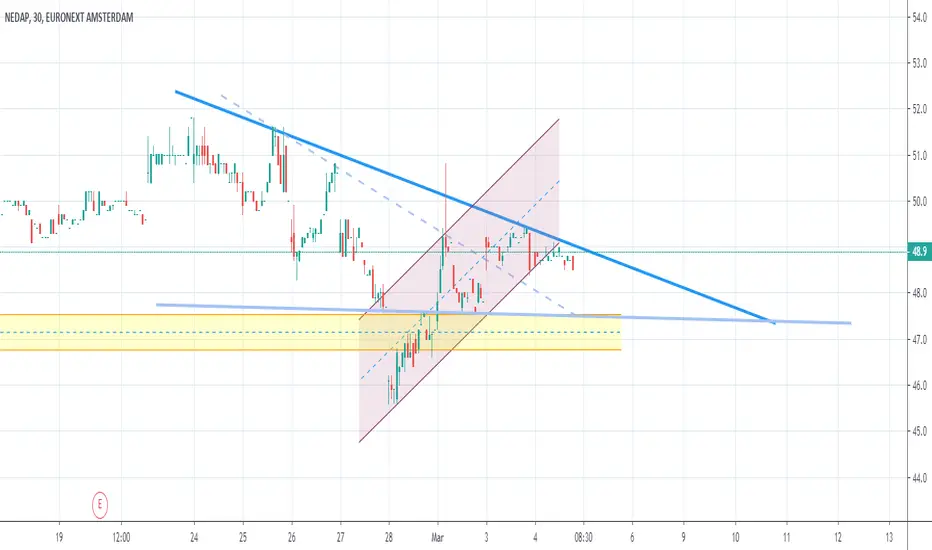
NEDAP Analysis 4-3-20EURONEXT:NEDAP
It looks as Nedap is continuing to follow the downtrend of the blue line. There is still heavy support at the yellow area, so if it continues to follow the downtrend it will go short till it hits the critical point of the yellow area of support which will shoot the stock back up.
Con
2.8 EUR
18.53 M EUR
251.61 M EUR
3.70 M
About NEDAP
Sector
Industry
CEO
Ruben M. Wegman
Website
Headquarters
Groenlo
Founded
1929
ISIN
NL0000371243
FIGI
BBG00JHW0179
Nedap NV engages in the development of smart applications of technology. It focuses on the following in-house business units: Identification Systems, Light Controls, Retail, Life Stock Management, Security Management, Staffing Solutions, and Healthcare. The company was founded on September 27, 1929 and is headquartered in Groenlo, the Netherlands.
Related stocks
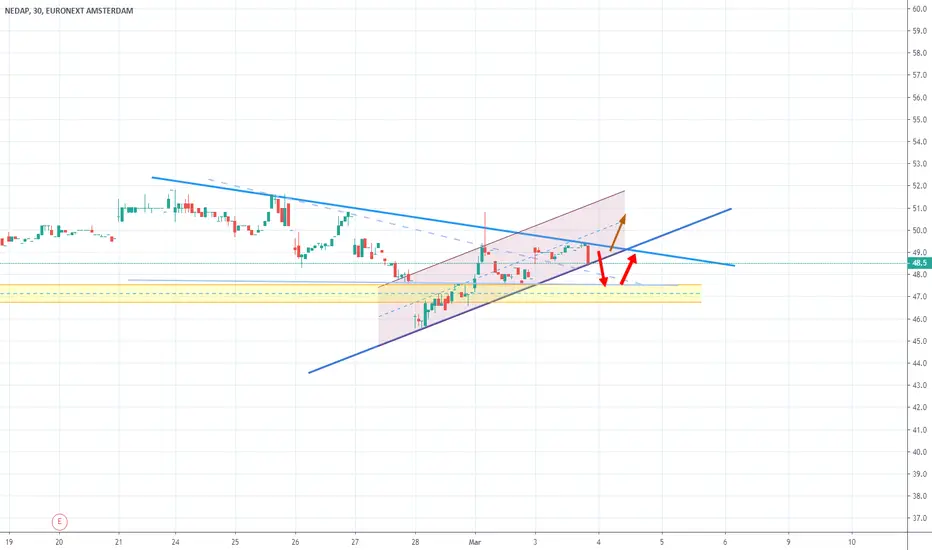
NEDAP AnalysisEURONEXT:NEDAP
The Nedap stock will be/is already being bounced back from the light blue resistance line. This will make the stock go down to (at least) the dark blue support line which will probably let it go through to the yellow support. If it hits the yellow support it will bounce back up and f
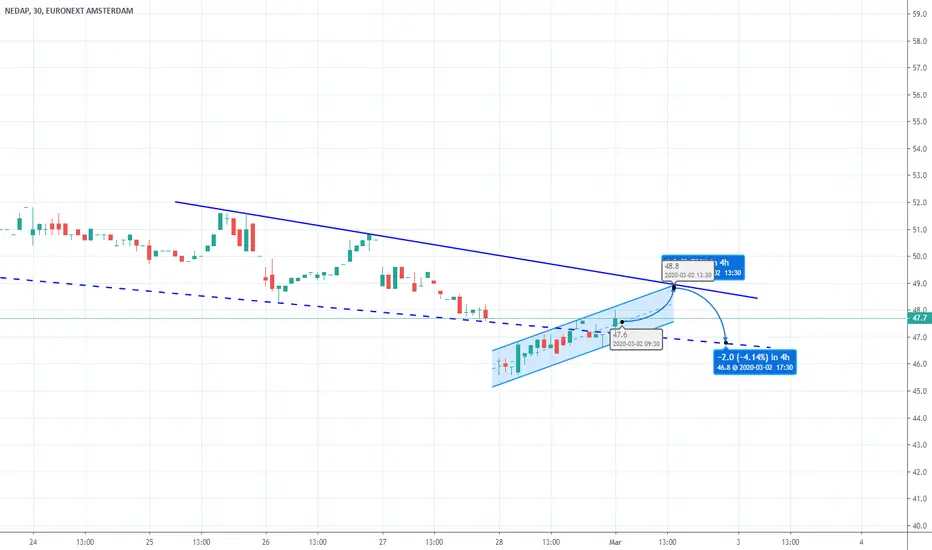
NEDAP AnalysisEURONEXT:NEDAP
Nedap will rise till the resistance line, the resistance line will keep it in the between the dark blue trend lines. It will continue to make it's way in between the trend lines and can break the support line if it breaks the 47. Hardest support resistance will be at 47.
See all ideas
Summarizing what the indicators are suggesting.
Oscillators
Neutral
SellBuy
Strong sellStrong buy
Strong sellSellNeutralBuyStrong buy
Oscillators
Neutral
SellBuy
Strong sellStrong buy
Strong sellSellNeutralBuyStrong buy
Summary
Neutral
SellBuy
Strong sellStrong buy
Strong sellSellNeutralBuyStrong buy
Summary
Neutral
SellBuy
Strong sellStrong buy
Strong sellSellNeutralBuyStrong buy
Summary
Neutral
SellBuy
Strong sellStrong buy
Strong sellSellNeutralBuyStrong buy
Moving Averages
Neutral
SellBuy
Strong sellStrong buy
Strong sellSellNeutralBuyStrong buy
Moving Averages
Neutral
SellBuy
Strong sellStrong buy
Strong sellSellNeutralBuyStrong buy
Displays a symbol's price movements over previous years to identify recurring trends.
Frequently Asked Questions
The current price of 0NNU is 71.9 EUR — it has decreased by −1.10% in the past 24 hours. Watch NEDAP(NEDERLANDSCHE APPARATENF)NV EUR0.10 stock price performance more closely on the chart.
Depending on the exchange, the stock ticker may vary. For instance, on LSE exchange NEDAP(NEDERLANDSCHE APPARATENF)NV EUR0.10 stocks are traded under the ticker 0NNU.
0NNU stock has risen by 1.84% compared to the previous week, the month change is a 14.86% rise, over the last year NEDAP(NEDERLANDSCHE APPARATENF)NV EUR0.10 has showed a 17.48% increase.
0NNU reached its all-time high on Jul 3, 2025 with the price of 73.0 EUR, and its all-time low was 32.4 EUR and was reached on Mar 19, 2020. View more price dynamics on 0NNU chart.
See other stocks reaching their highest and lowest prices.
See other stocks reaching their highest and lowest prices.
0NNU stock is 1.68% volatile and has beta coefficient of 0.81. Track NEDAP(NEDERLANDSCHE APPARATENF)NV EUR0.10 stock price on the chart and check out the list of the most volatile stocks — is NEDAP(NEDERLANDSCHE APPARATENF)NV EUR0.10 there?
Yes, you can track NEDAP(NEDERLANDSCHE APPARATENF)NV EUR0.10 financials in yearly and quarterly reports right on TradingView.
0NNU net income for the last half-year is 10.37 M EUR, while the previous report showed 8.16 M EUR of net income which accounts for 27.05% change. Track more NEDAP(NEDERLANDSCHE APPARATENF)NV EUR0.10 financial stats to get the full picture.
Yes, 0NNU dividends are paid annually. The last dividend per share was 3.20 EUR. As of today, Dividend Yield (TTM)% is 4.48%. Tracking NEDAP(NEDERLANDSCHE APPARATENF)NV EUR0.10 dividends might help you take more informed decisions.
NEDAP(NEDERLANDSCHE APPARATENF)NV EUR0.10 dividend yield was 5.82% in 2024, and payout ratio reached 113.67%. The year before the numbers were 5.00% and 96.80% correspondingly. See high-dividend stocks and find more opportunities for your portfolio.
As of Jul 7, 2025, the company has 999 employees. See our rating of the largest employees — is NEDAP(NEDERLANDSCHE APPARATENF)NV EUR0.10 on this list?
EBITDA measures a company's operating performance, its growth signifies an improvement in the efficiency of a company. NEDAP(NEDERLANDSCHE APPARATENF)NV EUR0.10 EBITDA is 34.63 M EUR, and current EBITDA margin is 13.66%. See more stats in NEDAP(NEDERLANDSCHE APPARATENF)NV EUR0.10 financial statements.
Like other stocks, 0NNU shares are traded on stock exchanges, e.g. Nasdaq, Nyse, Euronext, and the easiest way to buy them is through an online stock broker. To do this, you need to open an account and follow a broker's procedures, then start trading. You can trade NEDAP(NEDERLANDSCHE APPARATENF)NV EUR0.10 stock right from TradingView charts — choose your broker and connect to your account.
Investing in stocks requires a comprehensive research: you should carefully study all the available data, e.g. company's financials, related news, and its technical analysis. So NEDAP(NEDERLANDSCHE APPARATENF)NV EUR0.10 technincal analysis shows the buy rating today, and its 1 week rating is strong buy. Since market conditions are prone to changes, it's worth looking a bit further into the future — according to the 1 month rating NEDAP(NEDERLANDSCHE APPARATENF)NV EUR0.10 stock shows the strong buy signal. See more of NEDAP(NEDERLANDSCHE APPARATENF)NV EUR0.10 technicals for a more comprehensive analysis.
If you're still not sure, try looking for inspiration in our curated watchlists.
If you're still not sure, try looking for inspiration in our curated watchlists.