Next report date
—
Report period
—
EPS estimate
—
Revenue estimate
—
1.52 CAD
3.14 B CAD
54.28 B CAD
1.27 B
About CENOVUS ENERGY INC
Sector
Industry
CEO
Jonathan M. McKenzie
Website
Headquarters
Calgary
Founded
1881
FIGI
BBG00YRX7L27
Cenovus Energy, Inc. is a Canadian-based integrated energy company, which engages in the provision of gas and oil. It operates through the following segments: Upstream, Downstream, and Corporate and Eliminations. The Upstream segment refers to operations of oil sands, conventional, and offshore. The Downstream segment operates the Canadian and U.S. refining. The Corporate and Eliminations segment includes the corporates costs for general and administrative. The company was founded in 1881 and is headquartered in Calgary, Canada.
Related stocks
CVE BullishCVE energy
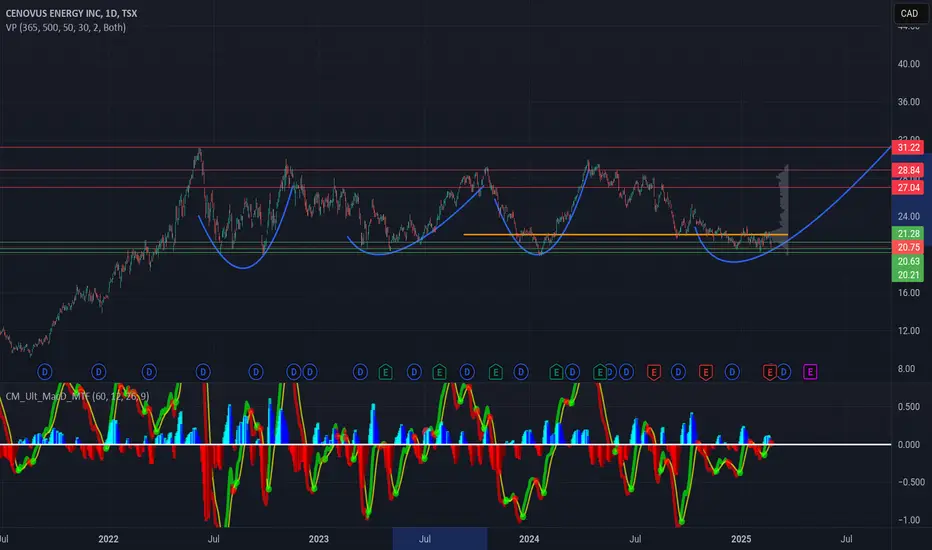
good buying opportunity
price undervalued and at both weekly and daily demand
seasonality coming to bullish
Trade Safe

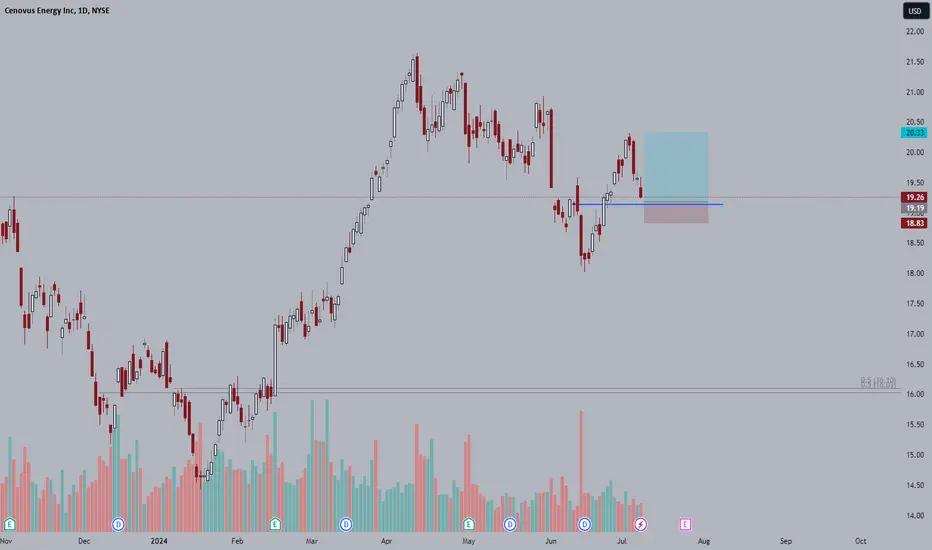
Cenovus Energy (CVE) 2h.Based on my analysis, Cenovus Energy (CVE) presents a solid buying opportunity.
A stop is set at 23.20 to manage risk, with a target price of 24.30, offering a favorable potential for gains

CVE - Clear Structural Changemanually stop with daily close under the line
I am an amateur trader. I sometimes enter into trades. Other times it is only an analysis. Trade with your own risk awareness.
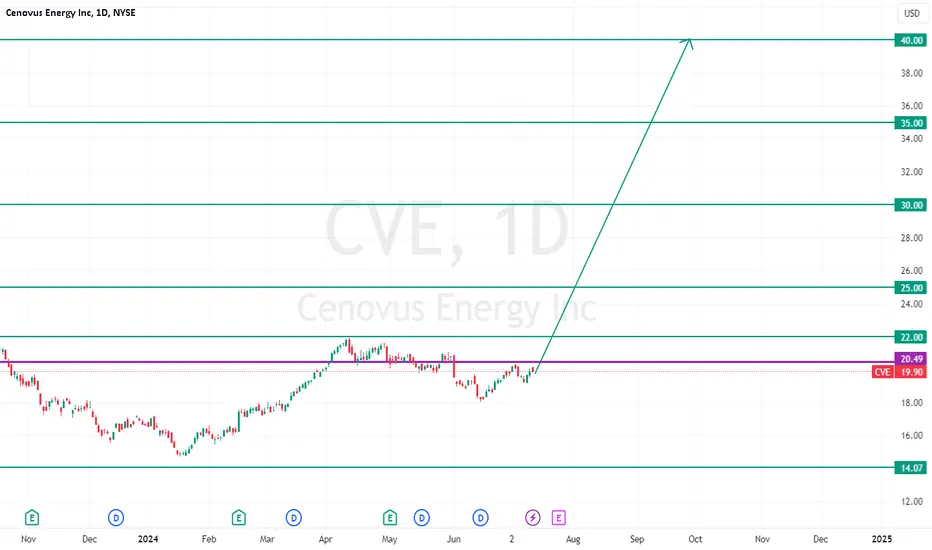
Cenovus Energy - Bullish Flag Pattern Formation in HT*Cenovus Energy CMP - $19.90*
Buy Range $19 - $20 ONLY
Target 1 - $25
Target 2 - $30
Target 3 - $35 / 40+
Disclaimer: This is my view and for educational purpose only.
CVE shortChart analysis leads me to believe that shorting CVE is a good option here. I would definitely buy the dip at around 1.40 - 1.60 though. We'll see what happens.

CVE BUYHi, according to my analysis. CVE stock. There is a very good buying opportunity as the stock has broken the downward trend. It also breached the sideways channel and the resistance at level 24. good luck for everbody

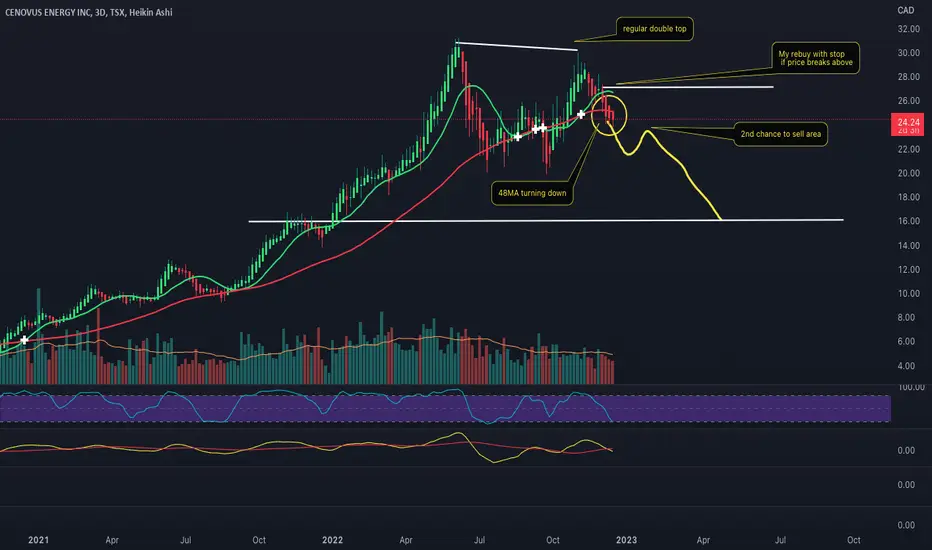
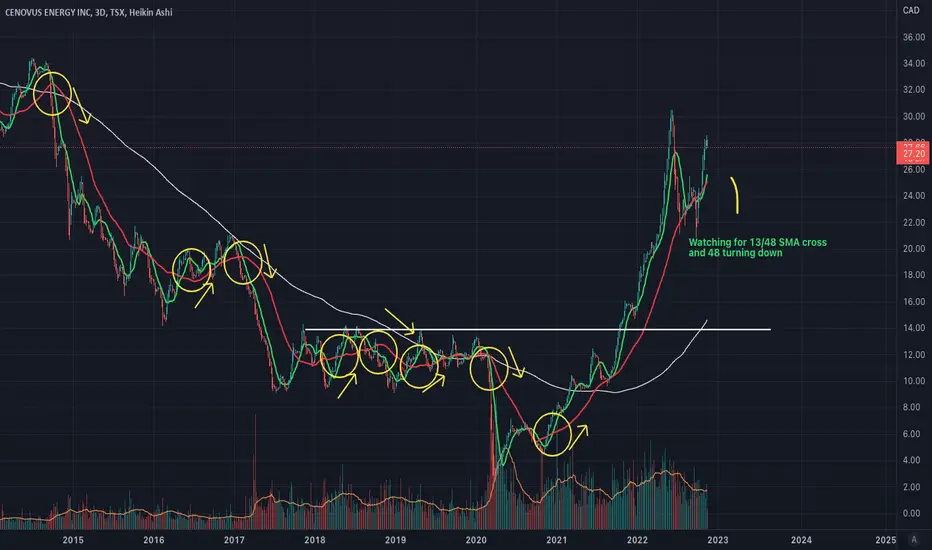
Cenovus Energy Inc. oilCVE stock on the 3Day time frame.
-Looks like a double top to me
-I am bearish to neutral on CVE
-48MA turning down, if the 13MA crosses also I'd be more bearish
-Highly dependant on Oil price but when main market sells off its a double wammy
None of this should be interpreted as financial advice
$CVE with a Bullish outlook following its earnings #Stocks The PEAD projected a Bullish outlook for $CVE after a Negative over reaction following its earnings release placing the stock in drift C with an expected accuracy of 100%.

Cenovus Energy INC.CVE price chart analysis on the 3Day time frame 2015-Current.
In line with my "Keep it simple stupid" philosophy, my trend analysis shows that when the 13 SMA crosses the 48 SMA, it is a notable occurrence, possibly indicating a change in trend upcoming. My buy or sell decision occurs when the red
See all ideas
Summarizing what the indicators are suggesting.
Oscillators
Neutral
SellBuy
Strong sellStrong buy
Strong sellSellNeutralBuyStrong buy
Oscillators
Neutral
SellBuy
Strong sellStrong buy
Strong sellSellNeutralBuyStrong buy
Summary
Neutral
SellBuy
Strong sellStrong buy
Strong sellSellNeutralBuyStrong buy
Summary
Neutral
SellBuy
Strong sellStrong buy
Strong sellSellNeutralBuyStrong buy
Summary
Neutral
SellBuy
Strong sellStrong buy
Strong sellSellNeutralBuyStrong buy
Moving Averages
Neutral
SellBuy
Strong sellStrong buy
Strong sellSellNeutralBuyStrong buy
Moving Averages
Neutral
SellBuy
Strong sellStrong buy
Strong sellSellNeutralBuyStrong buy
Displays a symbol's price movements over previous years to identify recurring trends.
CVE5256459
Cenovus Energy Inc. 3.75% 15-FEB-2052Yield to maturity
7.45%
Maturity date
Feb 15, 2052
CVE3889915
Cenovus Energy Inc. 4.45% 15-SEP-2042Yield to maturity
6.78%
Maturity date
Sep 15, 2042
CVE4040157
Cenovus Energy Inc. 5.2% 15-SEP-2043Yield to maturity
6.75%
Maturity date
Sep 15, 2043
CVE4481643
Cenovus Energy Inc. 5.4% 15-JUN-2047Yield to maturity
6.72%
Maturity date
Jun 15, 2047
CVE3671605
Husky Energy Inc. 6.8% 15-SEP-2037Yield to maturity
5.95%
Maturity date
Sep 15, 2037
CVE3683666
Cenovus Energy Inc. 6.75% 15-NOV-2039Yield to maturity
5.90%
Maturity date
Nov 15, 2039
CVE4481642
Cenovus Energy Inc. 5.25% 15-JUN-2037Yield to maturity
5.88%
Maturity date
Jun 15, 2037
CVE5256458
Cenovus Energy Inc. 2.65% 15-JAN-2032Yield to maturity
5.49%
Maturity date
Jan 15, 2032
CVE4481632
Cenovus Energy Inc. 4.25% 15-APR-2027Yield to maturity
5.24%
Maturity date
Apr 15, 2027
CVE4808752
Cenovus Energy Inc. 4.4% 15-APR-2029Yield to maturity
4.67%
Maturity date
Apr 15, 2029
CVE4481641
Cenovus Energy Inc. 4.25% 15-APR-2027Yield to maturity
4.58%
Maturity date
Apr 15, 2027
See all CVE.PR.A bonds
Frequently Asked Questions
The current price of CVE.PR.A is 23.61 CAD — it has increased by 0.30% in the past 24 hours. Watch CVECN F PERP 1 stock price performance more closely on the chart.
Depending on the exchange, the stock ticker may vary. For instance, on NEO exchange CVECN F PERP 1 stocks are traded under the ticker CVE.PR.A.
CVE.PR.A stock has fallen by −0.59% compared to the previous week, the month change is a 0.47% rise, over the last year CVECN F PERP 1 has showed a 39.29% increase.
CVE.PR.A reached its all-time high on Jun 10, 2025 with the price of 24.01 CAD, and its all-time low was 4.14 CAD and was reached on Mar 19, 2020. View more price dynamics on CVE.PR.A chart.
See other stocks reaching their highest and lowest prices.
See other stocks reaching their highest and lowest prices.
CVE.PR.A stock is 0.30% volatile and has beta coefficient of 1.81. Track CVECN F PERP 1 stock price on the chart and check out the list of the most volatile stocks — is CVECN F PERP 1 there?
Today CVECN F PERP 1 has the market capitalization of 33.92 B, it has increased by 1.06% over the last week.
Yes, you can track CVECN F PERP 1 financials in yearly and quarterly reports right on TradingView.
CVECN F PERP 1 is going to release the next earnings report on Jul 24, 2025. Keep track of upcoming events with our Earnings Calendar.
CVE.PR.A earnings for the last quarter are 0.47 CAD per share, whereas the estimation was 0.39 CAD resulting in a 20.45% surprise. The estimated earnings for the next quarter are 0.22 CAD per share. See more details about CVECN F PERP 1 earnings.
CVECN F PERP 1 revenue for the last quarter amounts to 16.05 B CAD, despite the estimated figure of 14.03 B CAD. In the next quarter, revenue is expected to reach 12.89 B CAD.
CVE.PR.A net income for the last quarter is 859.00 M CAD, while the quarter before that showed 146.00 M CAD of net income which accounts for 488.36% change. Track more CVECN F PERP 1 financial stats to get the full picture.
Yes, CVE.PR.A dividends are paid quarterly. The last dividend per share was 0.16 CAD. As of today, Dividend Yield (TTM)% is 3.85%. Tracking CVECN F PERP 1 dividends might help you take more informed decisions.
CVECN F PERP 1 dividend yield was 3.12% in 2024, and payout ratio reached 40.51%. The year before the numbers were 2.38% and 24.43% correspondingly. See high-dividend stocks and find more opportunities for your portfolio.
As of Jun 29, 2025, the company has 7.15 K employees. See our rating of the largest employees — is CVECN F PERP 1 on this list?
EBITDA measures a company's operating performance, its growth signifies an improvement in the efficiency of a company. CVECN F PERP 1 EBITDA is 9.65 B CAD, and current EBITDA margin is 18.30%. See more stats in CVECN F PERP 1 financial statements.
Like other stocks, CVE.PR.A shares are traded on stock exchanges, e.g. Nasdaq, Nyse, Euronext, and the easiest way to buy them is through an online stock broker. To do this, you need to open an account and follow a broker's procedures, then start trading. You can trade CVECN F PERP 1 stock right from TradingView charts — choose your broker and connect to your account.
Investing in stocks requires a comprehensive research: you should carefully study all the available data, e.g. company's financials, related news, and its technical analysis. So CVECN F PERP 1 technincal analysis shows the buy rating today, and its 1 week rating is buy. Since market conditions are prone to changes, it's worth looking a bit further into the future — according to the 1 month rating CVECN F PERP 1 stock shows the buy signal. See more of CVECN F PERP 1 technicals for a more comprehensive analysis.
If you're still not sure, try looking for inspiration in our curated watchlists.
If you're still not sure, try looking for inspiration in our curated watchlists.