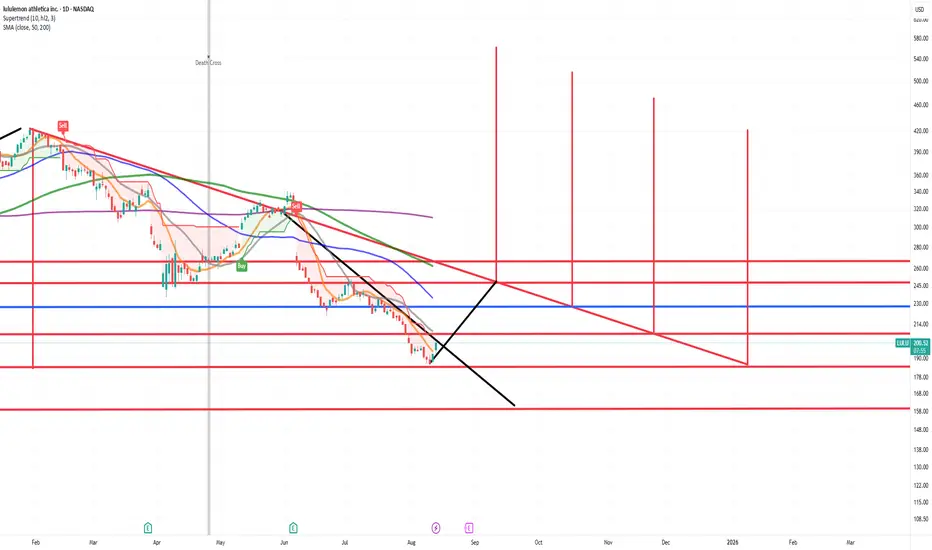
LULU to $337I'm personally not a buyer of LULU, but if anyone else is interested, this is exactly the area to buy. It's also a good trade for a relatively quick move back over $200.
Should move pretty easily back up to $337 resistance.
Good luck!
0.68 CAD
2.50 B CAD
14.59 B CAD
About lululemon athletica
Sector
Industry
CEO
Calvin R. McDonald
Website
Headquarters
Vancouver
Founded
1998
FIGI
BBG01LGQ0VG1
lululemon athletica, Inc. engages in the business of designing, distributing, and retailing technical athletic apparel, footwear, and accessories. It operates through the following segments: Company-Operated Stores, Direct to Consumer, and Other. The company was founded by Dennis James Wilson in 1998 and is headquartered in Vancouver, Canada.
Related stocks

LULU - Updated analysis and what to look out forWe have a pretty clear HTF zone to look out for below - $130-$160 - in which we will need to see how price holds up. I cannot imagine a drop below there - that would make this completely undervalued - and I will be looking for long trades when we arrive there and see the LTF algorithms playing out.

BUY NOW $LULU EASY MONEYRSI (14) 39.15
P/E 13.65 as of 08/13/2025
Buy now and you will thank me later.
This is super sale
Head and Shoulders PatternLululemon’s chart looks extremely bearish. It’s make or break for this stock. A breakdown of its current support would confirm the break of the neckline in a Head and Shoulders pattern. The 1:1 extension of the move could send the stock price down another 50%, towards $130. Yikes!
The 5 Wave superc

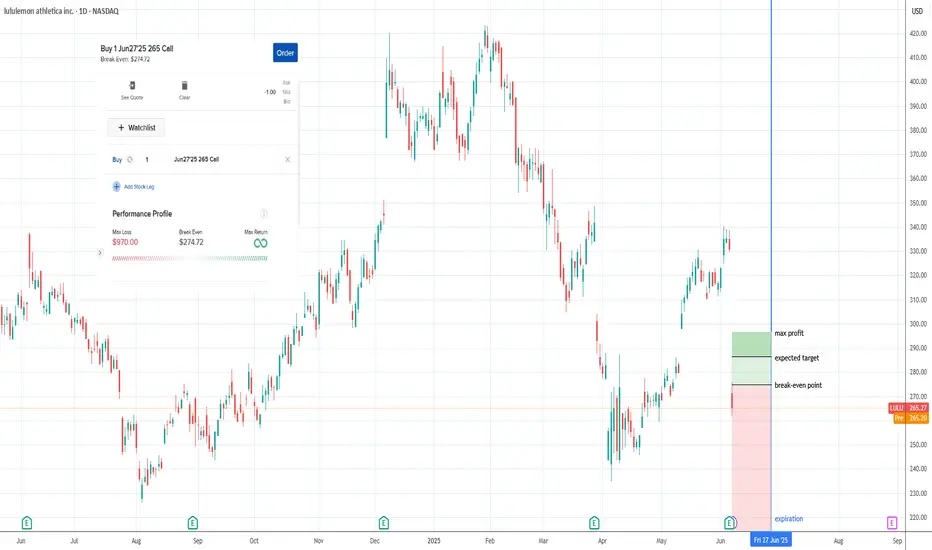
Yoga Pants, Tariffs, and Upside: The $LULU BetLululemon NASDAQ:LULU - My Investment Thesis 👖
Hey team,
I've been keeping an eye on NASDAQ:LULU for a while, and I'm finally going to pull the trigger.
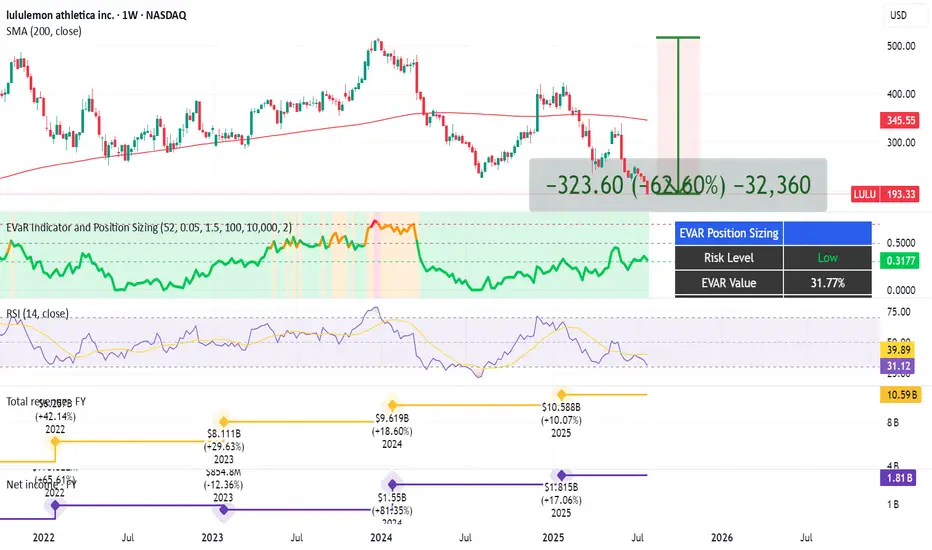
In this market of overhyped MAG 7 stocks, Lululemon dropped 62% since its high in Dec. 2023 until now.
Here's why I'm into LULU:
Revenu
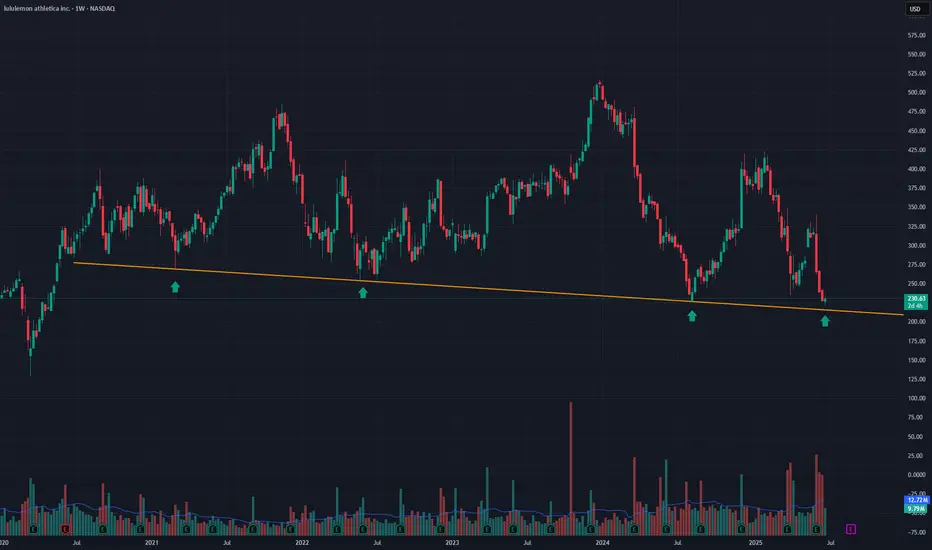
LULU into supportLulu is on sale as its just come into an area it has only sold at, 3 other times out of the past 5 years. As you can see by the Orange line, LULU has been holding this area of support for the past 5 years. This is a great buying opportunity. A close below the line on a weekly basis would stop out of
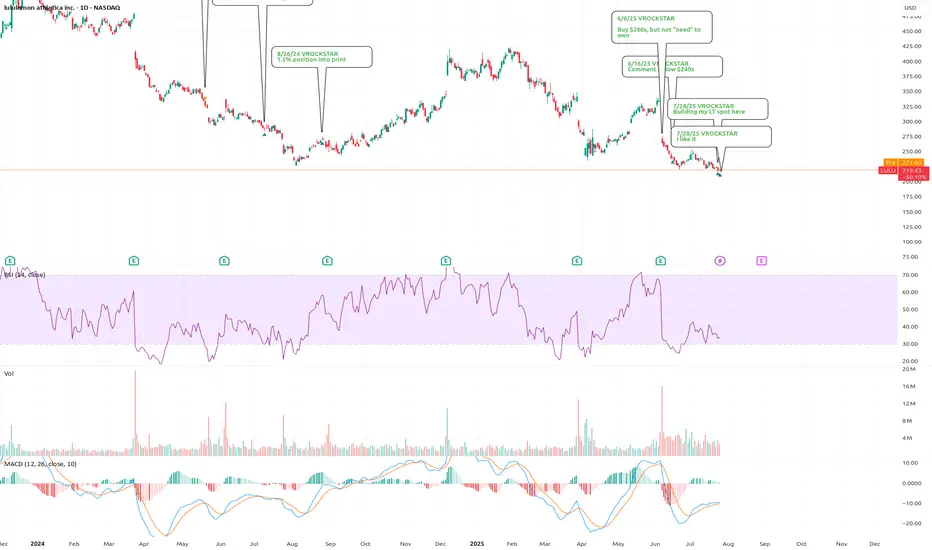
7/28/25 - $lulu - and goodbye7/28/25 :: VROCKSTAR :: NASDAQ:LULU
I like it
Apparently i can't post my thoughts anymore w/o it being flagged. so what's the point?
And i don't play stupid games and win stupid prizes... so goodbye public notes. ez decision.
Also... purely technical analysis will go the way of AI. So beware. Lea
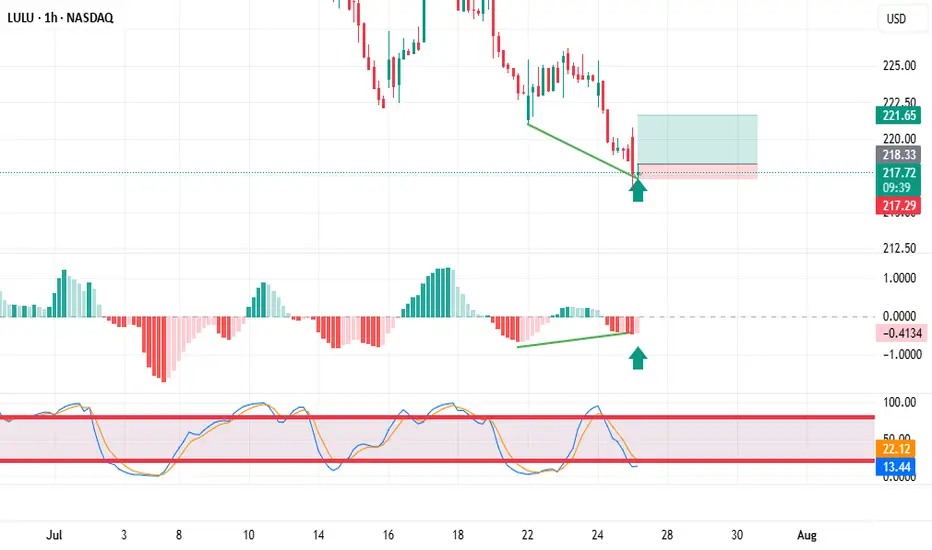
Trading stocks using Dr. Elder's "Three Screen Method"The first thing I do is check the weekly chart. Here I see excellent price divergence relative to the MACD indicator
Then I switched to the daily chart and saw the same excellent divergence as on the weekly chart.
The hourly chart also showed excellent divergence. placed a pending buy order
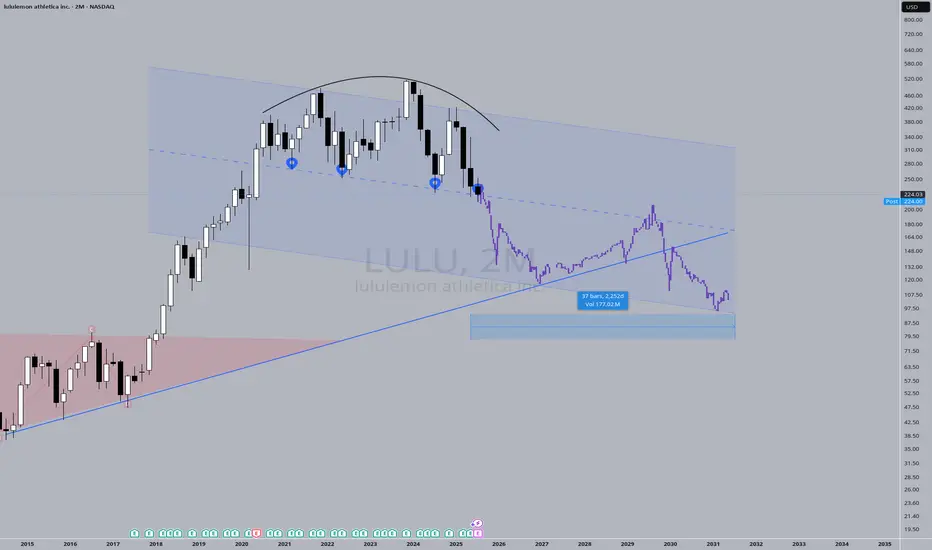
Mega-ultra macro LULU takePrice action has "knocked" on the support door FOUR times. It's got to give sometime soon. Fashion brands come and go, I think LULU has had it's time to shine, now it's time for another brand to emerge and take its place.
I say "Mega-ultra macro" to recognize the absurdity of a 6-year guess. The pr
Going to HonoLULULululemon shares fell almost 20% after the company warned tariffs and consumer caution would hurt profits.
Here are some of my bold statements about this:
Tariffs are sector-wide, not Lululemon-specific
Nearly all premium athletic and apparel brands—Nike, Adidas, Under Armour, VF Corp (The
See all ideas
Summarizing what the indicators are suggesting.
Oscillators
Neutral
SellBuy
Strong sellStrong buy
Strong sellSellNeutralBuyStrong buy
Oscillators
Neutral
SellBuy
Strong sellStrong buy
Strong sellSellNeutralBuyStrong buy
Summary
Neutral
SellBuy
Strong sellStrong buy
Strong sellSellNeutralBuyStrong buy
Summary
Neutral
SellBuy
Strong sellStrong buy
Strong sellSellNeutralBuyStrong buy
Summary
Neutral
SellBuy
Strong sellStrong buy
Strong sellSellNeutralBuyStrong buy
Moving Averages
Neutral
SellBuy
Strong sellStrong buy
Strong sellSellNeutralBuyStrong buy
Moving Averages
Neutral
SellBuy
Strong sellStrong buy
Strong sellSellNeutralBuyStrong buy
Displays a symbol's price movements over previous years to identify recurring trends.
Curated watchlists where LULU is featured.