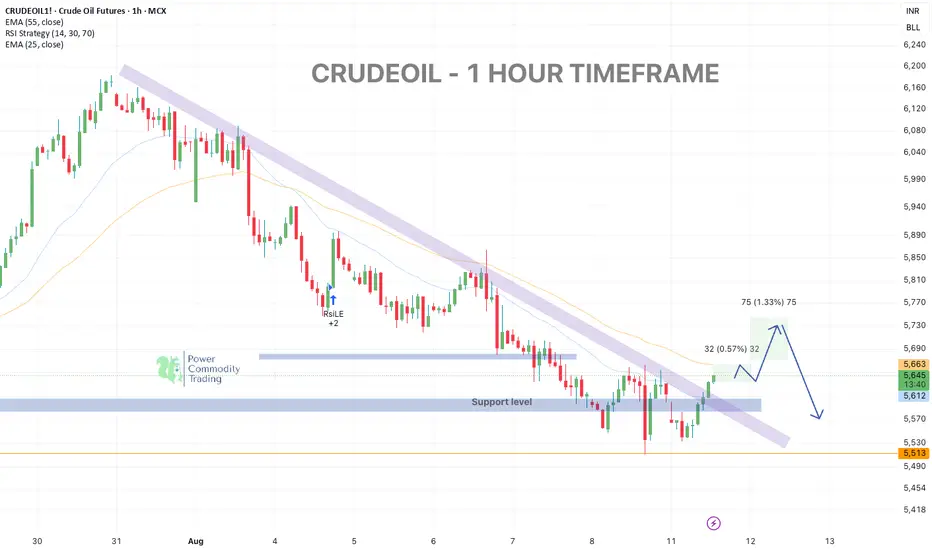
Crude Oil – Retesting Resistance | Possible Pullback Trade Setu
Crude Oil (1H timeframe)
broken out from its short-term downtrend channel and is now retesting key resistance near 5740.
Price is holding above the 5610 support, but upside is likely capped unless bulls sustain momentum.
🔹 Key Levels:
• Resistance: 5740 – 5770
• Support: 5610 → 5513
📊 Technical View & Trade Plan:
• Sell Zone: 5730 – 5770 (near trendline resistance)
• Stop Loss: Above 5800
• Target 1: 5610
• Target 2: 5513
💡 Next Scenario:
• If price breaks & sustains above 5800, bullish momentum could extend toward 5860 – 5900.
• If rejection happens at resistance, expect a pullback toward 5610 and possibly 5513.
Bias: Neutral to Bearish — waiting for price reaction at resistance to confirm the next move.
CLN2015 trade ideas
crude long ideacrudeoil futures india mcx to take a support at 4 th wave base correction , should be a good buy setup , as this levels hold premiums as per price levels are.
to continue upside, always first attempt at major levels respects

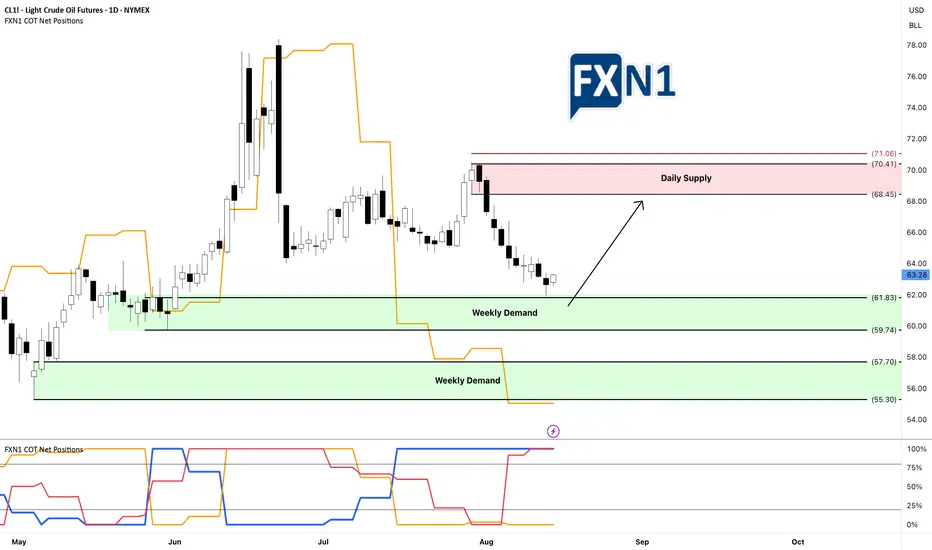
Oil Market Insights: Demand Zones and Future FundamentalsYesterday, CL1! oil tested and rebounded from my weekly demand zone without triggering my entry, resulting in a missed opportunity for several points. This suggests to me that there is buying interest at this level, regardless of the fact that non-commercial traders are short. I am now looking for a retest of this area—if I'm fortunate—to enter a long position. I am also awaiting the new COT data tomorrow to assess any potential shifts in fundamentals. Additionally, I am considering the presence of a stronger demand zone below, which appears even more promising. We'll see how it unfolds.
✅ Please share your thoughts about CL1! in the comments section below and HIT LIKE if you appreciate my analysis. Don't forget to FOLLOW ME; you will help us a lot with this small contribution.
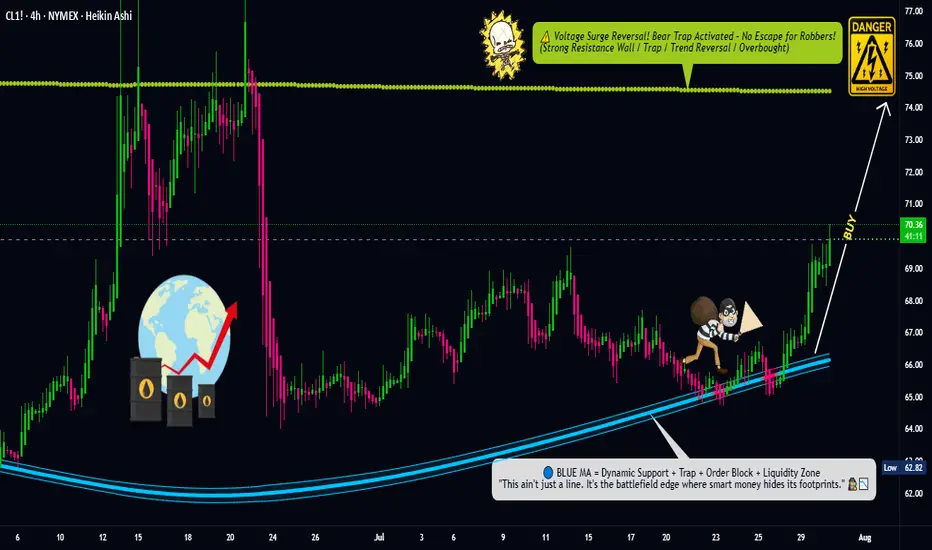
Oil Trap Activated – Limit Orders Set for the Big Score💥🛢️Crude Oil Vault Breach Plan – DCA Heist Begins!🧨💰
🚨Asset: CL1!
📈Bias: BULLISH RAID MODE ON
🎯Target: $74.50
🛡️Stop Loss: $67.50
🔑Entry: ANY LEVEL – Thief stacking limit orders like layers of gold bars 💼⚖️ (DCA Mode Activated)
🕵️♂️Thief Trader is not chasing, we're ambushing 🧠 — scaling in smart with multiple limit traps. The crew never FOMOs, we trap the market 🎯.
💣This is a layered loot plan, not for weak hands. Watch how we load up quietly while market sleeps 😴, then hit hard when the vault cracks open 🔐.
Support this heist by smashing that ❤️LIKE button
💬 Comment your plans below & join the real thief squad
🤝 Together we rob the market — LEGALLY & LOGICALLY
#ThiefTrader #OilHeist #CL1 #BullishTrap #DCA #CrudeOilStrategy #SmartMoneyPlay #MarketRobbery #TeamLoot #NoRetailPanic
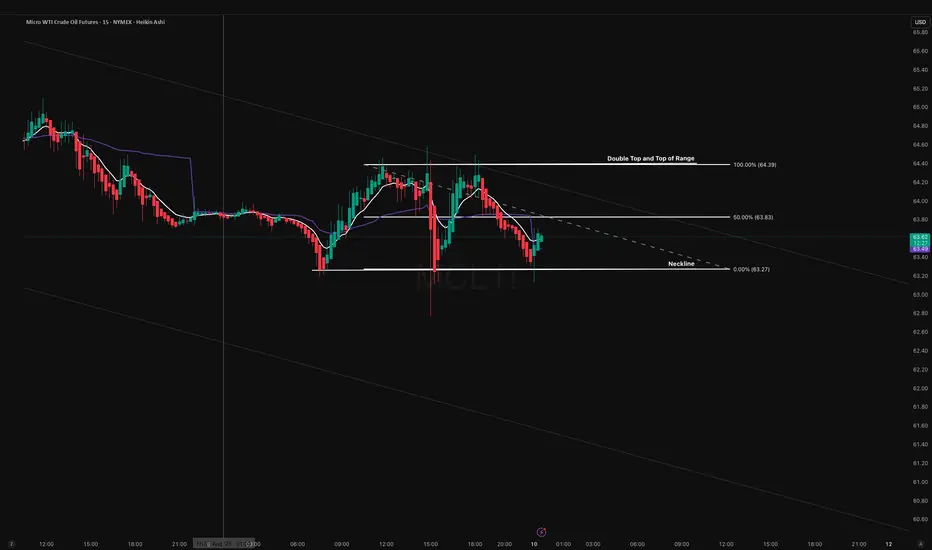
MCL About to Take the Express Elevator DownOn the 15-min chart, MCL has completed a clean double top at 64.50, with neckline support broken at 63.00. This pattern is forming within a broader descending channel, adding higher-timeframe confluence for further downside.
Bearish Scenario (Primary Bias – 70% Probability)
- Entry Zone: 63.80–64.00 retest of broken neckline
- Stop Loss: 64.20 (above retest high)
- Target 1: 62.50 (recent swing low / intraday liquidity pocket)
- Target 2: 61.50 (lower channel boundary)
- Target 3: 60.80 (HTF measured move from double top)
Technical confluence:
Pattern completion, retest rejection, descending channel structure, macro trend alignment.
Bullish Invalidator (30% Probability)
A sustained reclaim of 64.20 with volume would invalidate the breakdown, likely triggering a short squeeze back into 64.50–64.70. This scenario is less likely without a macro catalyst during Tokyo liquidity, but remains a risk consideration.
The Tokyo open often sees thin liquidity in oil futures, meaning stop hunts above retest zones are common. Patience is key wait for rejection confirmation before entering short.
Bearish unless we see a confirmed reclaim and hold above 64.20. Short from 63.80–64.00 offers a high R:R toward the 62.50–60.80 range.
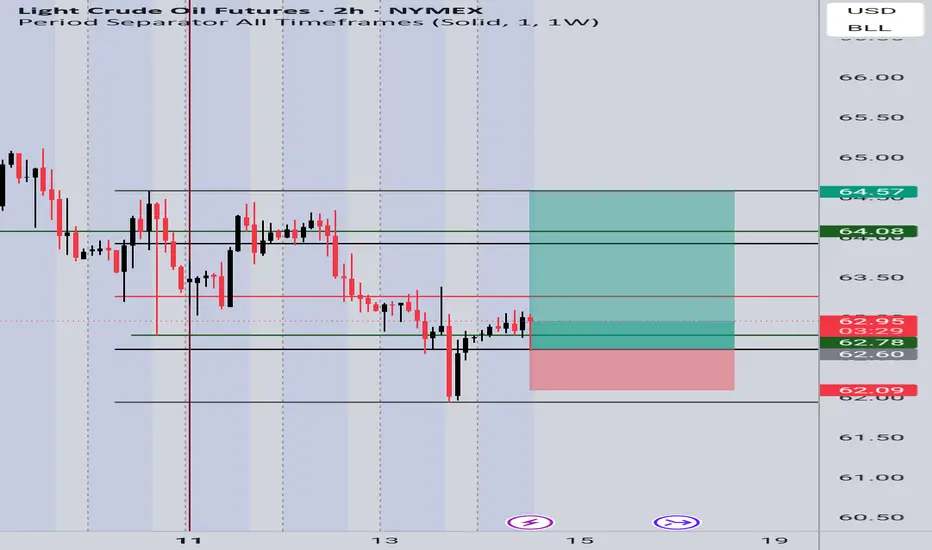
CL1! Long Setup – Recovery BounceBias: Bullish
Reasoning:
Demand zone respected – Price reacted strongly from the 62.00 – 62.20 support zone, forming a bullish rejection wick.
Liquidity sweep – The recent dip below support grabbed liquidity before reversing upward, signaling possible continuation.
Higher timeframe confluence – On the daily, crude oil remains in a broader accumulation phase with buyers stepping in at key support.
Risk-to-Reward setup – Entry near 62.70 – 62.90, targeting higher resistance zones, gives a favorable R:R.
Entry: 62.70 – 62.90
Stop Loss (SL): 62.00 (below liquidity sweep)
Target 1 (TP1): 64.08
Target 2 (TP2): 64.57
📈 Plan: Looking for price to push higher as long as it holds above 62.00 support.
Crude Oil Bearish and Bullish scenarios for the weekCrude Oil can go both directions this week depending on the price we hit in the start of the week.
Patience Patience Patience!!!!
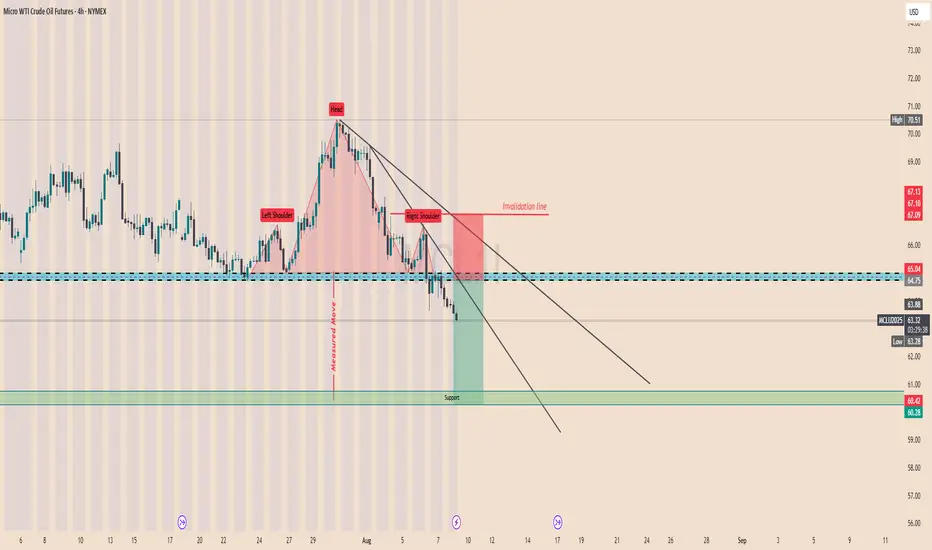
MCL1 Head and Shoulder Pattern! H&S price retested neckline a few times and no closed below it heading to first support at 63.6 then > 60.80 and possible extension to 57.8
Crude oil: Sell around 66.50, targeting 63.00-60.00Crude Oil Market Analysis:
We've stated this dozens of times before: the overall trend of crude oil is bearish. As long as crude oil doesn't break above 70.00, we can maintain our bearish outlook. Today, we maintain our bearish outlook and continue to sell on any rebounds. Crude oil fundamentals don't support buying. The previous easing of tensions in the Middle East has also been suppressing crude oil prices for a long time, and the ever-changing tariff war is also suppressing crude oil. However, crude oil hasn't broken through 63.00 yet. Today, we're focused on selling if it breaks through. If it doesn't, we'll wait for a small rebound to sell. Focus on selling at 66.50.
Fundamental Analysis:
The tariff war has been the most influential fundamental factor affecting gold recently, and in the long term, it supports gold. This surge in gold prices is driven by Trump's renewed turmoil. Furthermore, the Federal Reserve's future monetary policy remains a key focus.
Trading Strategy:
Crude oil: Sell around 66.50, targeting 63.00-60.00.
CRUDE OILPreferably suitable for scalping and accurate as long as you watch carefully the price action with the drawn areas.
With your likes and comments, you give me enough energy to provide the best analysis on an ongoing basis.
And if you needed any analysis that was not on the page, you can ask me with a comment or a personal message.
Enjoy Trading ;)
Crude Oil: Equilibrium, Key Levels & Trade ScenariosNYMEX:CL1! NYMEX:MCL1!
Market Recap
In our prior crude oil commentary, we identified a bullish flag formation with key support anchored at the Q3 micro composite Value Area Low. Following a measured pullback, prices decisively reclaimed the Q3 micro composite Value Area High, subsequently advancing toward the $70 level. However, this upward momentum proved unsustainable, with prices unable to maintain higher ground. We have since retraced to the yearly open, where the market is now consolidating.
Current Market Structure
Crude oil is presently exhibiting a balanced profile. Notably, the composite Volume Points of Control (VPOC) for both the yearly and quarterly profiles are overlapping — a technical signal indicative of equilibrium in positioning.
Market Performance Assessment
Price action in recent sessions has been heavily influenced by shifts in the global demand outlook, which in turn remain sensitive to macroeconomic expectations, geopolitical events, and OPEC+ V8 members’ gradual unwinding of voluntary production cuts. Despite the prevailing headwinds — including tariff disputes, Russian sanctions, and broader trade tensions — crude oil has demonstrated resilience, consistently trading above the $65 threshold.
Forward Outlook
Attention will turn to today’s EIA release at 9:30 a.m. CT, which may serve as the primary catalyst for near-term directional bias.
Key Technical Levels
• Q3 mCVAH: 67.28
• Neutral Zone: 66.45 – 66.30
• Yearly Open: 66.34
• Intermediate Support: 65.80
• CVPOC / mCVPOC: 65.54
• Q3 mCVAL: 64.95
• Support Zone: 65.00 – 64.80
Trading Scenarios
• Scenario 1 — Yearly Open Rejection
Monitor the Yearly Open (66.34) as an initial resistance level. A rejection here could prompt a tactical pullback toward the Line in the Sand (LIS), offering long entry opportunities with a target above the yearly open.
• Scenario 2 — DOE-Driven Flush & Recovery
Should the DOE data trigger a downside push, watch for a swing failure at recent lows. A close back above prior levels would present a potential long setup, with conviction increasing on sustained price action above 65.80.

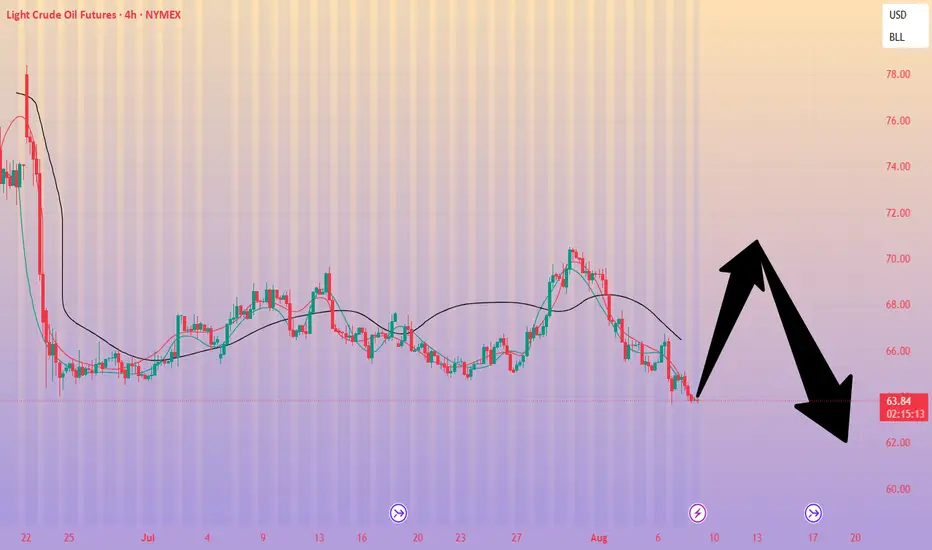
Crude Oil Resumes Its WeaknessCrude oil rised and then fell sharply from above 78 dollars back in June, after tensions in the Middle East. The drop unfolded as an impulse into wave A, so even if this is just a counter-trend move down from 78, it still appears incomplete. After we recently spotted a corrective rally in wave B that nicely stopped at projected $70 resistance near 61,8% Fibo. retracement, we can now see it resuming lower within projected wave C towards 60-59 area at least, if not even lower.

WTI(20250808)Today's AnalysisMarket News:
① Trump nominated Stephen Milan, Chairman of the White House Council of Economic Advisers, to serve on the Federal Reserve Board, with a term ending January 31, 2026.
② Waller is reportedly a leading candidate for the next Fed Chair.
③ U.S. Treasury Secretary Bensont stated that the interview process for the Fed Chair has begun.
④ Bostic stated that the July jobs report did change the Fed's outlook on its employment goals.
Technical Analysis:
Today's Buy/Sell Levels:
63.55
Support and Resistance Levels:
64.86
64.37
64.06
63.05
62.73
62.24
Trading Strategy:
If the price breaks above 63.55, consider entering a buy position, with the first target price being 64.06.
If the price breaks below 63.05, consider entering a sell position, with the first target price being 62.73.

S&P gold oil coffee8 5 25 in this video we're looking for some scalping trades the video gives my perception of where the buyers and sellers are and where the opportunity is for both buyers and sellers

A look at multiple markets Eight six 25 that I looked at about 4 or 5 markets today including gold and a few other markets. I focused on 1.272 extensions which are very effective and getting you out of the market before you lose your profits. I talked a little bit about a stop in reverse approach to the market which can be very profitable. I also talked about taking profits when you're long on the market because you know there's going to be a correction..... And then getting back into the market to trade it higher..... This is a little bit different than stop in reverse. Years ago I tried to trade stop and reverse Trading but I did not do well at all with it and I didn't understand why this was until years later.

Crude Oil setting up for a Long Trade to $78.40In the long term, Crude Oil is in a short position.
We can see this from the red pendulum fork, which projects the price movement downward.
However, in the short- to medium-term, we're long, as clearly illustrated by the white fork. Supporting the case for higher prices is the Hagopian signal that occurred on June 24, 2025.
This essentially means that the market is expected to rise beyond the point it came from—specifically, the C-point of the red fork. The target would therefore be around $78.40 in the coming weeks or months, which does seem quite ambitious.
But as long as price remains within the boundaries of the white fork, we're in an upward mode, and the potential profit target of $78.40 remains valid.
Also, the fact that Crude Oil is finding support exactly at the L-MLH (Lower Median Line Parallel) of the white fork gives me further confidence in a long trade.
Crude: Long and: Don't forget to watch the follow-up Video.

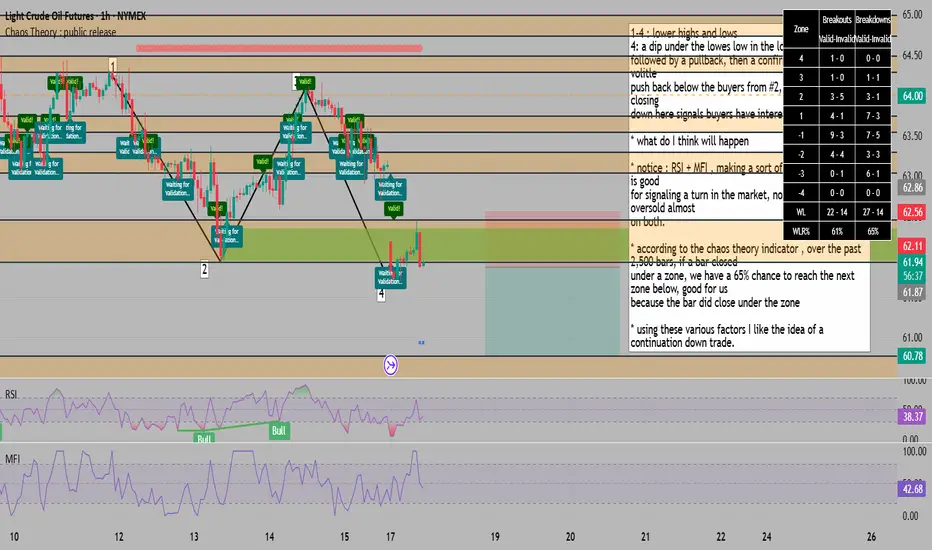
downtrend continuation confirmed on the hourly for the next leg1-4 : lower highs and lows
4: a dip under the lowes low in the local structure ,
followed by a pullback, then a confirmation STRONG volitle
push back below the buyers from #2, for me the candle closing
down here signals buyers have interest
* what do I think will happen
* notice : RSI + MFI , making a sort of triangle shape, this is good
for signaling a turn in the market, not to mention oversold almost
on both.
* according to the chaos theory indicator , over the past 2,500 bars, if a bar closed
under a zone, we have a 65% chance to reach the next zone below, good for us
because the bar did close under the zone
* using these various factors I like the idea of a continuation down trade.
Crude oil: Sell near 63.00, target 62.00-60.0Crude Oil Market Analysis:
We remain bearish on crude oil today. With new contracts now open for delivery, crude oil is still weak. Consider selling on any rebound. Crude oil shows no buying signals, lacking fundamental or technical support. If it breaks below 60.00, it will plunge again. Consider selling on a rebound near 63.00 today.
Fundamental Analysis:
Recently, there are more fundamentals than data. This week will feature the results of the Federal Reserve's monetary policy meeting.
Trading Recommendations:
Crude oil: Sell near 63.00, target 62.00-60.00
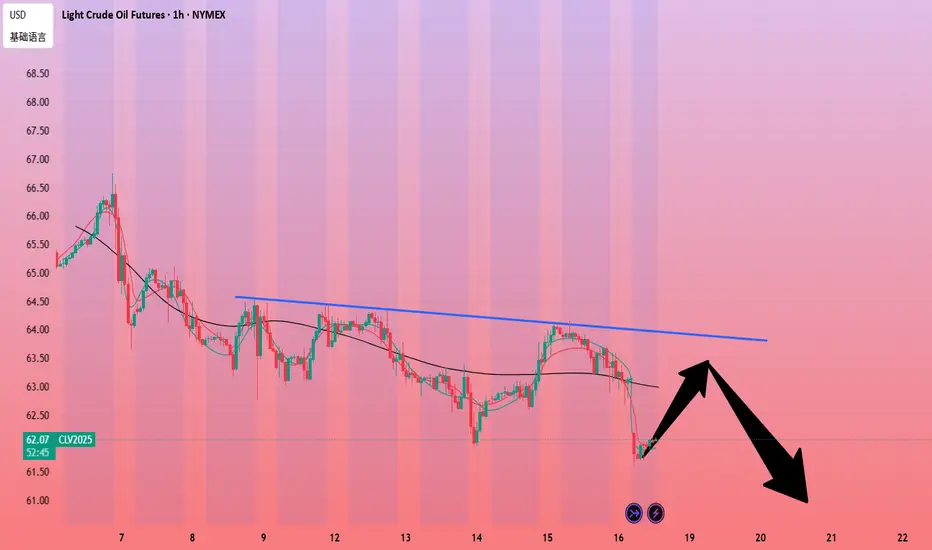
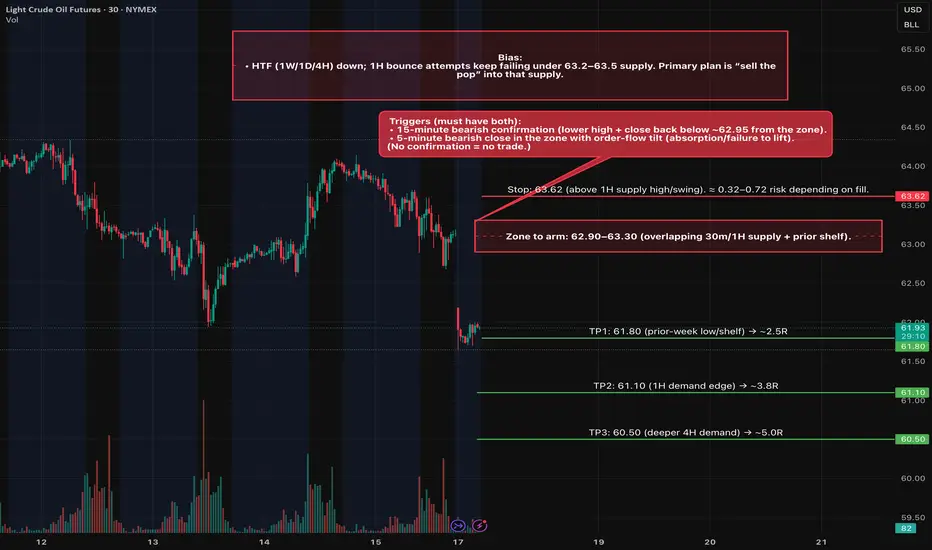
CL (Oil Futures) Short Trade Idea 08/17Setup
• Type: Rejection of 4H/1H supply → continuation lower.
• Zone to arm: 62.90–63.30 (overlapping 30m/1H supply + prior shelf).
• Triggers (must have both):
• 15-minute bearish confirmation (lower high + close back below ~62.95 from the zone).
• 5-minute bearish close in the zone with order-flow tilt (absorption/failure to lift).
(No confirmation = no trade.)
Entry & Risk
• Entry: MOS on the confirming 5m close within 62.90–63.30.
• Stop: 63.62 (above 1H supply high/swing). ≈ 0.32–0.72 risk depending on fill.
• Size: Calibrate so full-stop loss = ≤ 1R of your plan.
Targets (R:R from 63.10 mid-entry, 0.52 stop)
• TP1: 61.80 (prior-week low/shelf) → ~2.5R
• TP2: 61.10 (1H demand edge) → ~3.8R
• TP3: 60.50 (deeper 4H demand) → ~5.0R
Management
• Scale 1/2 at TP1; trail above last 5m swing after a fresh LL or hold for TP2.
• If price tags 63.30–63.50 and closes 15m above 63.50, invalidate the short idea until structure resets.
• Avoid fresh risk within ~10–15 min of EIA Wed 10:30 ET; re-arm after the first post-release 15m bar closes.
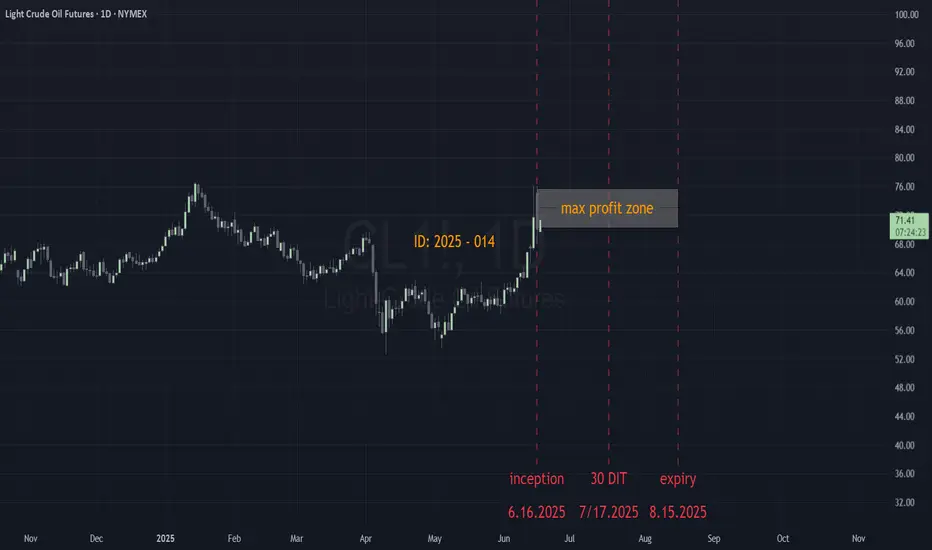
ID: 2025 - 0146.16.2025
Trade #14 of 2025 executed.
Trade entry at 60 DTE (days to expiration).
BULLISH options trade executed on Crude Oil. Once price level of $75.00 gets taken out, this trade will get adjusted to secure a risk-free trade. Targets will be 100% ROI based upon this being a balanced bullish butterfly construct.
Defined risk
Defined reward
Happy Trading!
-kevin
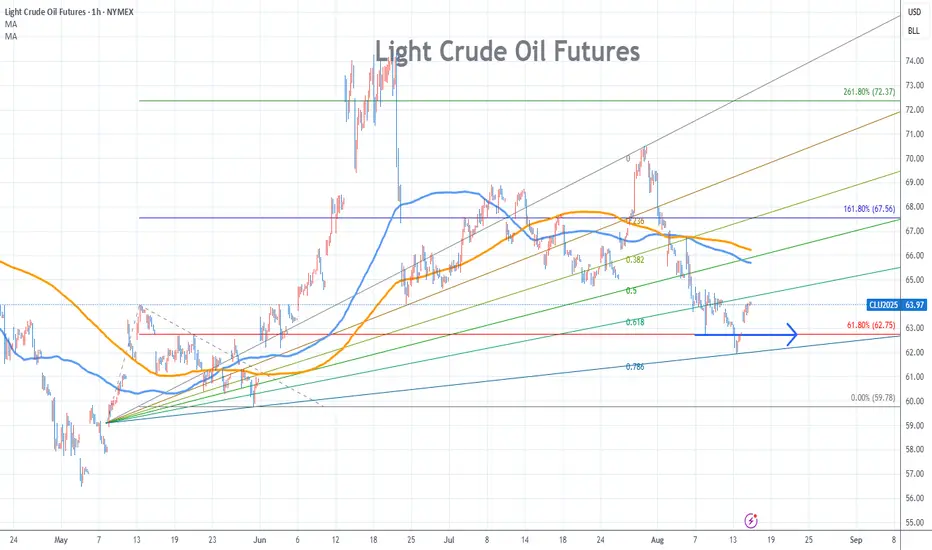
Light Crude Oil Futures Stock Chart Fibonacci Analysis 081425Trading Idea
1) Find a FIBO slingshot
2) Check FIBO 61.80% level
3) Entry Point > 63/61.80%
Chart time frame:B
A) 15 min(1W-3M)
B) 1 hr(3M-6M)
C) 4 hr(6M-1year)
D) 1 day(1-3years)
Stock progress:A
A) Keep rising over 61.80% resistance
B) 61.80% resistance
C) 61.80% support
D) Hit the bottom
E) Hit the top
Stocks rise as they rise from support and fall from resistance. Our goal is to find a low support point and enter. It can be referred to as buying at the pullback point. The pullback point can be found with a Fibonacci extension of 61.80%. This is a step to find entry level. 1) Find a triangle (Fibonacci Speed Fan Line) that connects the high (resistance) and low (support) points of the stock in progress, where it is continuously expressed as a Slingshot, 2) and create a Fibonacci extension level for the first rising wave from the start point of slingshot pattern.
When the current price goes over 61.80% level , that can be a good entry point, especially if the SMA 100 and 200 curves are gathered together at 61.80%, it is a very good entry point.
As a great help, tradingview provides these Fibonacci speed fan lines and extension levels with ease. So if you use the Fibonacci fan line, the extension level, and the SMA 100/200 curve well, you can find an entry point for the stock market. At least you have to enter at this low point to avoid trading failure, and if you are skilled at entering this low point, with fibonacci6180 technique, your reading skill to chart will be greatly improved.
If you want to do day trading, please set the time frame to 5 minutes or 15 minutes, and you will see many of the low point of rising stocks.
If you want to prefer long term range trading, you can set the time frame to 1 hr or 1 day.
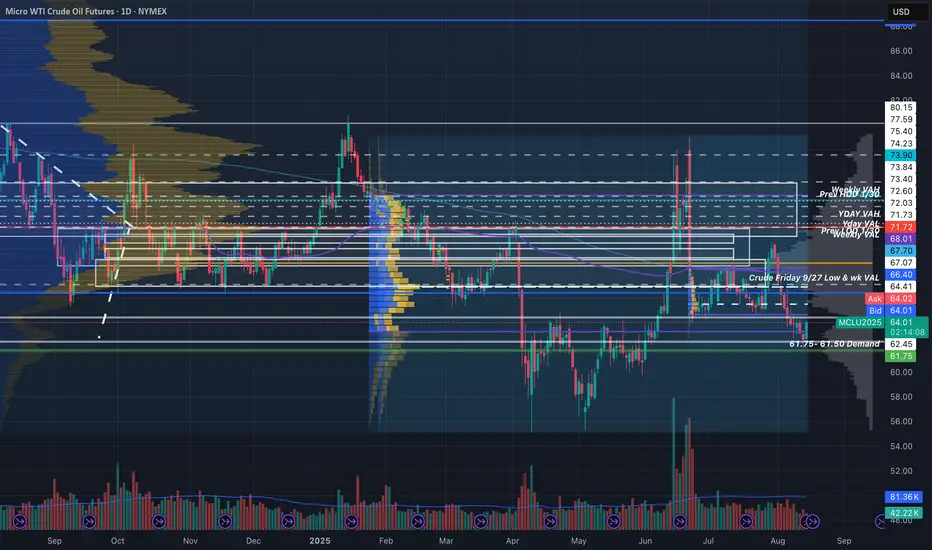
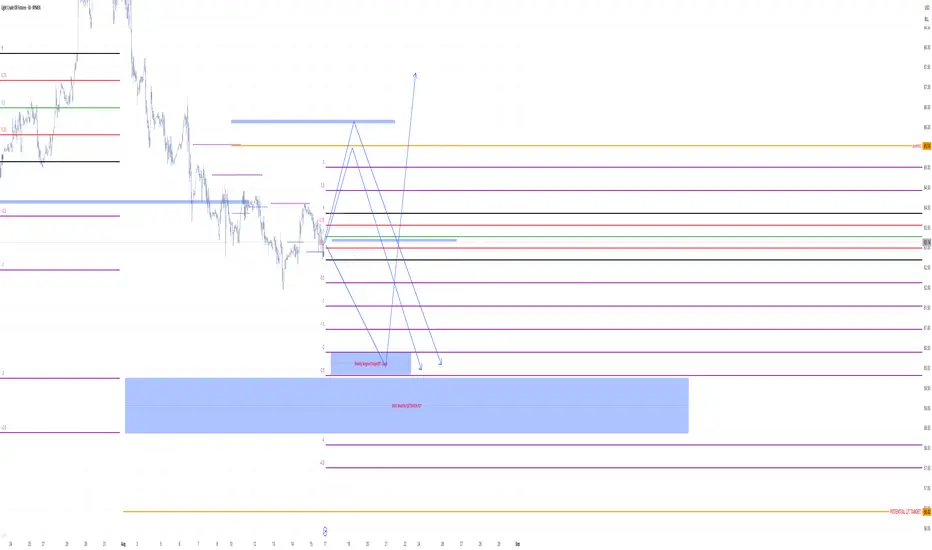
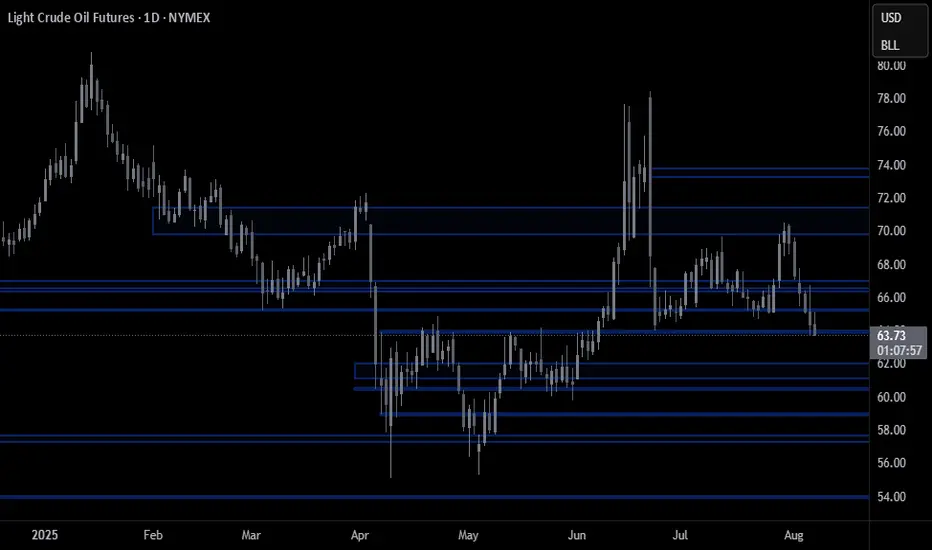
Crude Levels (Non-Updated but still reactive)Just wanted to share my crude levels. Drew alot of these months ago and haven't adjusted alot of them...especially the boxes but general areas identified still seem to be reactive.
Will update these eventually, but not sure this will be a living chart once published.
~The Villain
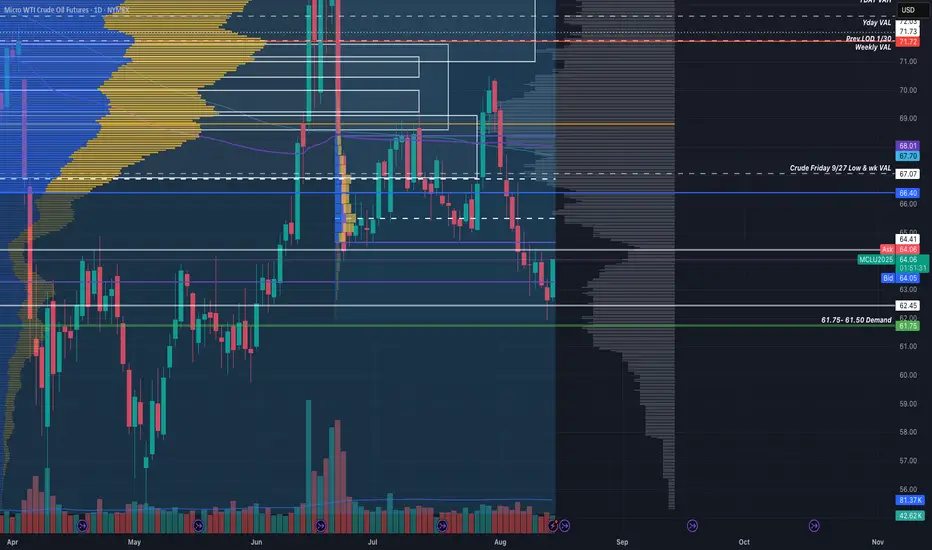
Crude Levels (Non-Updated but still reactive)Just wanted to share my crude levels. Drew alot of these months ago and haven't adjusted alot of them...especially the boxes but general areas identified still seem to be reactive.
~The Villain