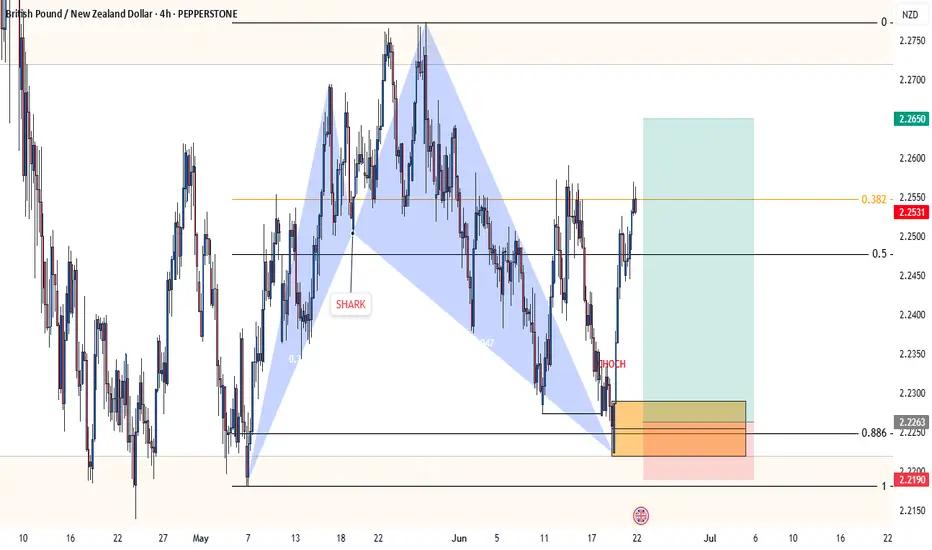
Potential Bullish Shark Pattern on #GBPNZDI have just spotted a potential bullish shark pattern on GBPNZD., We have gotten a structure shift on H1.
As usual, I will discuss more on this analysis with a video and attach the link as a comment to this write-up.
Related currencies
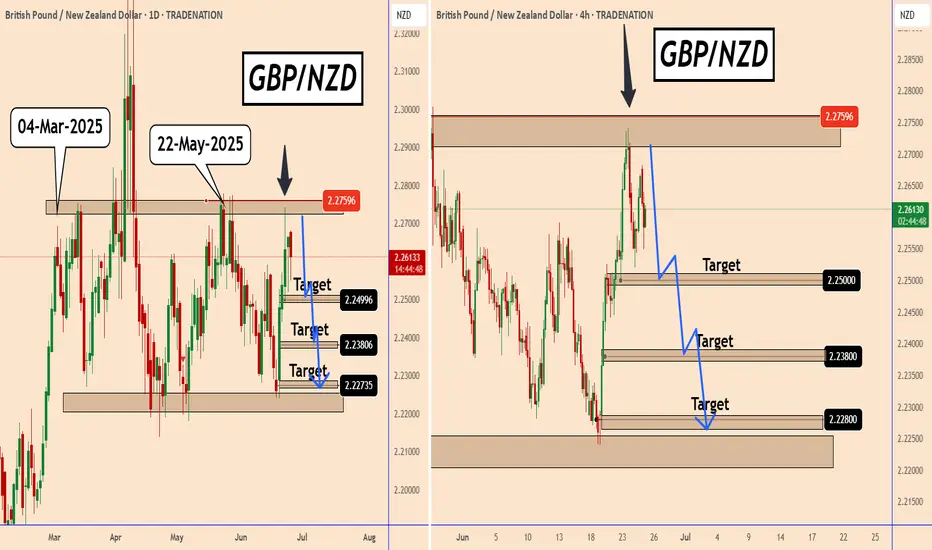
GBPNZD: Potential Reversal From The Resistance ZoneGBPNZD: Potential Reversal From The Resistance Zone
GBPNZD tested an area that was also tested earlier at the beginning of March 2025
From the chart, we can see that this zone has stopped the price several times on the past.
The chances are that GBPNZD may start a bearish wave from the same zon
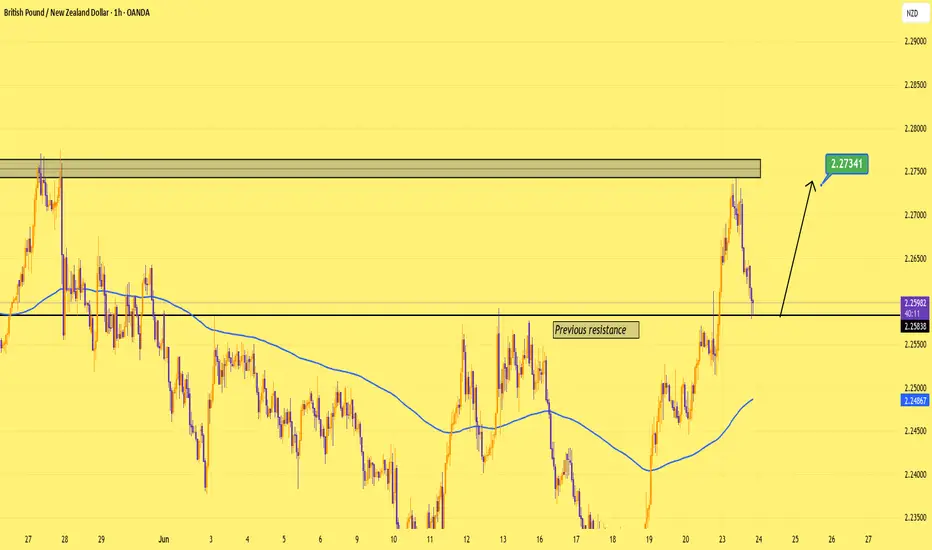
GBPNZD BUY IDEAAccording to the Daily Chart, we're currently in an uptrend. Price broke a major resistance level, 2.25511, yesterday and continued without a retest. I'm looking at a retest of the broken resistance for continued buys.
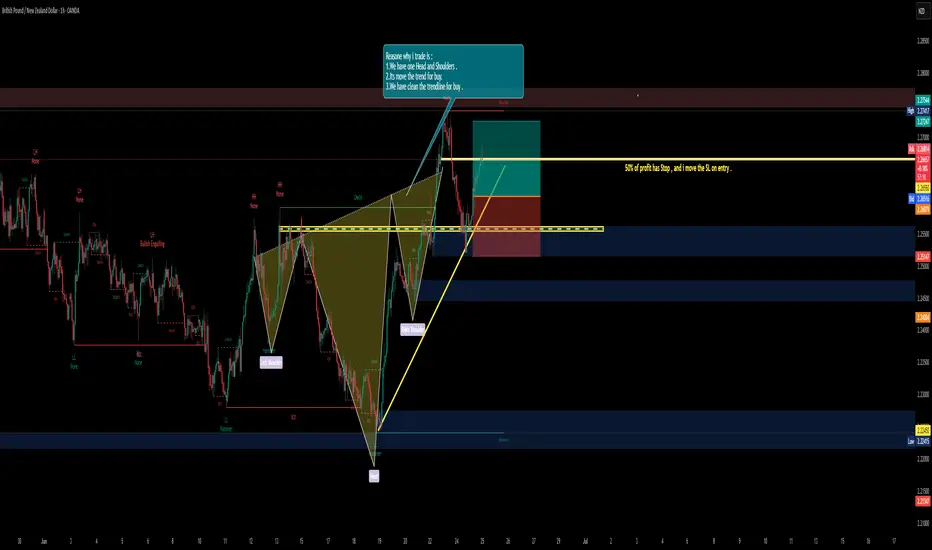
GBPNZD Buy✅ 1. Inverse Head and Shoulders Pattern:
You have a well-defined Left Shoulder → Head → Right Shoulder structure. This is a classic bullish reversal pattern indicating the end of the downtrend and suggesting that price is now more likely to move upwards.
✅ 2. Trendline Support:
The price is followi
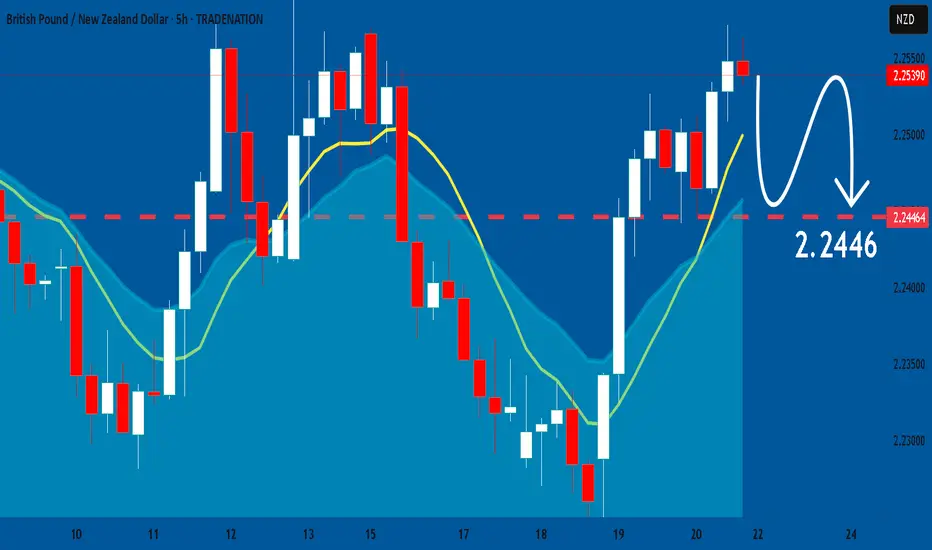
GBP-NZD Long From Demand Ahead! Buy!
Hello,Traders!
GBP-NZD is making a bearish
Correction but will soon
Retest a wide demand area
Around 2.2539 from where
We will be expecting a
Local rebound a move up
Buy!
Comment and subscribe to help us grow!
Check out other forecasts below too!
Disclosure: I am part of Trade Nation's
Gbpnzd Bullish Trading Idea
GBPNZD is following a strong Bullish Channel — the pair has been consistently making Higher Highs (HH) and Higher Lows (HL).
Currently, the price is around 2.2210, showing bullish momentum. We're expecting the next Higher High to reach 2.3249+.
🚨 Watch for a breakout and hold above 2.221 for poten

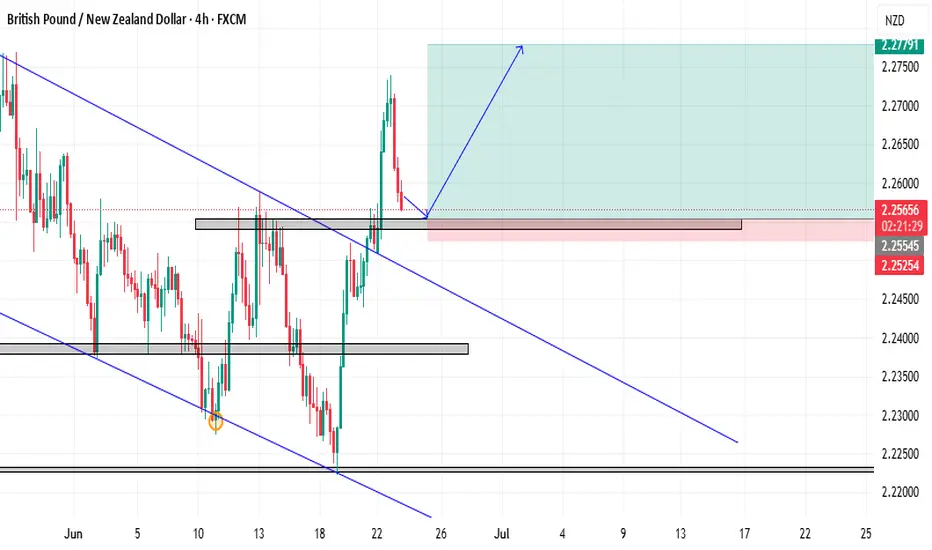
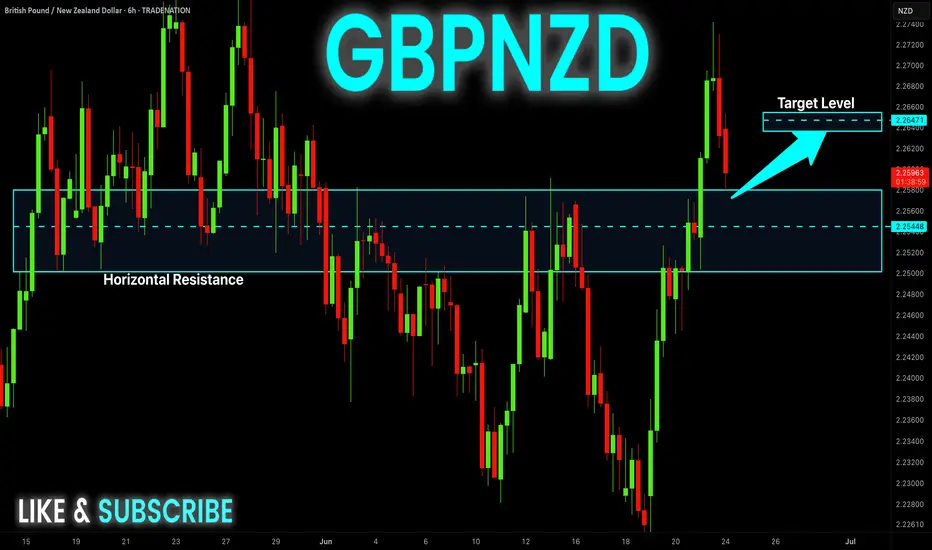
Old Roof, New Floor: GBPNZD Eyes 2.2730Price just flipped 2.2580 from resistance to support. As long as that floor holds, I’m looking for a push toward 2.2730. Invalidation below 2.2500
⚠️ Heads-up: BoE Governor Bailey speaks tomorrow (Jun 24). A dovish tone could knock GBP lower and spoil the setup.
GBPNZD Bullish strong from key demand zone 2.22800GBPNZD – Bullish Outlook
Timeframe: 30-Minute
Current Price Action: Price is reacting strongly off a Friend Demand Zone at 2.22800, confirming bullish intent. We also have a Bullish Fair Value Gap (FVG) supporting the move.
---
🎯 Technical Targets:
1️⃣ First Target: 2.24100 – Key Supply Zone
2️

GBPNZD Bullish Triangle Breakout,with bullish pennant set upThe GBPNZD 2H chart illustrates a bullish pennant formation following a strong upward move. Price is consolidating within the triangle and is expected to break upward, continuing the bullish trend. A breakout above the triangle suggests a potential rally toward the 2.30086 target, with 2.25443 actin

GBPNZD: Market Sentiment & Forecast
Looking at the chart of GBPNZD right now we are seeing some interesting price action on the lower timeframes. Thus a local move down seems to be quite likely.
Disclosure: I am part of Trade Nation's Influencer program and receive a monthly fee for using their TradingView charts in my analysis.
❤
See all ideas
Summarizing what the indicators are suggesting.
Oscillators
Neutral
SellBuy
Strong sellStrong buy
Strong sellSellNeutralBuyStrong buy
Oscillators
Neutral
SellBuy
Strong sellStrong buy
Strong sellSellNeutralBuyStrong buy
Summary
Neutral
SellBuy
Strong sellStrong buy
Strong sellSellNeutralBuyStrong buy
Summary
Neutral
SellBuy
Strong sellStrong buy
Strong sellSellNeutralBuyStrong buy
Summary
Neutral
SellBuy
Strong sellStrong buy
Strong sellSellNeutralBuyStrong buy
Moving Averages
Neutral
SellBuy
Strong sellStrong buy
Strong sellSellNeutralBuyStrong buy
Moving Averages
Neutral
SellBuy
Strong sellStrong buy
Strong sellSellNeutralBuyStrong buy
Displays a symbol's price movements over previous years to identify recurring trends.
Frequently Asked Questions
The current rate of NZDGBP is 0.44182 GBP — it has decreased by −0.15% in the past 24 hours. See more of NZDGBP rate dynamics on the detailed chart.
The value of the NZDGBP pair is quoted as 1 NZD per x GBP. For example, if the pair is trading at 1.50, it means it takes 1.5 GBP to buy 1 NZD.
The term volatility describes the risk related to the changes in an asset's value. NZDGBP has the volatility rating of 0.37%. Track all currencies' changes with our live Forex Heatmap and prepare for markets volatility.
The NZDGBP showed a −1.76% fall over the past week, the month change is a −0.24% fall, and over the last year it has decreased by −8.32%. Track live rate changes on the NZDGBP chart.
Learn how you can make money on rate changes in numerous trading ideas created by our community.
Learn how you can make money on rate changes in numerous trading ideas created by our community.
NZDGBP is a minor currency pair, i.e. a popular pair that is not associated with USD. Such pairs are also called cross currency pairs.
Currencies are usually traded through forex brokers — choose the one that suits your needs and go ahead. You can trade NZDGBP right from TradingView charts — just log in to you broker account. Check out the list of our integrated brokers and find the best one for your needs and strategy.
When deciding to buy or sell currency one should keep in mind many factors including current geopolitical situation, interest rates, and other. But before plunging into a deep research, you can start with NZDGBP technical analysis. The technical rating for the pair is sell today, but don't forget that markets can be very unstable, so don't stop here. According to our 1 week rating the NZDGBP shows the strong sell signal, and 1 month rating is sell. See more of NZDGBP technicals for a more comprehensive analysis.