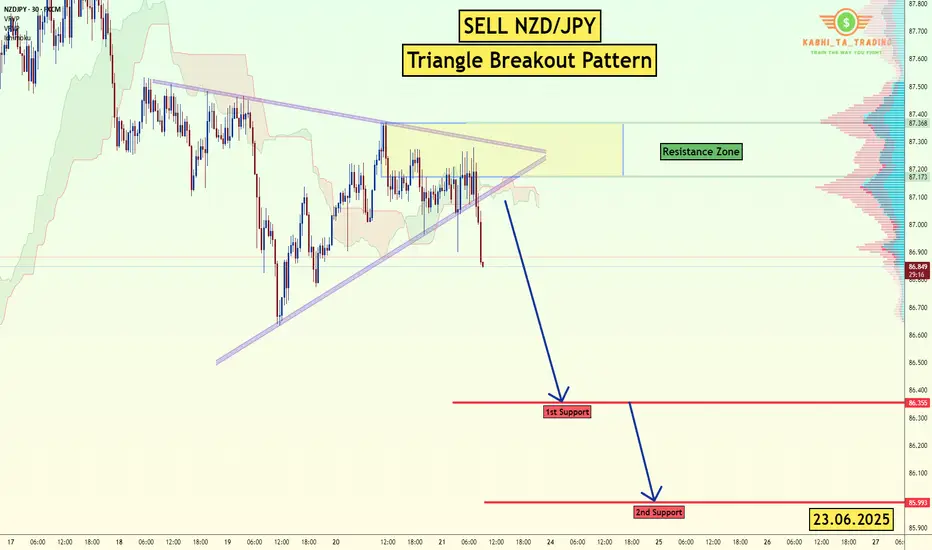
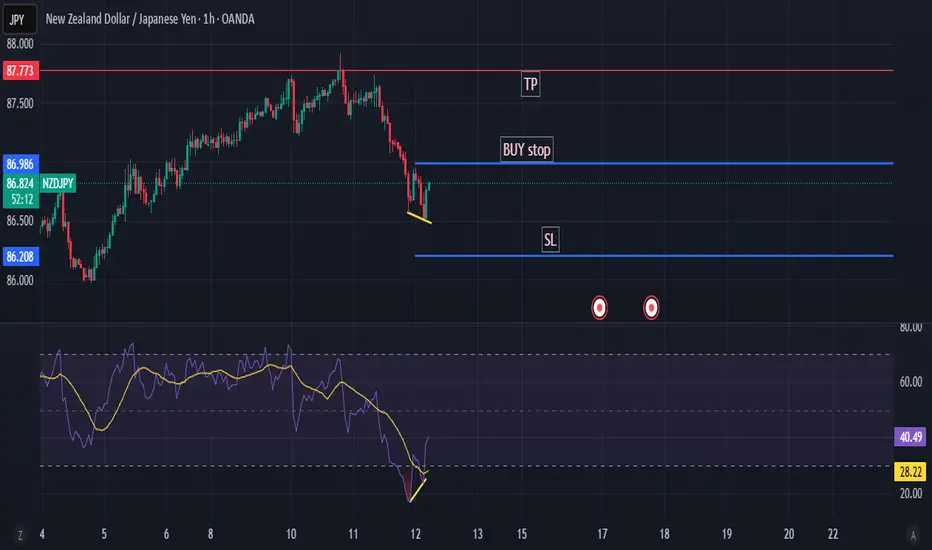
NZD/JPY - Triangle Breakout (23.06.2025)The NZD/JPY Pair on the H1 timeframe presents a Potential Selling Opportunity due to a recent Formation of a Triangle Breakout Pattern. This suggests a shift in momentum towards the downside in the coming hours.
Possible Short Trade:
Entry: Consider Entering A Short Position around Trendline Of The Pattern.
Target Levels:
1st Support – 86.35
2nd Support – 86.00
🎁 Please hit the like button and
🎁 Leave a comment to support for My Post !
Your likes and comments are incredibly motivating and will encourage me to share more analysis with you.
Best Regards, KABHI_TA_TRADING
Thank you.
Disclosure: I am part of Trade Nation's Influencer program and receive a monthly fee for using their TradingView charts in my analysis.
NZDJPY trade ideas
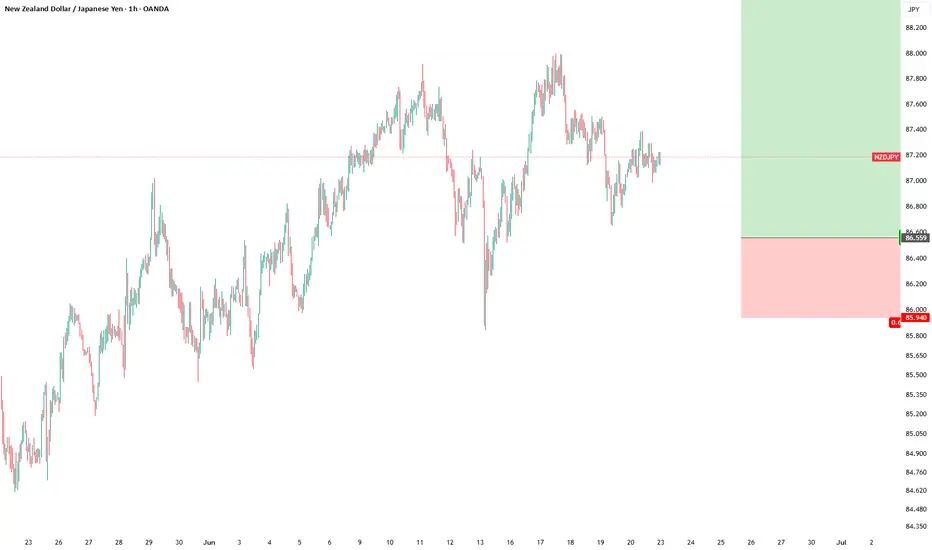
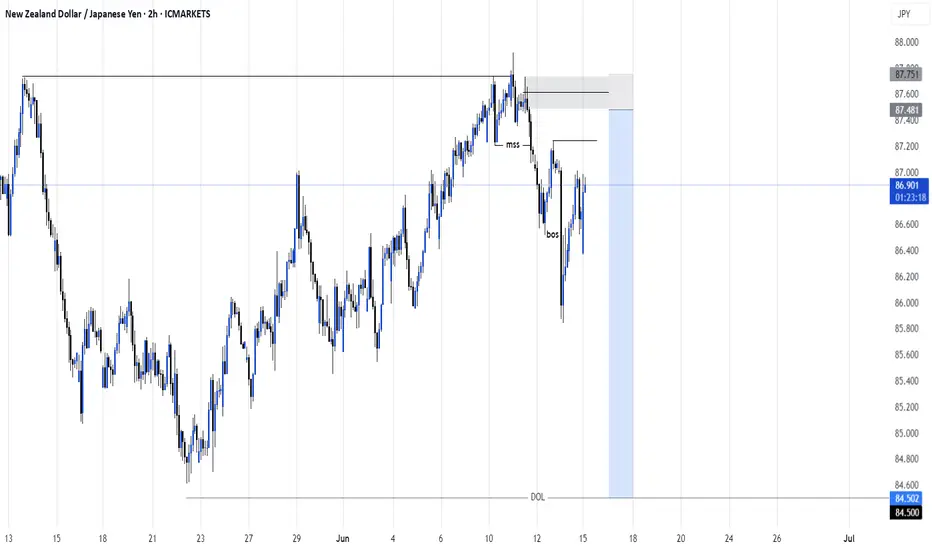
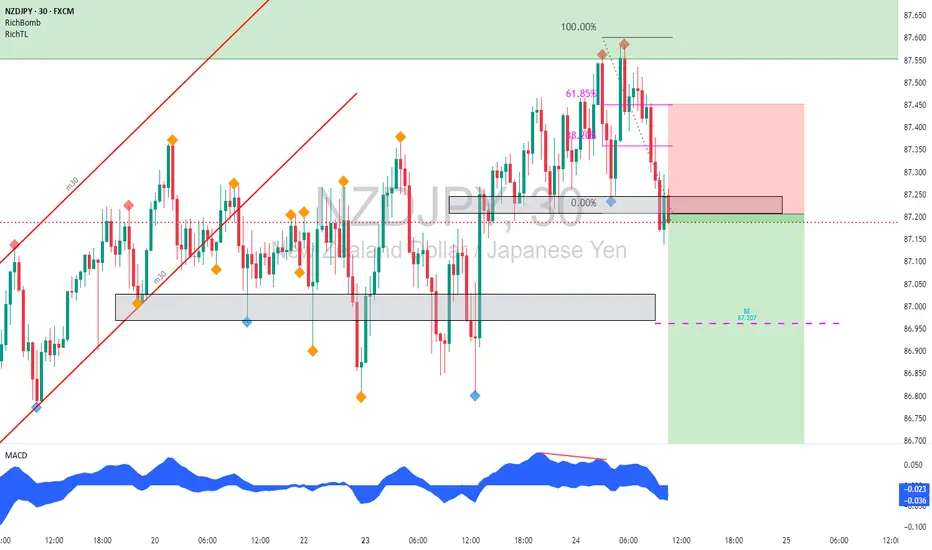
CHECK NUZJPY SIGNAL READ CAPTAINDirection: Short (Sell Setup)
Entry Zone: Around 87.700\87.650
Stop Loss: 87.950
Take Profits:
TP1: ~87.450
TP2: ~87.200
Final Target: 86.950

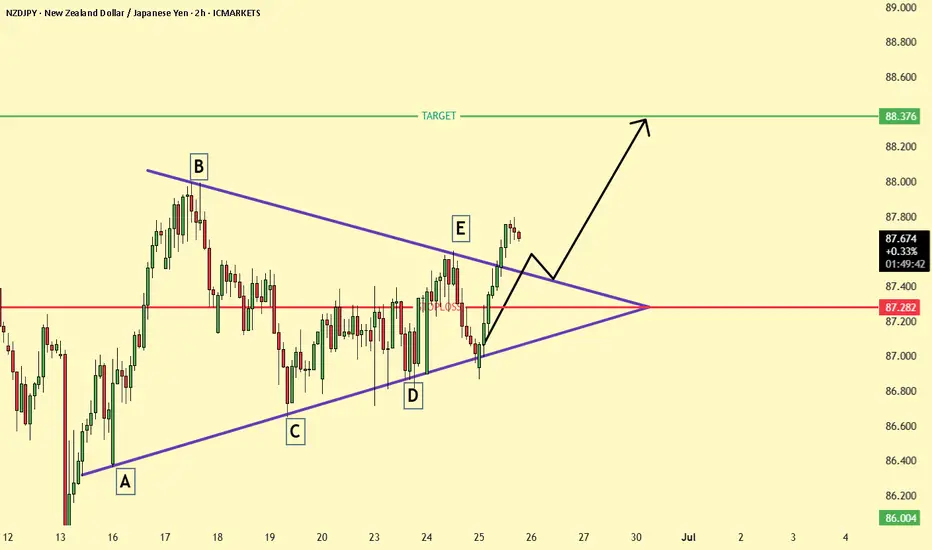
NZD/JPY 2H Chart – Bullish Breakout from Symmetrical TriangleNZD/JPY has broken out of a symmetrical triangle pattern formed by points A to E, signaling a potential bullish continuation. The breakout above the triangle resistance occurred near the 87.3 zone, with price currently pulling back slightly for a possible retest. If the retest holds, the pair is likely to move toward the next resistance target at 88.376. The structure suggests strong momentum favoring buyers in the short term.
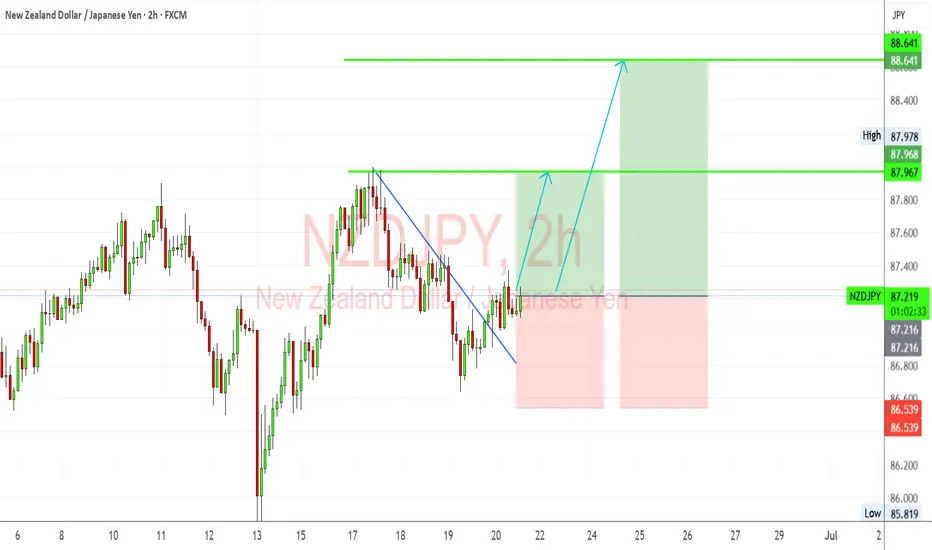
NZDJPY “Kiwi Poised to Fly as Japan Muddles ThroughNZDJPY shows a bullish breakout from a descending trendline, with bullish structure holding near 87.20–87.25.
Key resistance targets:
87.97 (Previous high)
88.64 (Next resistance / projected fib target)
Two upside scenarios are shown:
Conservative target: ~87.97
Aggressive swing: ~88.64
If 87.00–87.20 zone holds as support, expect bullish continuation.
🧩 Current Bias: Bullish
📌 Key Fundamentals Driving NZDJPY
NZD Side (Strengthening):
RBNZ hawkish hold: RBNZ recently kept rates at 5.50% and warned that inflation remains persistent, requiring prolonged tight policy.
Resilient NZ GDP: Stronger-than-expected GDP print signals economic resilience.
Terms of trade improvement: Commodity exports holding firm, China consumption rebound showing hints of demand recovery (see recent 618 festival sales data).
AUD correlation: AUD and NZD are moving together; if AUD strengthens, NZD often follows.
JPY Side (Weakening):
BoJ remains ultra-dovish: Despite inflation trends, BoJ is hesitant to tighten further, preferring gradual tapering.
Yen under pressure from yield differentials: Global central banks (like RBNZ, Fed) remain hawkish while BoJ is not.
Geopolitical funding flows: JPY used as a funding currency amid global volatility (carry trade boost for NZDJPY).
⚠️ Risks That May Reverse the Trend
BoJ surprise tightening rhetoric (e.g. bond purchase taper announcement).
China data deterioration, hurting Kiwi sentiment.
Sharp equity sell-off and geopolitical escalation (Yen safe-haven reversal).
📅 Important News to Watch
🇳🇿 NZ Trade Balance (upcoming)
🇯🇵 Tokyo Core CPI (Jun 28) – Critical for BoJ policy speculation.
RBNZ or BoJ member speeches (hawkish or dovish shifts)
Fed tone shift or US dollar strength spillover
🏁 Who Leads the Move?
NZDJPY could lead among yen crosses due to the RBNZ’s clear inflation fight versus BoJ’s passive stance. NZDJPY is also more responsive to commodity and global risk-on flows than EURJPY or USDJPY.
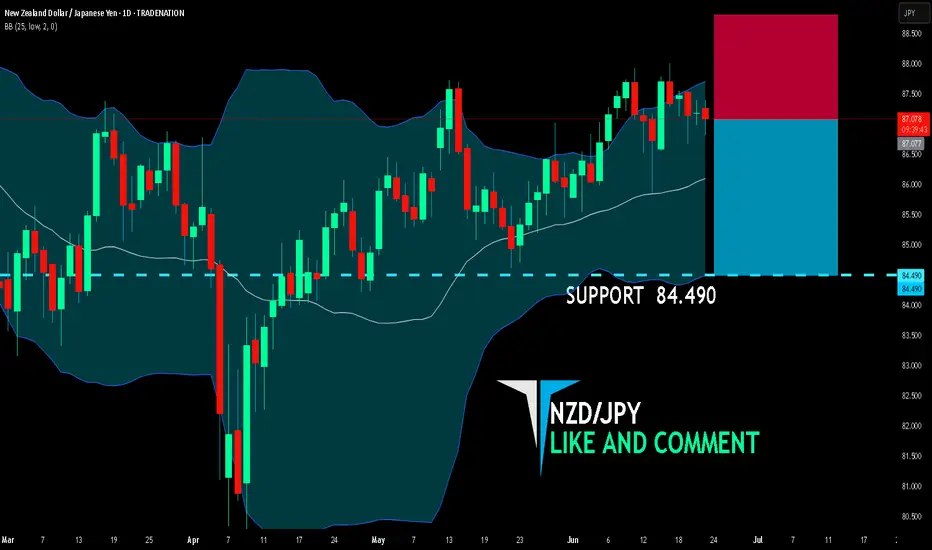
NZD/JPY BEARS WILL DOMINATE THE MARKET|SHORT
NZD/JPY SIGNAL
Trade Direction: short
Entry Level: 87.077
Target Level: 84.490
Stop Loss: 88.805
RISK PROFILE
Risk level: medium
Suggested risk: 1%
Timeframe: 1D
Disclosure: I am part of Trade Nation's Influencer program and receive a monthly fee for using their TradingView charts in my analysis.
✅LIKE AND COMMENT MY IDEAS✅
Trade Idea: Long NZD/JPY (Short-Term Only) **📈 Trade Idea: Long NZD/JPY (Short-Term Only)**
**Bias:** 🎯 Slightly Bullish
**Timeframe:** 🕒 Short-Term (cautious entry)
**Key Zone:** Needs to stay above 94.50 — upside may fade around 96.00
---
### **💡 Why Consider NZD/JPY Long?**
**🇳🇿 New Zealand Dollar (NZD):**
* **Risk sentiment weak, China demand fading**
→ *🌧️ Not a strong backdrop — Kiwi is under pressure globally.*
* **RBNZ cut rates to 3.25%**
→ *🔻 Dovish tone continues. Market expecting more easing.*
* **GDP due June 23 — big wildcard**
→ *📅 Until then, NZD is stuck in limbo. Surprise = upside, disappointment = selloff.*
* **Dairy prices, China links still weighing**
→ *🐄🇨🇳 Old story, still relevant. No new tailwinds for the Kiwi.*
* **Overall sentiment: Bearish**
→ *📉 Most traders are expecting softer NZD data ahead.*
---
**🇯🇵 Japanese Yen (JPY):**
* **Supported by risk-off flows**
→ *🛡️ Investors run to JPY in fear — gives it short-term strength.*
* **BoJ still ultra-dovish**
→ *🎈 Monetary policy is soft. No tightening expected till late 2025.*
* **CPI is above target, but BoJ not reacting**
→ *📊 Data says tighten, but BoJ says no. That caps JPY strength.*
* **Risk-sensitive, but also used for funding**
→ *💸 Weak long-term, but can pop on fear-driven trades.*
---
### **🔍 Outlook:**
There’s a short-term case for upside **if** risk calms and NZ GDP surprises. But the bigger picture isn’t great — both currencies are weak for different reasons, and this pair is stuck between them.
---
**📌 Note:**
> *“Not a trade I’d take myself — feels like trying to pick a winner in a race where both runners are limping. If anything, this is a 'maybe-for-a-day' type of setup, not something I’d hold.”*
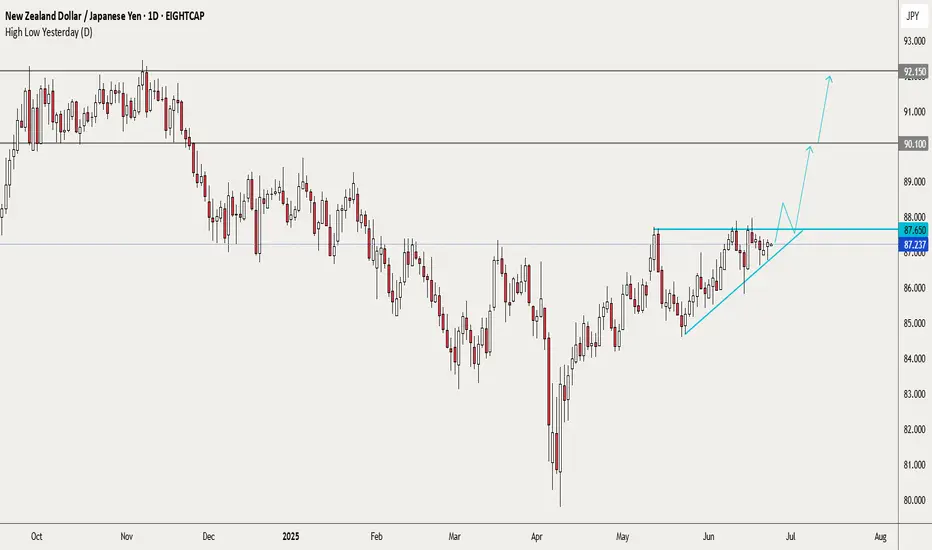
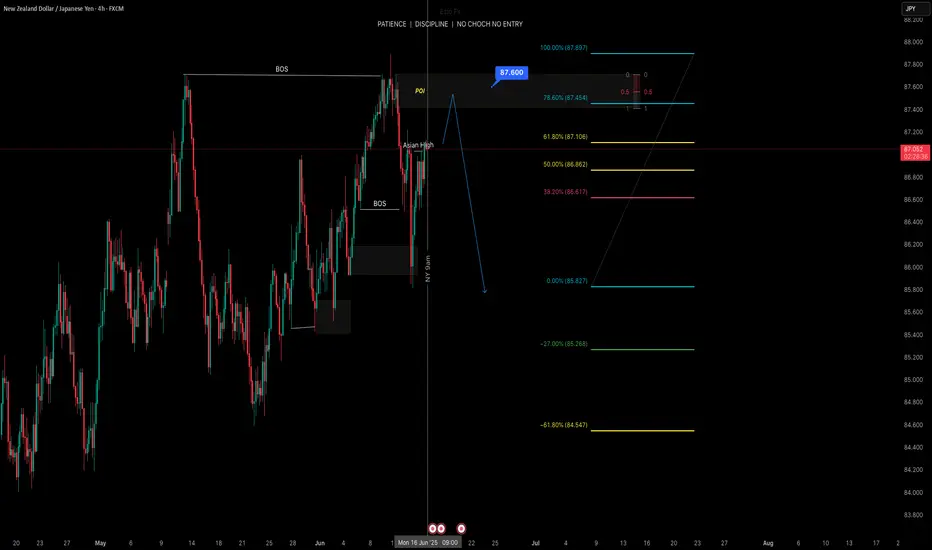
NZDJPY looks ready to breakoutThe area around 87.65 has been a solid resistance since early Feb. Time and again, price has been rejected there and recently the lows have become higher. The squeeze is on and I sense that another attempt to break out above will happen soon.
Will it succeed? I have no idea, we never do. But if there is a breakout and then a retest, I'll take the trade and take this as high as I can (within the limits of my discipline and patience) :)
This is not a trade recommendation; it’s merely my own analysis. Trading carries a high level of risk so carefully managing your capital and risk is important. If you like my idea, please give a “boost” and follow me to get even more.
It’s not whether you are right or wrong, but how much money you make when you are right and how much you lose when you are wrong – George Soros
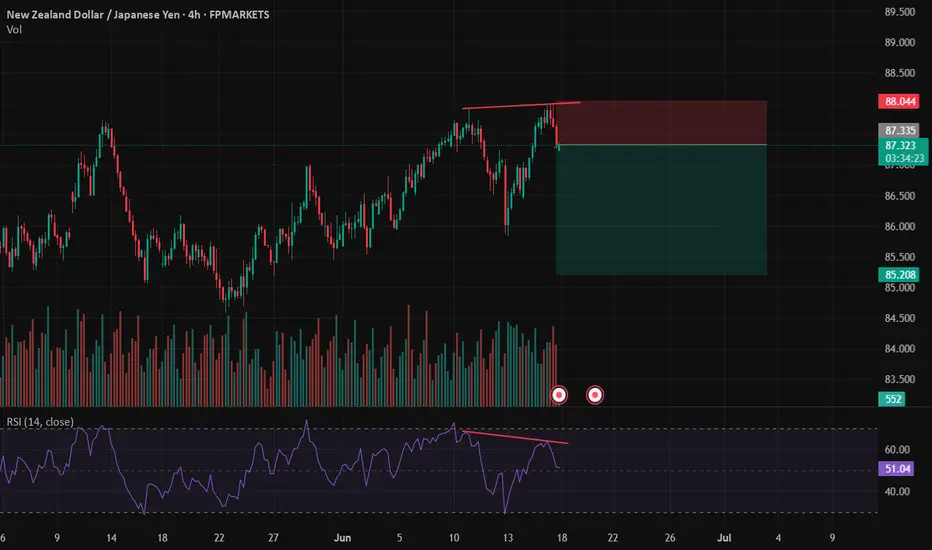
NZDJPY TECHNICAL AND FUNDAMENTALS DETAILED ANALYSISNZDJPY has just completed a bullish breakout from a well-defined symmetrical triangle on the 4H chart, confirming the start of a fresh impulsive move. Price action has broken cleanly above the descending trendline resistance around 87.400, supported by consecutive bullish candles with momentum. This breakout structure is signaling trend continuation, and I’m now targeting 89.500 as the next key resistance zone. The pair has also held higher lows consistently, showing strong bullish pressure in the medium term.
Fundamentally, the New Zealand Dollar remains supported by the Reserve Bank of New Zealand’s persistent hawkish stance. With the RBNZ maintaining higher interest rates to combat sticky domestic inflation, NZD has found strong backing in recent sessions. On the other hand, the Japanese Yen continues to weaken across the board, with the Bank of Japan maintaining ultra-loose monetary policy and no real signals of tightening. Japan’s latest inflation reading came in weaker than expected, further dimming any hawkish BOJ bets.
Today’s sentiment also reflects a global risk-on environment, with equities up and commodity-linked currencies like NZD benefiting. This reinforces bullish momentum in NZDJPY, especially as yield differentials between New Zealand and Japan favor carry trades. Technically, the pair could see brief pullbacks toward 87.100–86.900, which may offer fresh entries for bulls aiming to ride the breakout wave toward 89.500.
With technical confirmation, bullish momentum, and a supportive macro backdrop, NZDJPY looks well-positioned for further upside. I’ll be watching for sustained price action above the breakout zone, and any dips will be viewed as buying opportunities. The trend is up, and momentum is real—this is a textbook breakout setup aligned with both fundamentals and price action.

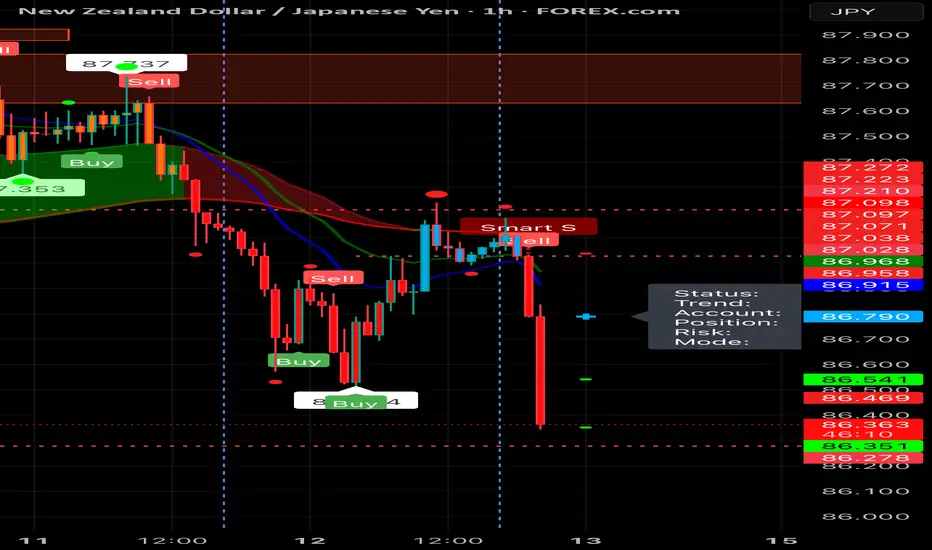
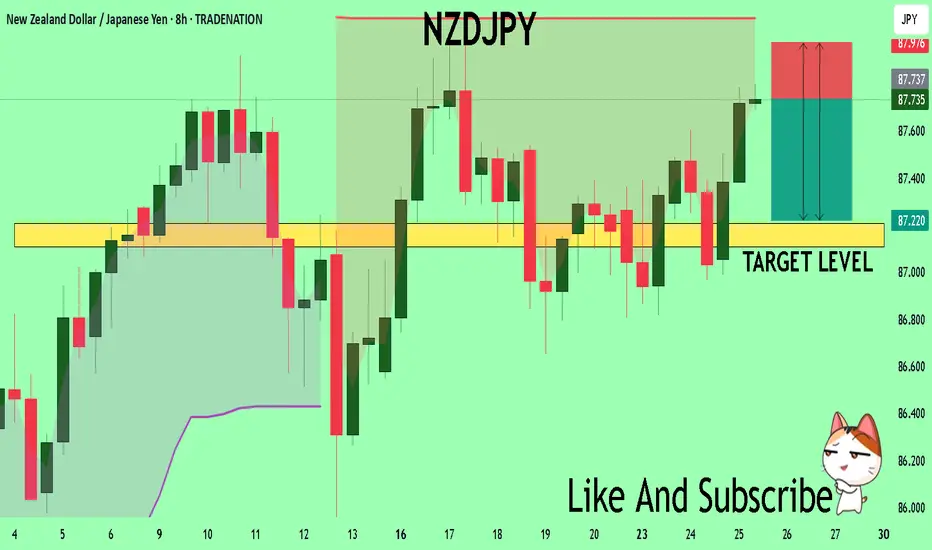
NZDJPY Buyers In Panic! SELL!
My dear subscribers,
My technical analysis for NZDJPY is below:
The price is coiling around a solid key level - 87.737
Bias - Bearish
Technical Indicators: Pivot Points Low anticipates a potential price reversal.
Super trend shows a clear sell, giving a perfect indicators' convergence.
Goal - 87.205
My Stop Loss - 87.976
About Used Indicators:
By the very nature of the supertrend indicator, it offers firm support and resistance levels for traders to enter and exit trades. Additionally, it also provides signals for setting stop losses
Disclosure: I am part of Trade Nation's Influencer program and receive a monthly fee for using their TradingView charts in my analysis.
———————————
WISH YOU ALL LUCK
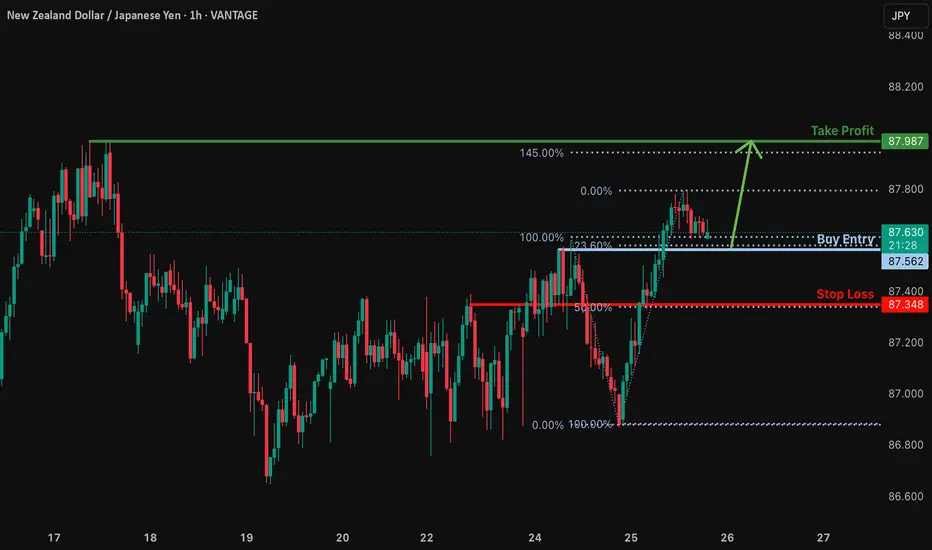
Bullish bounce?NZD/JPY is falling towards the support level which is a pullback support that lines up with the 23.6% Fibonacci retracement and could bounce from this level to our take profit.
Entry: 87.562
Why we like it:
There is a pullback support level that aligns with the 23.6% Fibonacci retracement.
Stop loss: 87.34
Why we like it:
There is a pullback support that aligns with the 50% Fibonacci retracement.
Take profit: 87.98
Why we like it:
There is a pullback resistance level that lines up with the 145% Fibonacci extension.
Enjoying your TradingView experience? Review us!
Please be advised that the information presented on TradingView is provided to Vantage (‘Vantage Global Limited’, ‘we’) by a third-party provider (‘Everest Fortune Group’). Please be reminded that you are solely responsible for the trading decisions on your account. There is a very high degree of risk involved in trading. Any information and/or content is intended entirely for research, educational and informational purposes only and does not constitute investment or consultation advice or investment strategy. The information is not tailored to the investment needs of any specific person and therefore does not involve a consideration of any of the investment objectives, financial situation or needs of any viewer that may receive it. Kindly also note that past performance is not a reliable indicator of future results. Actual results may differ materially from those anticipated in forward-looking or past performance statements. We assume no liability as to the accuracy or completeness of any of the information and/or content provided herein and the Company cannot be held responsible for any omission, mistake nor for any loss or damage including without limitation to any loss of profit which may arise from reliance on any information supplied by Everest Fortune Group.
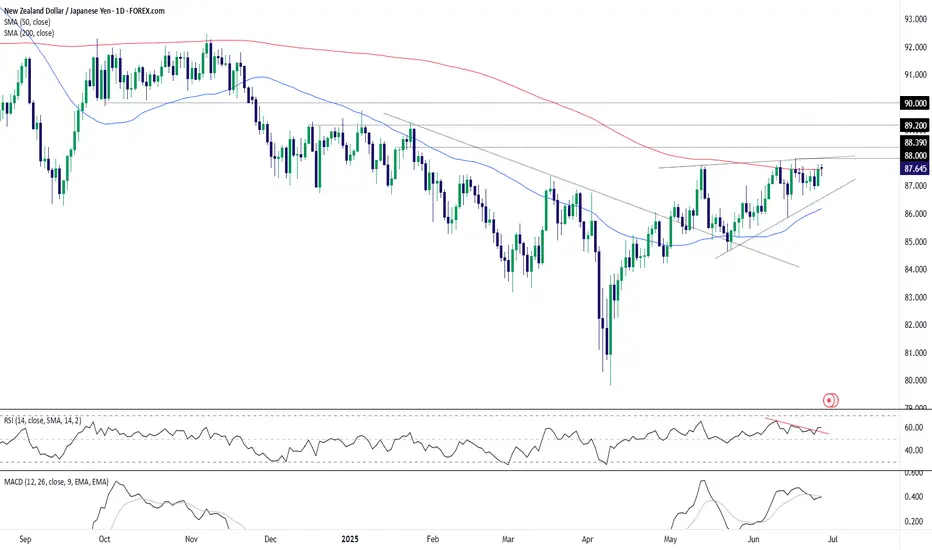
NZD/JPY: Bullish Breakout or Another Fade?NZD/JPY hasn’t closed above the 200-day moving average since July 2024, racking up more than ten failed bullish breaks in that time—seven of them in the past month alone. If today’s probe finds more traction, it could be the catalyst to bring bulls off the sidelines, especially on a close above 88.00 where wedge and horizontal resistance intersect.
If that plays out, traders could look to initiate longs above 88.00 with a stop below it or the 200-day moving average for protection. Minor resistance sits at 88.39, offering a nearby hurdle for the setup. Should that give way, 89.20 or 90.00 stand out as logical upside targets.
Alternatively, if the pair fails at the 200-day moving average again, the setup could flip, allowing shorts to be established beneath the level with a stop above for protection. 87.00 or wedge support around 50 pips lower may come into play as downside targets.
Momentum indicators favour upside near term. RSI (14) has broken its downtrend and moved further above 50, while MACD is on the cusp of a bullish crossover, confirming the signal.
Good luck!
DS
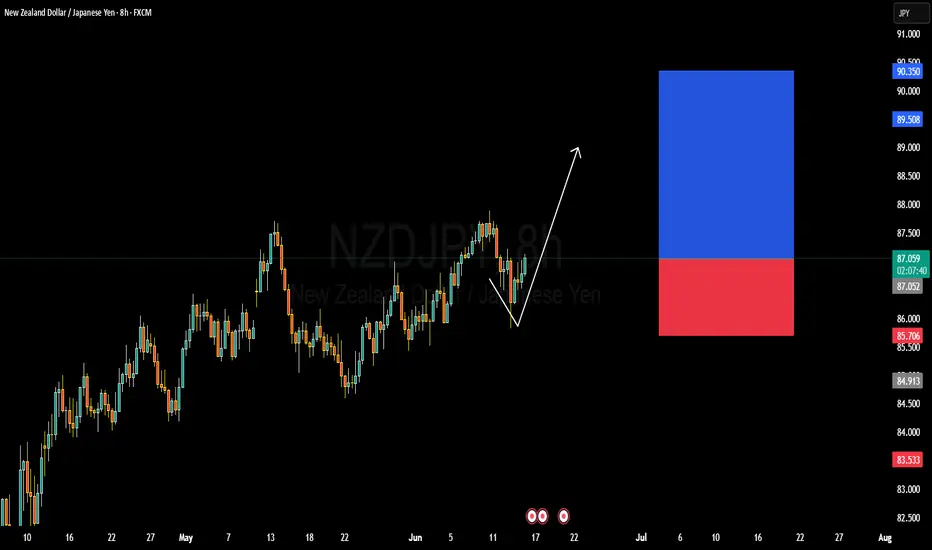
NZDJPY TECHNICALS AND FUNDAMENTALS DETAILED ANALYSISNZDJPY is currently trading around the 87.00 handle and has just bounced strongly from a well-respected support zone. The pair is now showing clear signs of recovery after a brief corrective dip, and price action on the 8H chart confirms a bullish reversal structure. The support held firmly, and we’ve already seen a solid rejection wick forming the foundation of this new impulsive leg up. With this momentum in play, I’m targeting the 90.00 zone in the coming sessions.
On the macro front, the New Zealand dollar is benefiting from a relatively hawkish RBNZ stance. Inflation pressures remain sticky in New Zealand, and the central bank has reiterated its cautious approach toward rate cuts. Meanwhile, the Japanese yen remains under persistent selling pressure due to the Bank of Japan's ultra-loose policy and intervention uncertainty. These diverging central bank outlooks are fueling continued upside in NZDJPY as carry trade flows remain in favor of the kiwi.
From a technical perspective, the market structure remains bullish. After retesting a previous higher low, price is climbing within a clean channel and has broken minor resistance levels convincingly. This aligns well with a swing continuation pattern toward the 90.00 mark. Momentum is supported by increasing bullish volume, and as long as we remain above 86.00, the bulls are firmly in control.
In my analysis, this is a textbook setup. We’re seeing higher lows, strong trend continuation, and a macro-backed directional bias. I’m long from 87.00 with a bullish outlook into 90.00. I’ll reassess price action as we approach major resistance levels, but until then, I remain confidently positioned with a clear technical and fundamental confluence.
Double TopAnother double top with divergency on the oscillator. The divergency didn't quite start at the overbought zone but will give it a go.
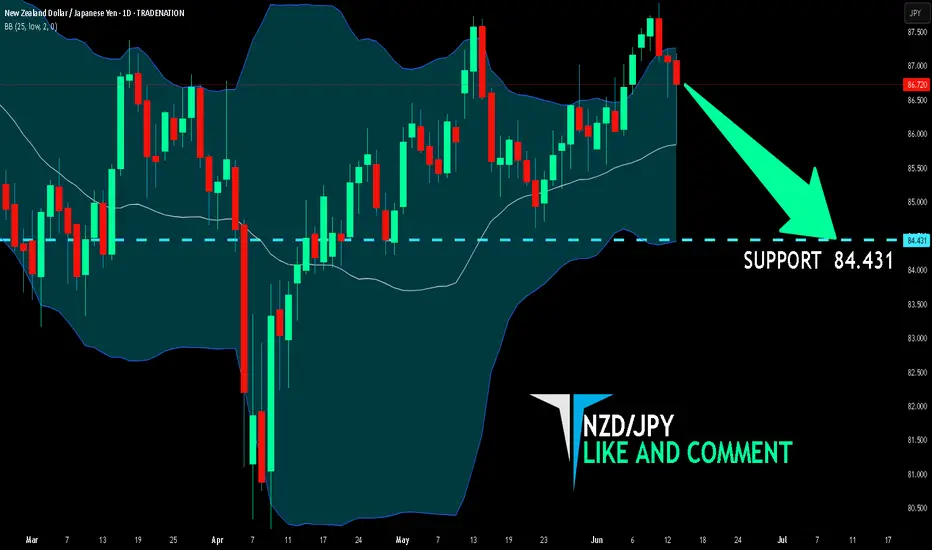
NZD/JPY BEARS WILL DOMINATE THE MARKET|SHORT
Hello, Friends!
NZD/JPY pair is trading in a local uptrend which we know by looking at the previous 1W candle which is green. On the 1D timeframe the pair is going up too. The pair is overbought because the price is close to the upper band of the BB indicator. So we are looking to sell the pair with the upper BB line acting as resistance. The next target is 84.431 area.
Disclosure: I am part of Trade Nation's Influencer program and receive a monthly fee for using their TradingView charts in my analysis.
✅LIKE AND COMMENT MY IDEAS✅
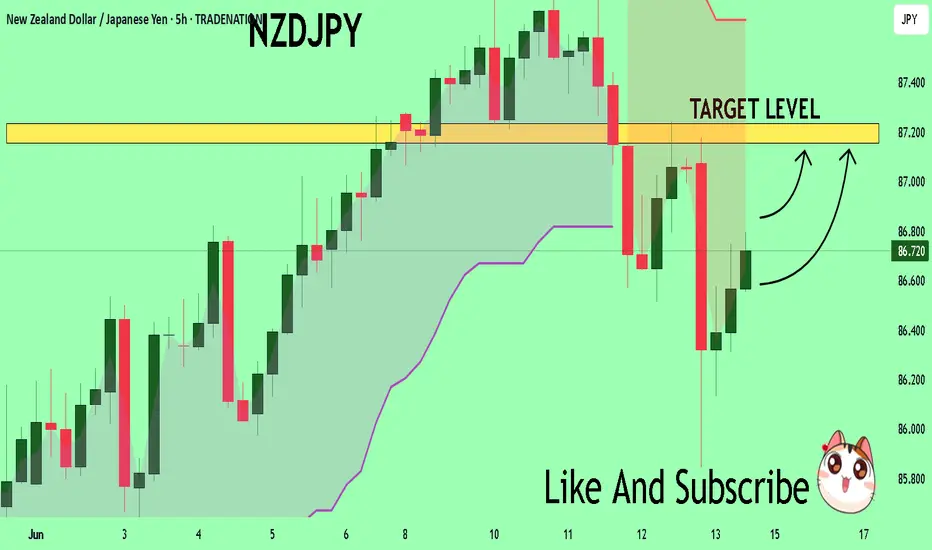
NZDJPY Set To Grow! BUY!
My dear friends,
Please, find my technical outlook for NZDJPY below:
The instrument tests an important psychological level 86.740
Bias - Bullish
Technical Indicators: Supper Trend gives a precise Bullish signal, while Pivot Point HL predicts price changes and potential reversals in the market.
Target - 87.156
About Used Indicators:
Super-trend indicator is more useful in trending markets where there are clear uptrends and downtrends in price.
Disclosure: I am part of Trade Nation's Influencer program and receive a monthly fee for using their TradingView charts in my analysis.
———————————
WISH YOU ALL LUCK
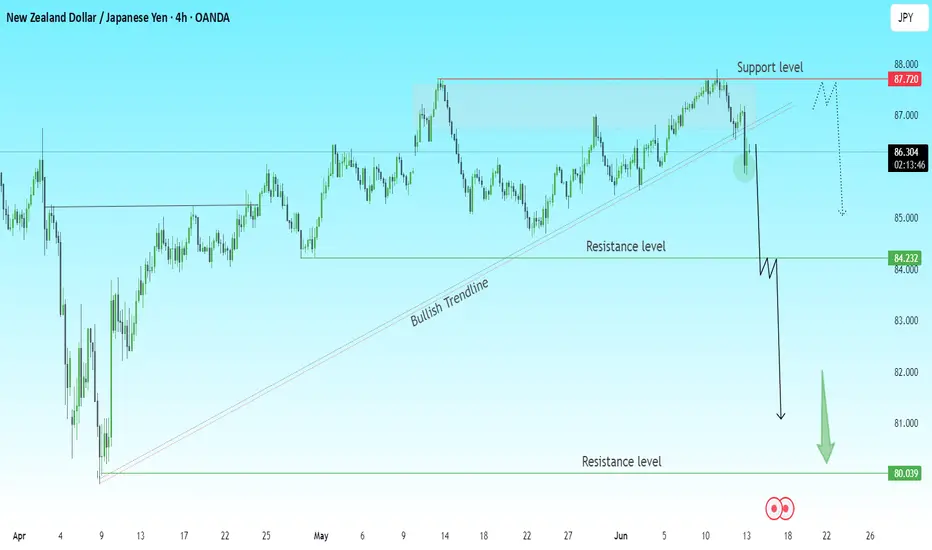
NZDJPY Breakdown Setup Alert | Technical AnalysisThe NZDJPY pair has broken the bullish trendline, signaling a possible shift in momentum.
Key Observations:
Price rejected the 87.720 resistance level
Clear break and close below the trendline
Pullback expected before continuation down
Targets:
📉 First support: 84.232
📉 Final support: 80.039
🔄 A retest of the broken trendline or horizontal resistance could offer a clean short entry opportunity.
Bearish Bias remains valid unless price reclaims and closes above 87.720.
💬 What do you think? Is this the start of a deeper correction for NZDJPY?
📈 Drop your thoughts and let’s discuss!
#NZDJPY #Forex #PriceAction #TrendlineBreak #TechnicalAnalysis #TradingView
NZDJPY BEARISH SETUPNZDJPY has been a bullish trend.
At rsi bearish divergence formed and also rising wedge reversal pattern formed.
I took short trade with sell stop order.

Idea on a chartNZDJPY great chart 78.6 fib is where i will look at rejections on H1 and M30.
Have you been paying attention to commodities?
People are talking about the next ‘commodity supercycle’.
That’s a fun word for all commodity prices going up a lot. The theory goes that it started in 2020 in the aftermath of the pandemic but it’s really only been gold that has been rising since then. Now the other commodities are starting to wake up..
In last week’s report (week 23), we talked about the EPIC breakout in silver.
Gold and silver have now potentially been joined by the ‘big boss’ of commodities - oil.
Regular readers will remember we talked about oil in our final report of 2024 asking whether it will be ‘Top trade of 2025’. Well it still might be - just not in the way we expected. More on that in a minute.
If you decided to listen to me you welcome It respected resistance and went straight down like I expected