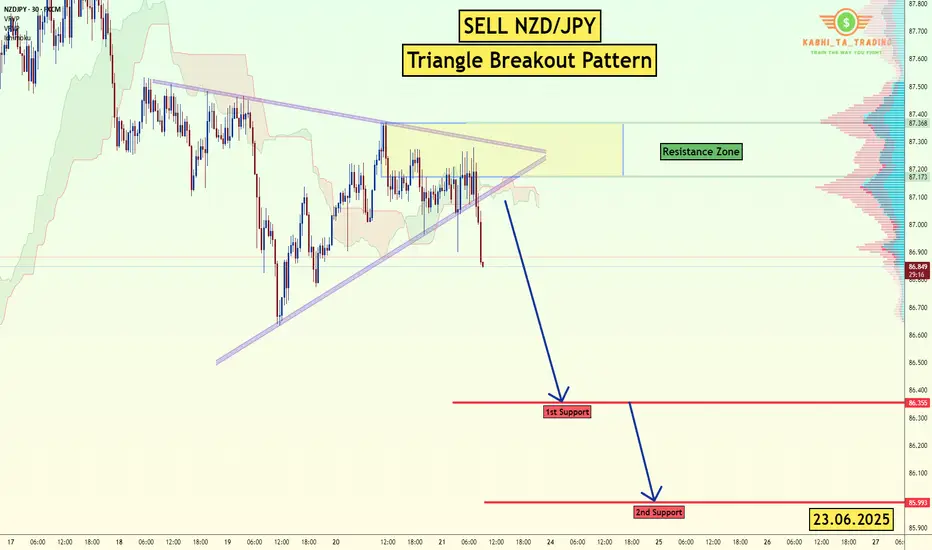
NZD/JPY - Triangle Breakout (23.06.2025)The NZD/JPY Pair on the H1 timeframe presents a Potential Selling Opportunity due to a recent Formation of a Triangle Breakout Pattern. This suggests a shift in momentum towards the downside in the coming hours.
Possible Short Trade:
Entry: Consider Entering A Short Position around Trendline O
Related currencies
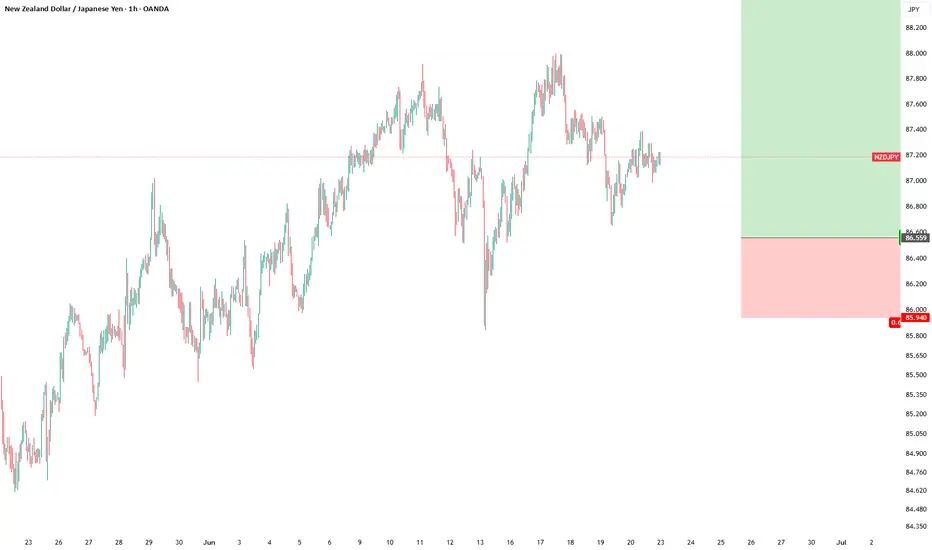
CHECK NUZJPY SIGNAL READ CAPTAINDirection: Short (Sell Setup)
Entry Zone: Around 87.700\87.650
Stop Loss: 87.950
Take Profits:
TP1: ~87.450
TP2: ~87.200
Final Target: 86.950

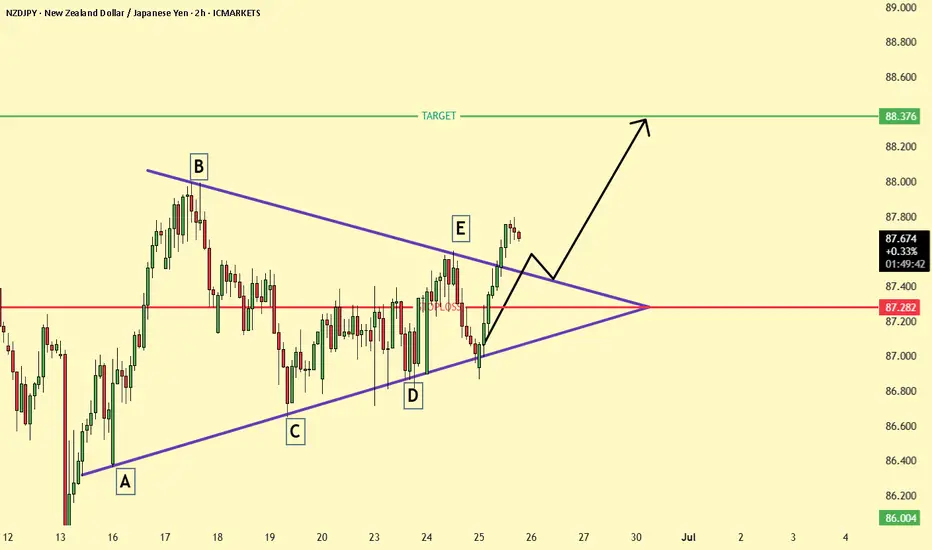
NZD/JPY 2H Chart – Bullish Breakout from Symmetrical TriangleNZD/JPY has broken out of a symmetrical triangle pattern formed by points A to E, signaling a potential bullish continuation. The breakout above the triangle resistance occurred near the 87.3 zone, with price currently pulling back slightly for a possible retest. If the retest holds, the pair is lik
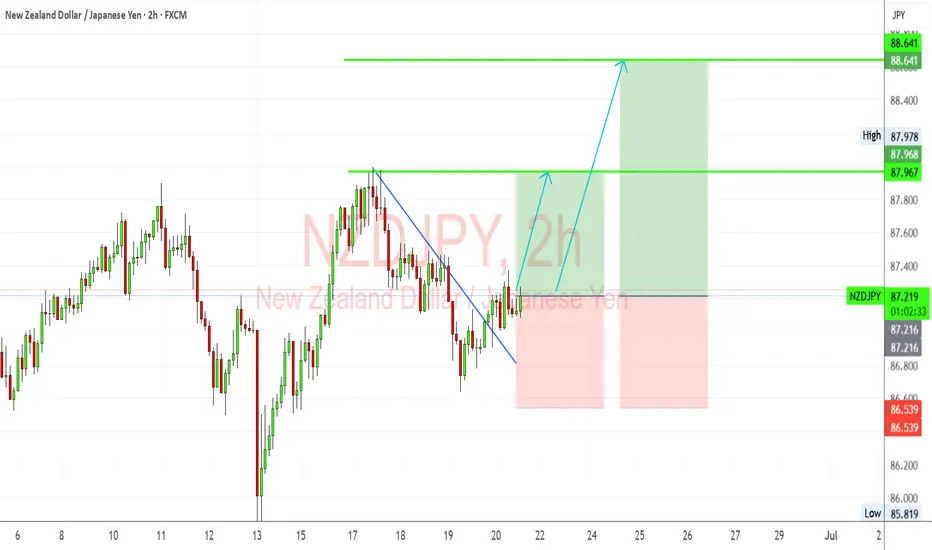
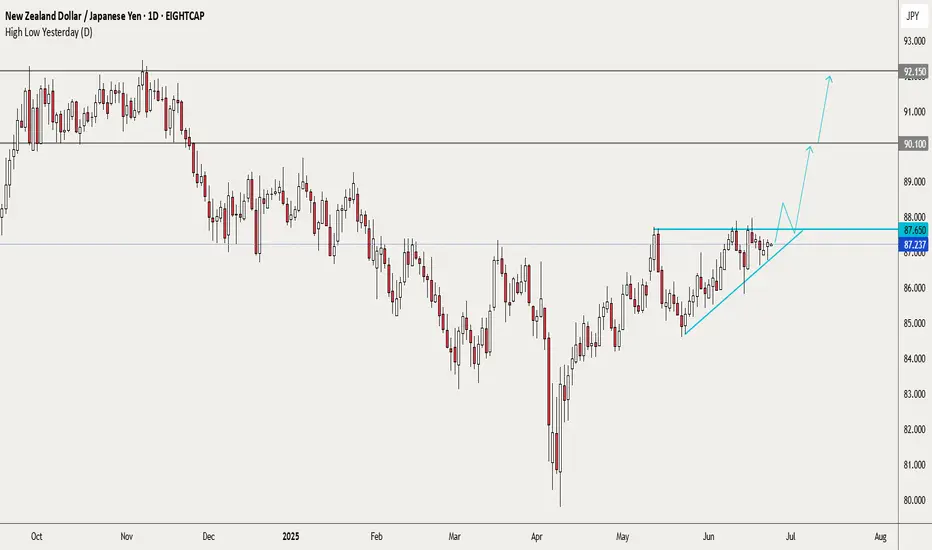
NZDJPY “Kiwi Poised to Fly as Japan Muddles ThroughNZDJPY shows a bullish breakout from a descending trendline, with bullish structure holding near 87.20–87.25.
Key resistance targets:
87.97 (Previous high)
88.64 (Next resistance / projected fib target)
Two upside scenarios are shown:
Conservative target: ~87.97
Aggressive swing: ~88.64
If 87
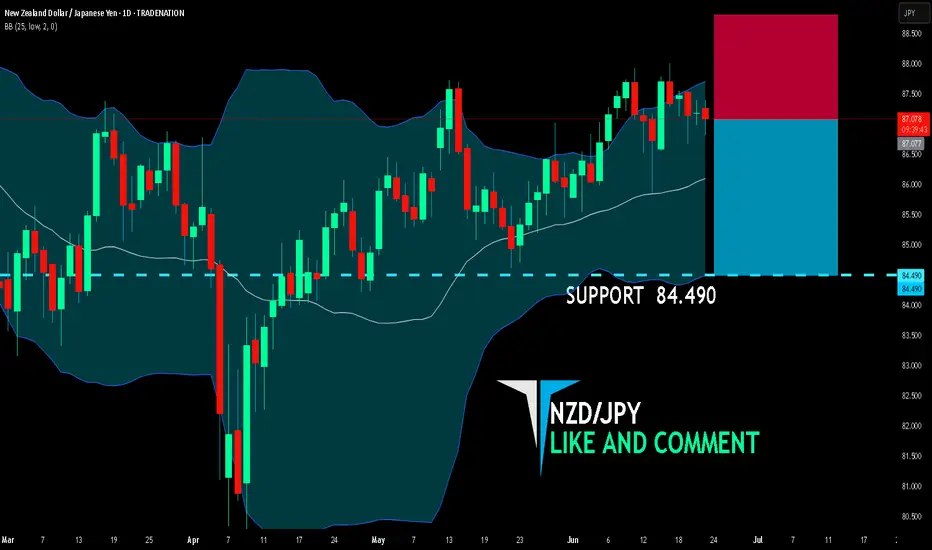
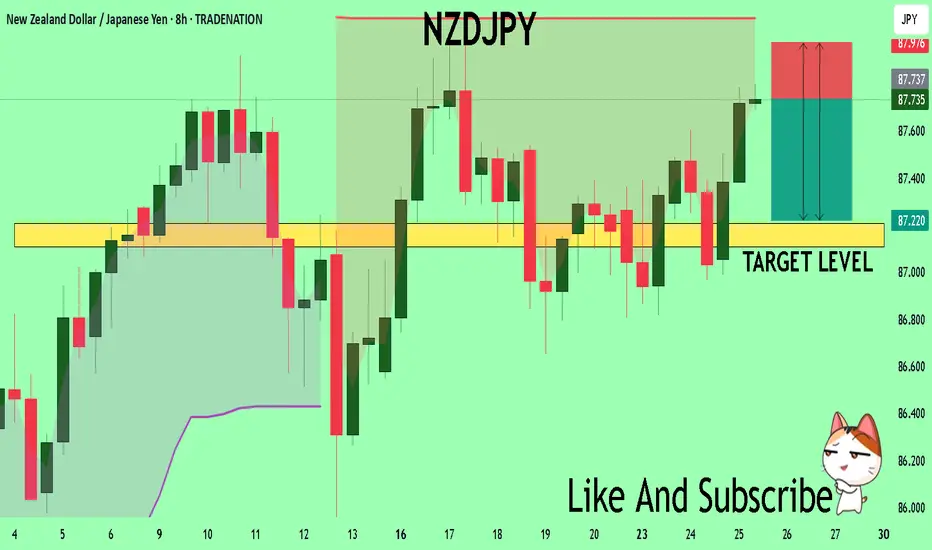
NZD/JPY BEARS WILL DOMINATE THE MARKET|SHORT
NZD/JPY SIGNAL
Trade Direction: short
Entry Level: 87.077
Target Level: 84.490
Stop Loss: 88.805
RISK PROFILE
Risk level: medium
Suggested risk: 1%
Timeframe: 1D
Disclosure: I am part of Trade Nation's Influencer program and receive a monthly fee for using their TradingView charts in my analysi
Trade Idea: Long NZD/JPY (Short-Term Only) **📈 Trade Idea: Long NZD/JPY (Short-Term Only)**
**Bias:** 🎯 Slightly Bullish
**Timeframe:** 🕒 Short-Term (cautious entry)
**Key Zone:** Needs to stay above 94.50 — upside may fade around 96.00
---
### **💡 Why Consider NZD/JPY Long?**
**🇳🇿 New Zealand Dollar (NZD):**
* **Risk sentiment weak, C
NZDJPY looks ready to breakoutThe area around 87.65 has been a solid resistance since early Feb. Time and again, price has been rejected there and recently the lows have become higher. The squeeze is on and I sense that another attempt to break out above will happen soon.
Will it succeed? I have no idea, we never do. But if ther
NZDJPY TECHNICAL AND FUNDAMENTALS DETAILED ANALYSISNZDJPY has just completed a bullish breakout from a well-defined symmetrical triangle on the 4H chart, confirming the start of a fresh impulsive move. Price action has broken cleanly above the descending trendline resistance around 87.400, supported by consecutive bullish candles with momentum. This

NZDJPY Buyers In Panic! SELL!
My dear subscribers,
My technical analysis for NZDJPY is below:
The price is coiling around a solid key level - 87.737
Bias - Bearish
Technical Indicators: Pivot Points Low anticipates a potential price reversal.
Super trend shows a clear sell, giving a perfect indicators' convergence.
Goal - 8
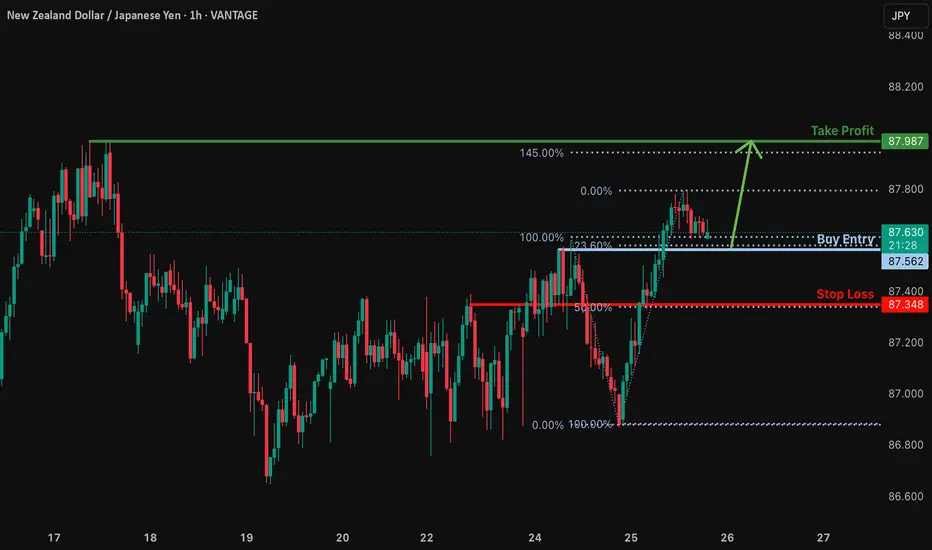
Bullish bounce?NZD/JPY is falling towards the support level which is a pullback support that lines up with the 23.6% Fibonacci retracement and could bounce from this level to our take profit.
Entry: 87.562
Why we like it:
There is a pullback support level that aligns with the 23.6% Fibonacci retracement.
Stop lo
See all ideas
Displays a symbol's price movements over previous years to identify recurring trends.
Frequently Asked Questions
The value of the NZDJPY pair is quoted as 1 NZD per x JPY. For example, if the pair is trading at 1.50, it means it takes 1.5 JPY to buy 1 NZD.
NZDJPY is a minor currency pair, i.e. a popular pair that is not associated with USD. Such pairs are also called cross currency pairs.
Currencies are usually traded through forex brokers — choose the one that suits your needs and go ahead. You can trade NZDJPY right from TradingView charts — just log in to you broker account. Check out the list of our integrated brokers and find the best one for your needs and strategy.