#OGN Ready For a Massive Bullish Move | Must Watch For BullsYello, Paradisers! Is #OriginProtocol about to explode to the upside, or is this a bull trap in disguise waiting to liquidate the impatient? Let’s break down what’s brewing on #OGNUSDT:
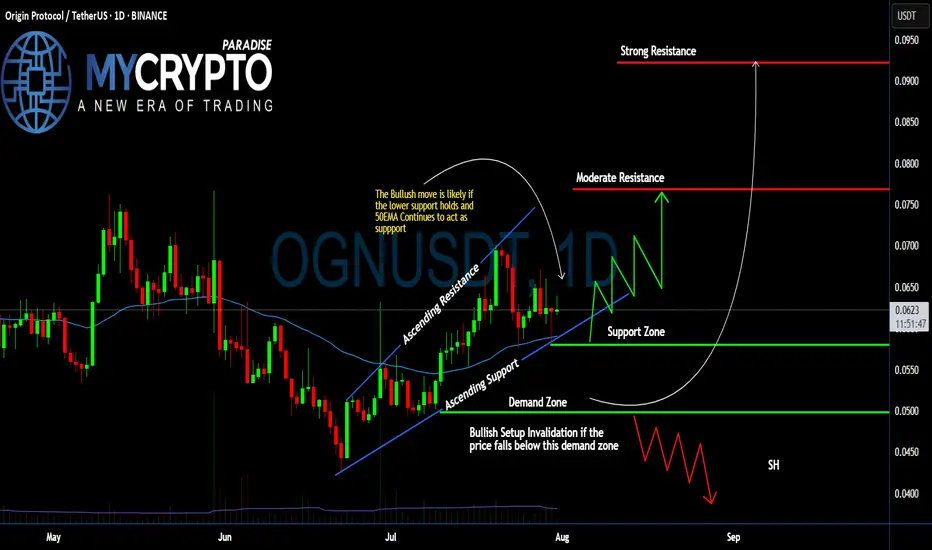
💎After forming a clean ascending channel, #OGN has been respecting both the ascending resistance and ascending support levels. Price is currently trading just above the 50 EMA, which has been acting as a dynamic support line since early July. This structure shows clear buyer interest around the $0.058–$0.062 zone—an area that aligns with volume cluster support.
💎The bullish scenario remains valid as long as #OGNUSD holds above the demand zone between $0.0499–$0.0580, and especially if it stays above the 50 EMA. As long as this structure is maintained, we could see a bounce toward the moderate resistance level at $0.076, where previous sellers stepped in and price stalled.
💎If buyers can break through that moderate resistance with strength and rising volume, the next key target lies at $0.092, which aligns with a strong resistance level and high-volume node on the visible range. This area is likely to trigger a reaction, so traders should remain agile.
💎However, if price breaks down below the demand zone, this would invalidate the current bullish setup and open the door for a potential move back toward the $0.045–$0.040 area. A broader shakeout would likely accompany this and could trap many late long entries.
Stay patient, Paradisers. Let the breakout confirm, and only then do we strike with conviction.
MyCryptoParadise
iFeel the success🌴
OGNUSDT trade ideas
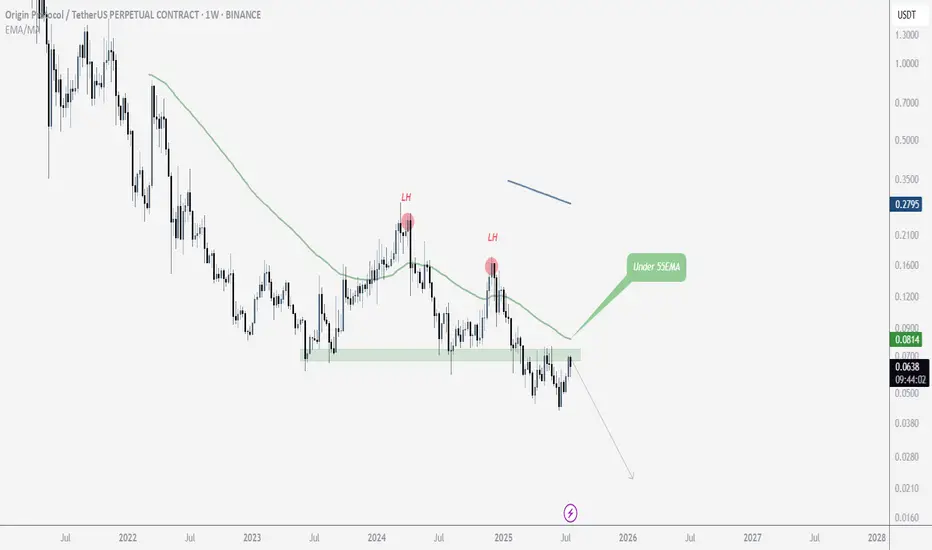
$OGN OGN is in a broader downtrend on the weekly timeframe, consistently forming lower highs (LH). This presents a good opportunity to consider entering a short position. It's worth keeping an eye on it
OGNUSDT Breakout Alert Descending Trendline Reversal
📊 Pattern and Market Structure
Descending Trendline Breakout:
OGN has successfully broken out of a long-standing descending trendline, signaling a potential shift from a bearish to a bullish trend.
Strong Accumulation Zone / Key Support:
The price has consistently respected the $0.04268 - $0.05402 support area, forming a solid demand zone with multiple rejections and prolonged consolidation.
Potential Reversal Formation:
A double bottom / base consolidation pattern seems to be forming within the support zone, reinforcing the likelihood of a bullish reversal.
📈 Bullish Scenario
If the breakout is confirmed (price holds above and successfully retests the trendline), the bullish targets will be:
1. $0.06229 – minor resistance, likely first retest area.
2. $0.07000 - $0.07432 – previous horizontal resistance zone.
3. $0.08118 – prior distribution zone.
4. $0.09500 - $0.10302 – mid-range supply zone.
5. $0.11000 - $0.12733 – medium-term potential target.
6. $0.14601 - $0.16232 – longer-term target on strong momentum.
📌 A daily candle close above $0.06229 with significant volume could confirm further bullish continuation.
📉 Bearish Scenario
If the breakout turns out to be a false breakout, and price falls back below the support zone ($0.05402):
Expect a drop toward:
$0.04268 – the next major support level.
A breakdown below this may lead to $0.03800 or the formation of a new lower low.
Possible bearish triggers:
Rejection at $0.06229 or above.
Weak breakout volume.
Overall bearish sentiment in the crypto market.
📌 Conclusion:
The descending trendline breakout indicates a potential bullish reversal.
Strong support at the base adds confluence to the setup.
Bullish scenario currently has higher probability, but confirmation and volume are crucial for sustained upside.
#OGNUSDT #CryptoAnalysis #TechnicalAnalysis #AltcoinBreakout #CryptoSignals #BullishReversal #DescendingTrendline #BreakoutAlert #OGN #OriginProtocol
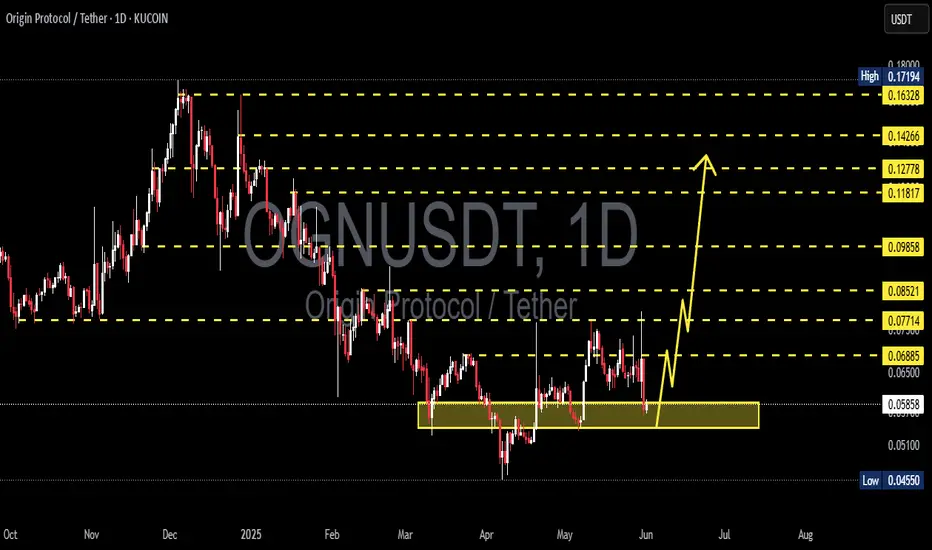
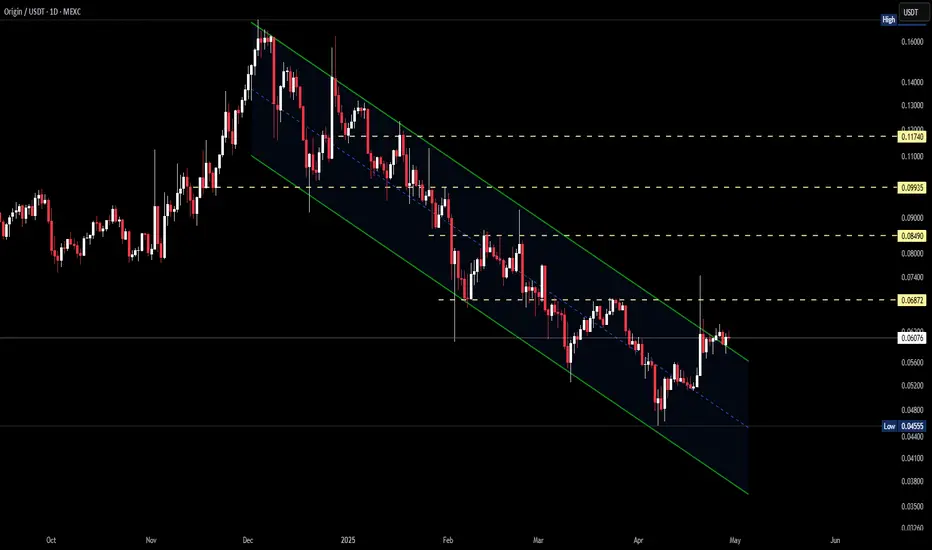
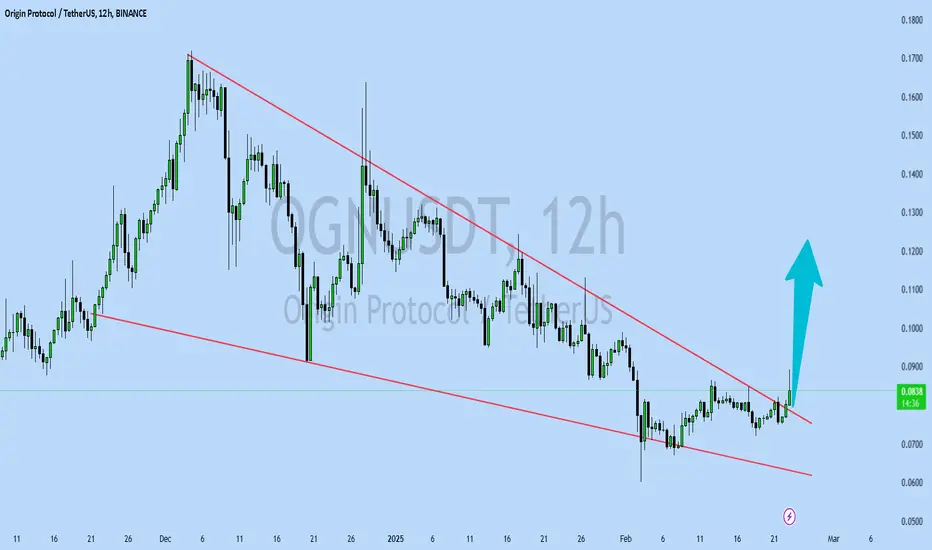
OGNUSDT Forming Descending ChannelOGNUSDT is displaying a promising reversal opportunity as it forms a clear descending channel on the daily chart. This technical setup signals that Origin Protocol could be gearing up for a breakout move, especially with the recent price action testing the upper boundary of the channel. A successful breakout above this resistance zone could unlock significant upside potential, setting the stage for a healthy bullish wave that traders will want to monitor closely.
Volume analysis for OGNUSDT is equally supportive, showing consistent buying interest that hints at accumulation by investors positioning early for a trend reversal. With good volume backing the price action, the probability of a confirmed breakout above the descending channel increases, which can accelerate momentum buying and attract fresh capital inflows. This kind of setup often draws the attention of swing traders and trend-followers looking for high-probability moves.
The expected gain for OGNUSDT in this scenario sits around 60% to 70%+, which is a reasonable target given the recent lows and the potential to reclaim previous levels of support turned resistance. The broader market sentiment towards altcoins is also improving, with many investors rotating funds into projects with strong recovery patterns. Origin Protocol’s fundamentals, coupled with this technical outlook, make it an appealing candidate for medium-term gains.
Traders should keep an eye on daily closes above the channel resistance and watch for confirmation signals like retests and continuation candles. Managing risk is key, but with investors taking renewed interest in this project, OGNUSDT is a crypto pair worth keeping on the watchlist for the next breakout phase.
✅ Show your support by hitting the like button and
✅ Leaving a comment below! (What is You opinion about this Coin)
Your feedback and engagement keep me inspired to share more insightful market analysis with you!

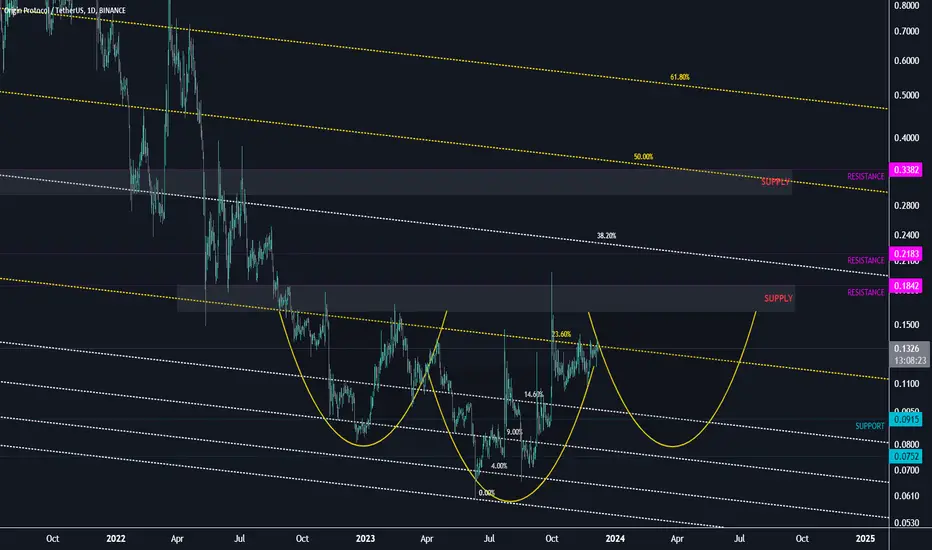
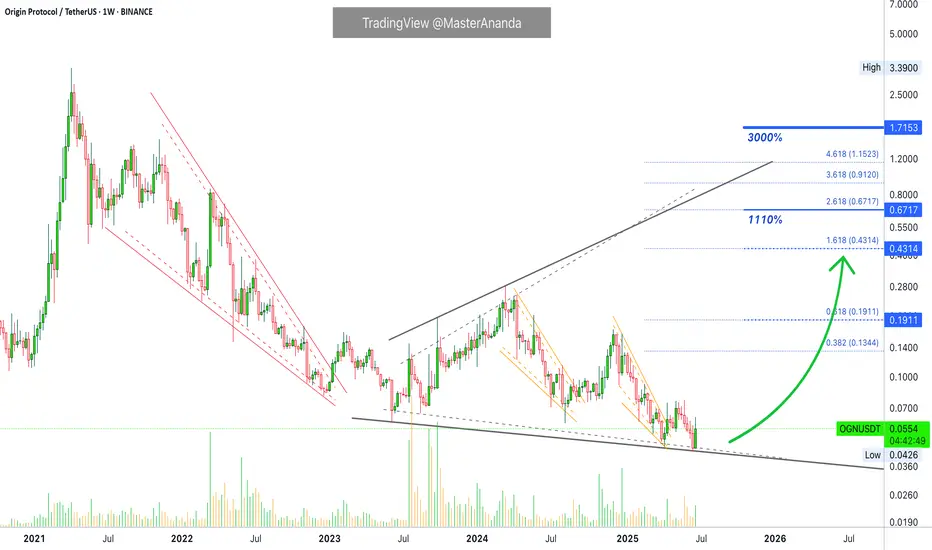
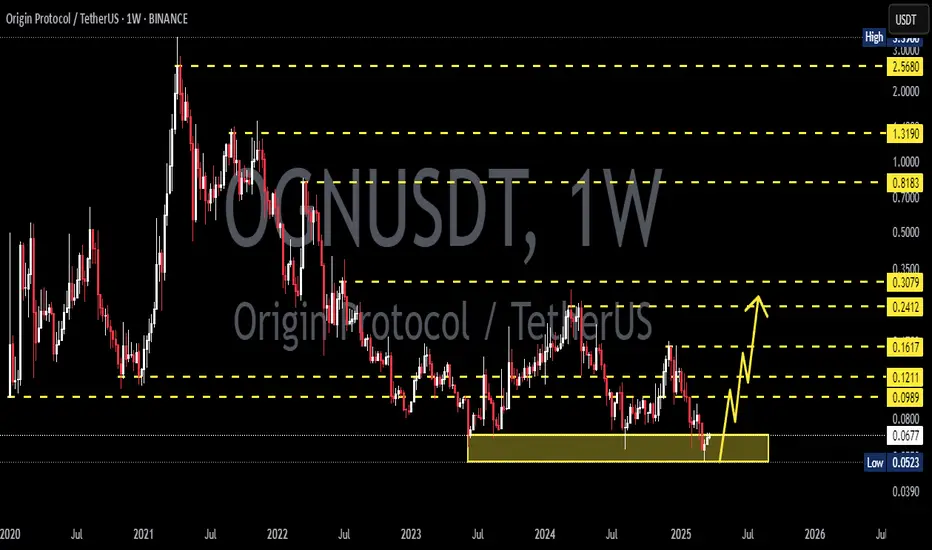
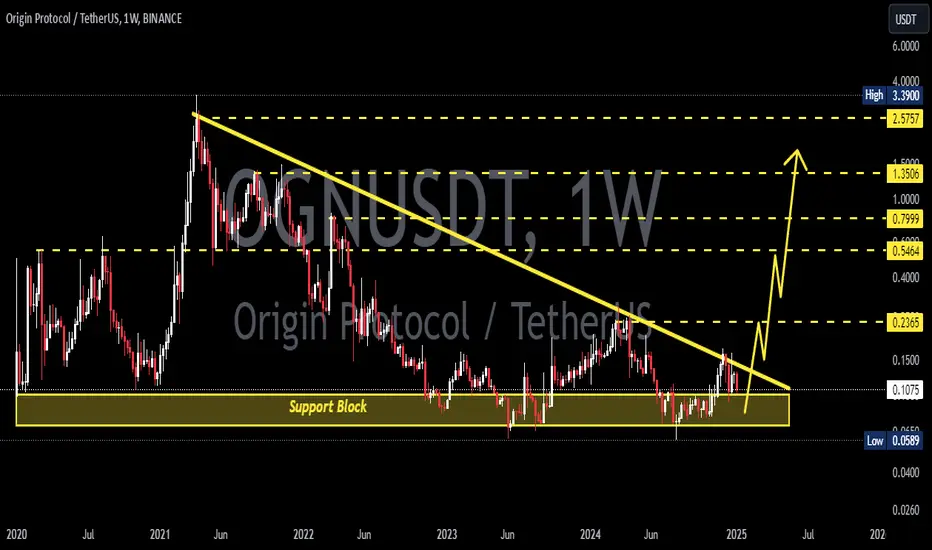
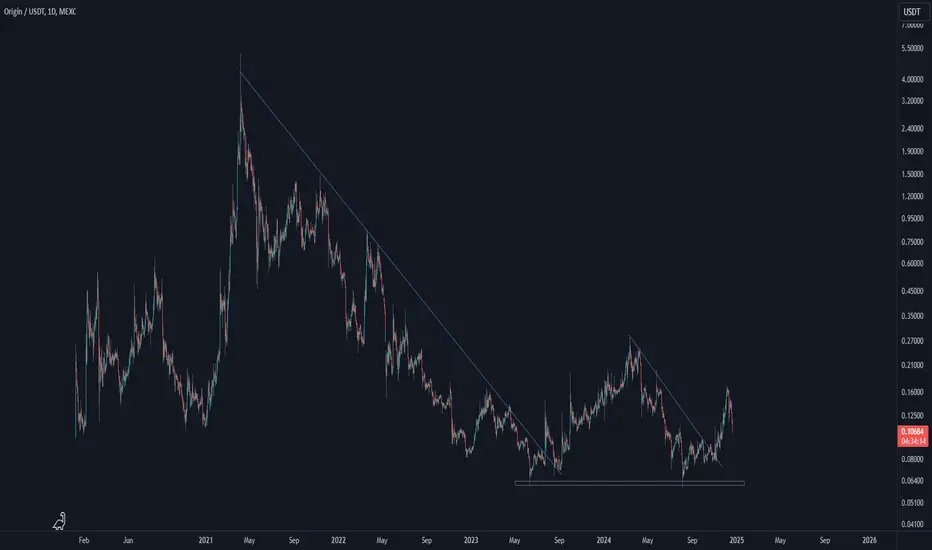
Origin Protocol 1110% Target Explained & 3000% Prev-Bull MarketOrigin Protocol has been moving within a massive broadening channel since December 2022. Now trading within its lower boundary. The upper boundary works as resistance while the lower boundary works as support. Whenever the action starts to happen close to the lower boundary this becomes a buy-opportunity, this entry can be used either for the short- or long-term. With the current market situation, the best focus is long-term. A 6 months time window.
Origin Protocol (OGNUSDT) produced a 3,000%+ bullish wave back in the 2021 bull market. We know for a fact now that this pair can produce wild gains. The price that launched this wave was 0.1068, the peak was 3.39. In comparison, the bottom in 2025 stands at 0.0426. The next peak can be anything but we have plenty of room available for growth. On the chart I have a 1,110% target and this is an easy one. This project is likely to grow 2,000% or more. Can be 3,000%. 1,110% is the safe, strong, easy target.
Thank you for reading.
Namaste.
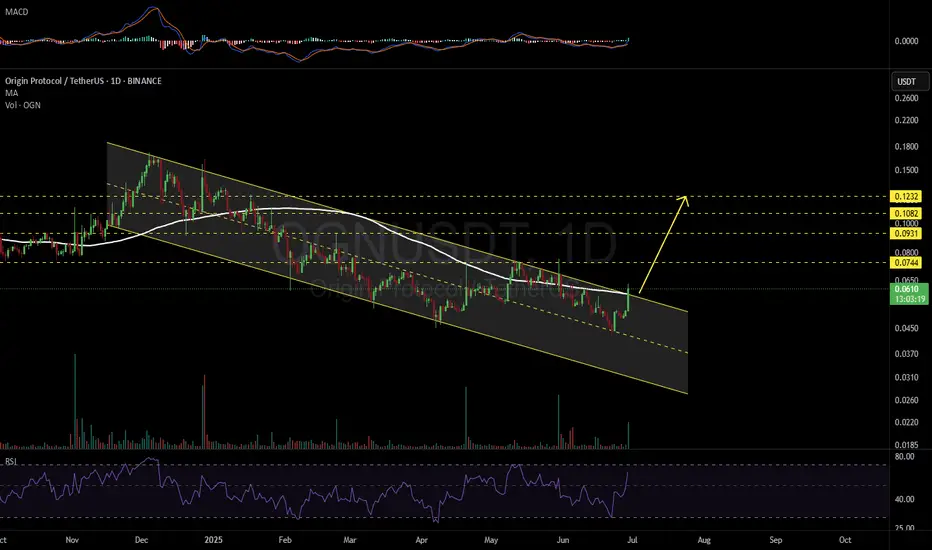
OGNUSDT 1D#OGN is breaking out above the descending channel resistance and the MA100 on the daily chart.
In case of a successful retest of the channel, the targets are:
🎯 $0.0744
🎯 $0.0931
🎯 $0.1082
🎯 $0.1232
⚠️ Always use a tight stop-loss to manage risk and protect your capital.
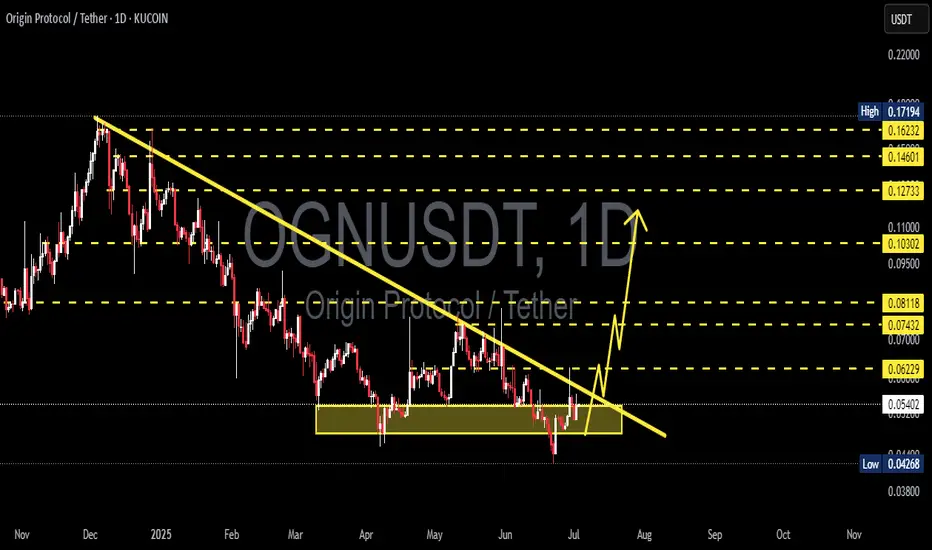
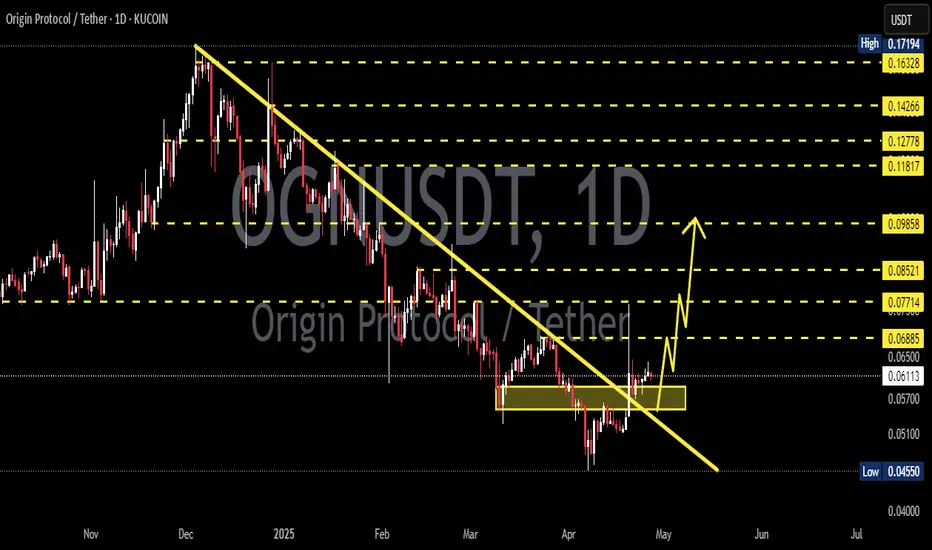
OGNUSDT 1D AnalysisOGN ~ 1D Analysis
#OGN Buy in increments from here with a short term target of at least 15%+ and a long term target of $0.172
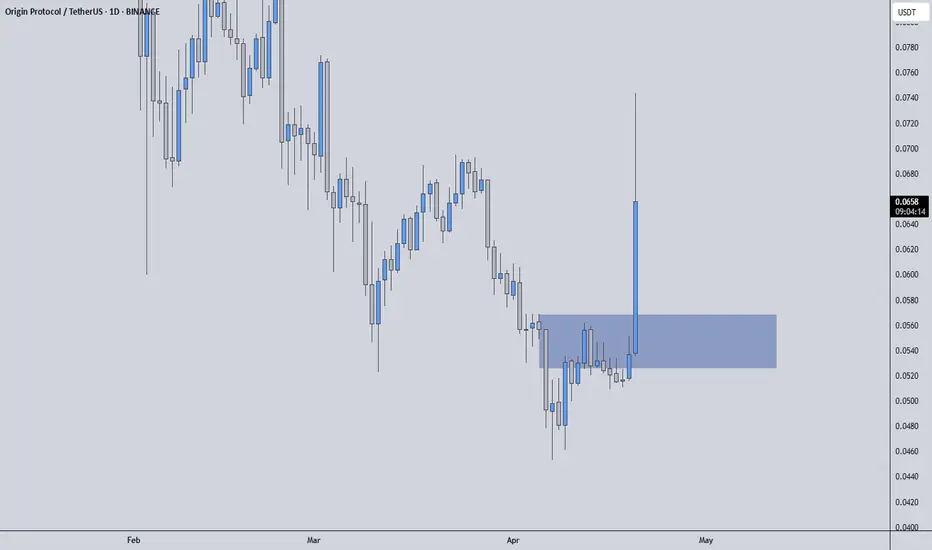
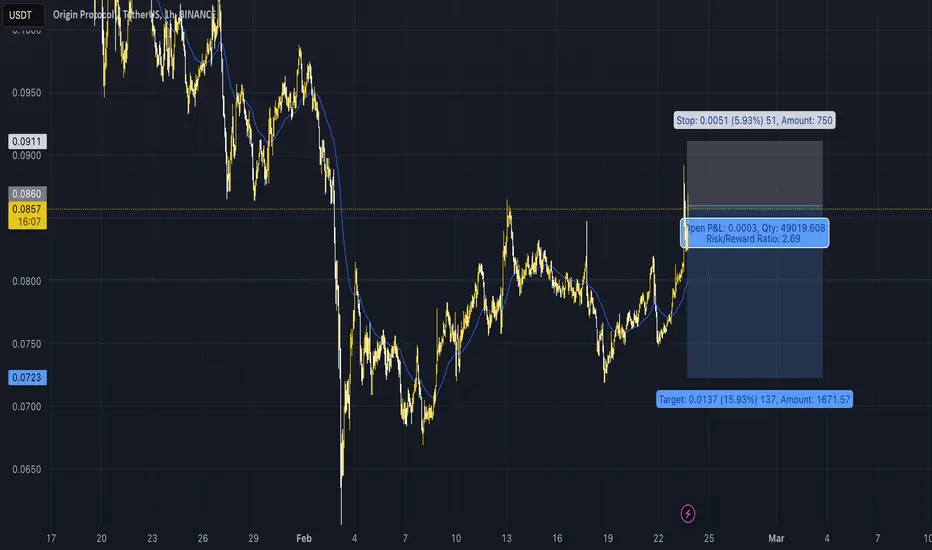
OGNUSDT | One of Today’s Highest Volume Gainers – +32.44% OGNUSDT just saw an impressive surge in trading activity, surging over thirty percent in volume today. When you spot a coin with that kind of interest, you know smart money is involved and you pay attention.
🟦 Blue Box = Key Support Zone
• This area has shown reliable buyer reactions before. As price approaches, you’ll naturally look for a rebound.
• If OGN dips into the blue box and holds, a measured long can be considered—just wait for lower‑timeframe confirmations on price action and CDV confluences.
📈 How to Trade This Move
Entry with Confidence
Watch for price to touch the blue box and then form a clean higher‑low on a 5‑ or 15‑minute chart. That’s your green light.
Manage Your Risk
Place a stop just below the blue box. If your trigger doesn’t hold, you exit quickly.
Adaptive Mindset
If instead OGN breaks decisively below the blue box with volume, shift out of longs and look for a retest of that level as resistance—this ability to adapt is why followers trust my analysis.
🤝 Why Follow These Levels?
Every zone I share comes from watching real orderflow and proven patterns in the market. These setups have built my high success rate—just check my profile. Most traders guess entries; you’ll be acting on clear, data‑backed signals.
Stay patient, let the market prove itself, and then step in with conviction. That’s how you trade smarter and avoid emotional mistakes.
📌I keep my charts clean and simple because I believe clarity leads to better decisions.
📌My approach is built on years of experience and a solid track record. I don’t claim to know it all but I’m confident in my ability to spot high-probability setups.
📌If you would like to learn how to use the heatmap, cumulative volume delta and volume footprint techniques that I use below to determine very accurate demand regions, you can send me a private message. I help anyone who wants it completely free of charge.
🔑I have a long list of my proven technique below:
🎯 ZENUSDT.P: Patience & Profitability | %230 Reaction from the Sniper Entry
🐶 DOGEUSDT.P: Next Move
🎨 RENDERUSDT.P: Opportunity of the Month
💎 ETHUSDT.P: Where to Retrace
🟢 BNBUSDT.P: Potential Surge
📊 BTC Dominance: Reaction Zone
🌊 WAVESUSDT.P: Demand Zone Potential
🟣 UNIUSDT.P: Long-Term Trade
🔵 XRPUSDT.P: Entry Zones
🔗 LINKUSDT.P: Follow The River
📈 BTCUSDT.P: Two Key Demand Zones
🟩 POLUSDT: Bullish Momentum
🌟 PENDLEUSDT.P: Where Opportunity Meets Precision
🔥 BTCUSDT.P: Liquidation of Highly Leveraged Longs
🌊 SOLUSDT.P: SOL's Dip - Your Opportunity
🐸 1000PEPEUSDT.P: Prime Bounce Zone Unlocked
🚀 ETHUSDT.P: Set to Explode - Don't Miss This Game Changer
🤖 IQUSDT: Smart Plan
⚡️ PONDUSDT: A Trade Not Taken Is Better Than a Losing One
💼 STMXUSDT: 2 Buying Areas
🐢 TURBOUSDT: Buy Zones and Buyer Presence
🌍 ICPUSDT.P: Massive Upside Potential | Check the Trade Update For Seeing Results
🟠 IDEXUSDT: Spot Buy Area | %26 Profit if You Trade with MSB
📌 USUALUSDT: Buyers Are Active + %70 Profit in Total
🌟 FORTHUSDT: Sniper Entry +%26 Reaction
🐳 QKCUSDT: Sniper Entry +%57 Reaction
📊 BTC.D: Retest of Key Area Highly Likely
📊 XNOUSDT %80 Reaction with a Simple Blue Box!
📊 BELUSDT Amazing %120 Reaction!
I stopped adding to the list because it's kinda tiring to add 5-10 charts in every move but you can check my profile and see that it goes on..
OGN LongOGN Buy gradually after successfully penetrating this resistant line with a short -term target of at least 10%+.
OGNUSDT 1D AnalysisOGN ~ 1D Analysis
#OGN Buy gradually from here if you still have a Conviction on this coin with a short -term target of at least 10%+.
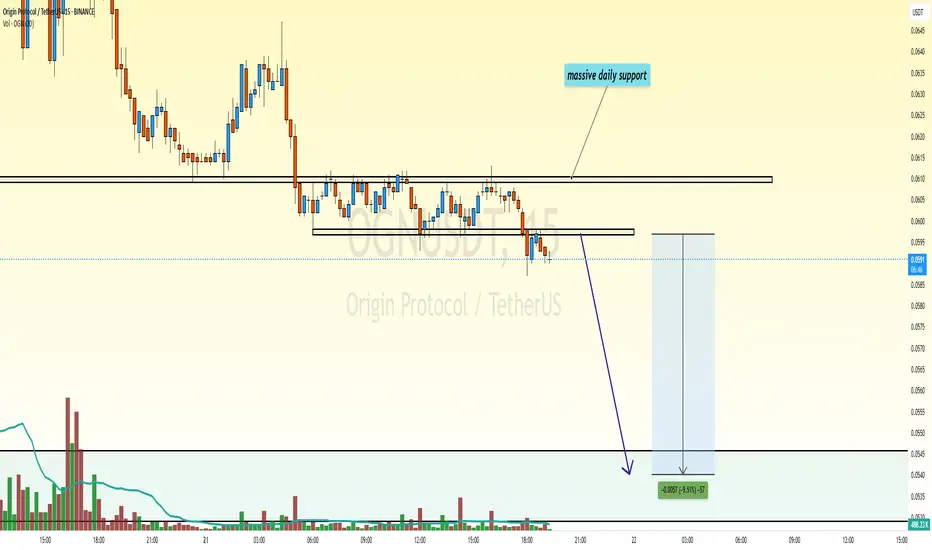
OGN still more to drop in the short term.looking at OGN i can see a break of this daily support . it started ranging here with a new support created which looks to have been broken with a retest now . more downside i think.
this is not financial advice.
OGNUSDT 1WOGN ~ 1W Analysis
#OGN This trade is very high risk. Buy from here with a short -term target of at least 20%+. This is the lowest support for now.
OGN SHORT !!!SHORT
#OGN/USDT
Entry zone : 0.0876 - 0.0854
Targets : 0.0846 - 0.0829 - 0.0812 - 0.0795 - 0.0778 - 0.0761 - 0.0744 - 0.0726
Stop loss :0.091057
OGNUSDT UPDATEOGNUSDT is a cryptocurrency trading at $0.0835. Its target price is $0.1200, indicating a potential 50%+ gain. The pattern is a Bullish Falling Wedge, a reversal pattern signaling a trend change. This pattern suggests the downward trend may be ending. A breakout from the wedge could lead to a strong upward move. The Bullish Falling Wedge is a positive signal, indicating a potential price surge. Investors are optimistic about OGNUSDT's future performance. The current price may be a buying opportunity. Reaching the target price would result in significant returns. OGNUSDT is poised for a potential breakout and substantial gains.
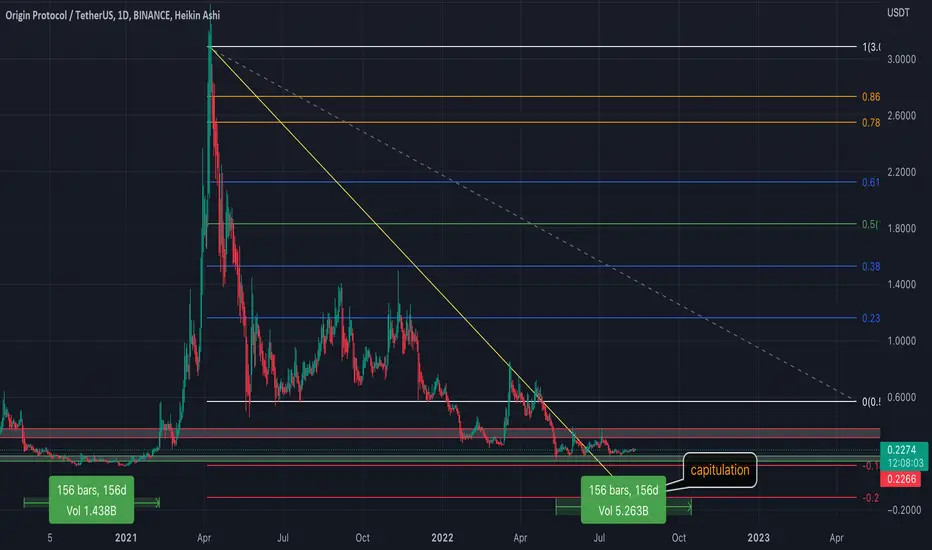
OGN and 155 accumulation daysBINANCE:OGNUSDT
✅Before we start to discuss, I would be glad if you share your opinion on this post's comment section and hit the like button if you enjoyed it.
Thank you.
Last time after capitulation in 2020 OGN spent around 155 days in accumulation zone before move up!
If history rhymes we can see like almost all alts move up around October / November 2022
Possible Targets
➡️Red block - local resistance sellers zone
➡️Green box yearly support zone
➡️Capitulation can be realise if BTC drop again to 17K so alts can loose -70% from this current price! and its will be one more retest downtrend line
Hope you enjoyed the content I created, You can support with your likes and comments this idea so more people can watch!
✅Disclaimer: Please be aware of the risks involved in trading. This idea was made for educational purposes only not for financial Investment Purposes.
OGNUSDT 1WOGN ~ 1W
#OGN Buy gradually inside this pattern,. when Bullish returns it will be pumped hard. Minimum target 20%++
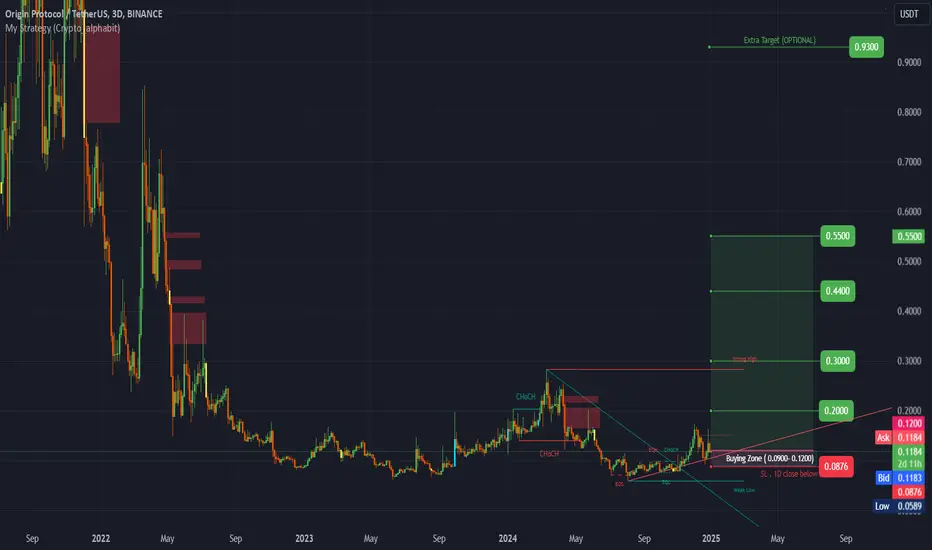
#OGN (SPOT) entry (0.0900- 0.1200)T.(0.5500) SL(0.0876)BINANCE:OGNUSDT
#OGN/ USDT
Entry ( 0.0900- 0.1200)
SL 1D close below 0.0876
T1 0.2000
T2 0.3000
T3 0.4400
T4 0.5500
1 Extra Targets(optional) in chart, if you like to continue in the trade with making stoploss very high.
______________________________________________________________
Golden Advices.
********************
* collect the coin slowly in the entry range.
* Please calculate your losses before the entry.
* Do not enter any trade you find it not suitable for you.
* No FOMO - No Rush , it is a long journey.
Useful Tags.
****************
My total posts
tradingview.sweetlogin.com
1Million Journey
tradingview.sweetlogin.com
tradingview.sweetlogin.com
**********************************************************************************************
#Manta #OMNI #DYM #AI #IO #XAI #ACE #NFP #RAD #WLD #ORDI #BLUR #SUI #VOXEL #AEVO #VITE #APE #RDNT #FLUX #NMR #VANRY #TRB #HBAR #DGB #XEC #ERN #ALT #IO #ACA #HIVE #ASTR #ARDR #PIXEL #LTO #AERGO #SCRT #ATA #HOOK #FLOW #KSM #HFT #MINA #DATA #SC #JOE #RDNT #IQ #CFX #BICO #CTSI #KMD #FXS #DEGO #FORTH #AST #PORTAL #CYBER #RIF #ENJ #ZIL #APT #GALA #STEEM #ONE #LINK #NTRN #COTI #RENDER #ICX #IMX #ALICE #PYR #PORTAL #GRT #GMT #IDEX #NEAR #ICP #ETH #QTUM #VET #QNT #API3 #BURGER #MOVR #SKL #BAND #ETHFI #SAND #IOTX #T #GTC #PDA #GMX #REZ #DUSK #BNX #SPELL #POWR #JOE #TIA #TFUEL #HOT #AVAX #WAXP #OGN
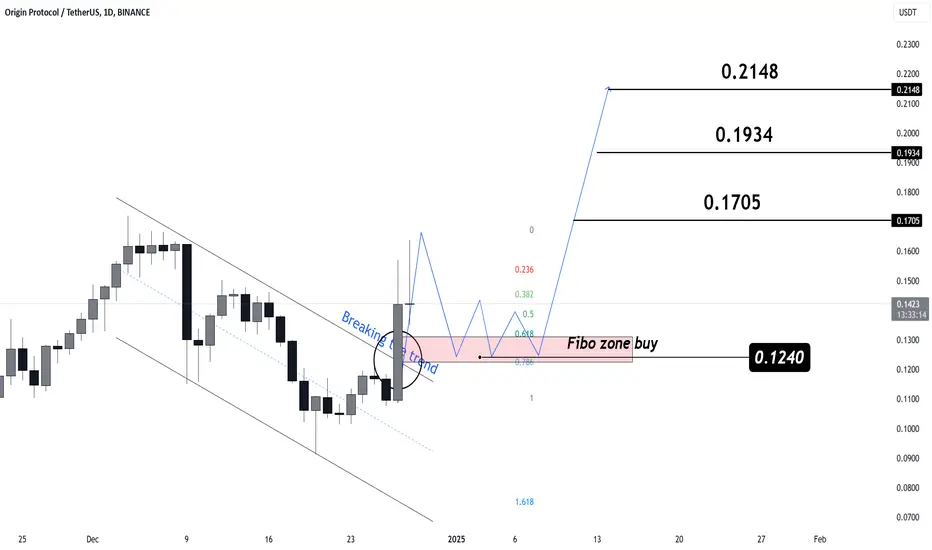
Origin Protocol ($OGN/USDT) Technical AnalysisOrigin Protocol ($OGN/USDT) Technical Analysis
#OGN is currently trading at $0.1411, showing bullish potential after breaking out of a descending trendline. The price is now consolidating above the Fibonacci zone near $0.1240, which acts as a strong support for potential upward movement.
Support Zone (Fibonacci Buy): $0.1240
Target 1 (T1): $0.1705
Target 2 (T2): $0.1934
Target 3 (T3): $0.2148
Quick Trade Opportunity with OGNUSDT🌟 Quick Trade Opportunity with OGNUSDT! 🌟
📊 Trade Plan:
Entry Point: Around $0.111 – Accumulate in this range for a strong setup.
Target: +40% – Aiming for substantial short-term gains.
Hold Time: Up to 3 days – Ideal for quick profit-taking.
🔍 Strategy Insights:
OGNUSDT shows strong momentum for a short-term move.
Market conditions and volume trends support a quick upward breakout.
🚀 Next Steps:
Monitor Entry: Wait for confirmation near the target range.
Set Take Profit: Secure gains at the 40% target.
Follow Updates: Stay alert for any market changes during the trade.
💡 Note: This is not financial advice. Always DYOR before trading.
🔥 OGNUSDT is ready for a short-term move – Position yourself wisely! 🔥
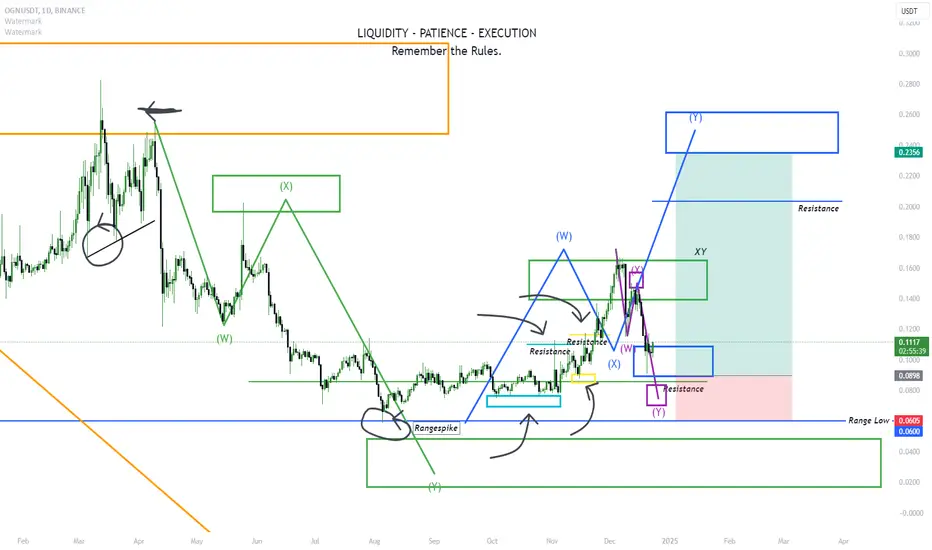
Overall bullish picture for OGNWe've activated a large overarching orange structure and formed a lower low, but the negative target level is unlikely as prices can't go negative. So, this structure serves as context rather than a strict guide.
The more relevant structure now is the green one. We've reacted from the target zone, formed a lower low, and turned at resistance. The XY level pushed the price down after an over-correction. This opens the possibility of reaching the original target level, creating a new overarching lower low or range low.
However, the overall market activity shows a willingness to trade both ways, as indicated by the light blue structure and the strong wick, suggesting pressure. Since we're still trading within the purple structure and its target isn't reached, I'll handle the market by opening positions at the end of the reversal zone. Given the previous range spike, I don't expect another, and I'll consider the green target invalid. My entry, stop loss, and take profit are set accordingly.
I'll move my stop loss to break even once we activate the dark blue structure by forming a higher high. Also, I'll take 30% of my position off at the resistance line.
I hope those confident enough to trade this can secure some profits.
Origin Protocol (OGN)Origin Protocol is one of Ethereum’s longest-standing DeFi projects, featuring a multichain feature set that unlocks vast opportunities for yield generation for Origin’s liquid staking across the various blockchains.
Anyway, OGN chart seems promising. OGN broke the major downtrend line, made a double bottom, then broke the minor downtrend line too. Have to wait and see how high OGN can go. Let's see what happens.
Is #OGN Ready for a Bullish Reversal or More Downward Move?Yello, Paradisers! Is #OGNUSDT finally going for the breakout or another fake-out? Let's dive into the latest analysis of #OriginProtocol!
💎After 4-5 months of a slow and steady downtrend, #OGN is approaching a critical turning point. The price is currently testing the upper boundary of a Descending Channel, fueled by a strong bounce from the major support zone between $0.072 and $0.078.
💎To truly spark this rally, #OGN needs to clear a key obstacle—the minor resistance between $0.114 and $0.155, which previously acted as a strong support level. A breakout above this area, confirmed by increasing volume and the 20 EMA, could mean the bulls are ready to take over. If this happens, brace yourselves for a move toward the next major resistance.
💎If momentum stalls, we could see a pullback toward that crucial support zone between $0.072 and $0.078, retesting the breakout level. Failing to hold here could spell trouble, with #OGN potentially sliding back down to the $0.059 demand zone.
💎And here’s the real risk—if it breaks below that support, the bears will likely regain control, triggering a deeper correction and crushing any hopes of a short-term bullish recovery.
Stay focused, patient, and disciplined, Paradisers🥂
MyCryptoParadise
iFeel the success🌴

OGNUSDT ACCUMULATIONOGNUSDT ACCUMULATION, looking at forming ISHS or else it should breakout from the current resistance of FIB channel