Full Breakdown of My Trading Strategy Dow Futures DaytradingI will be detailing my strategy to both help others and to help myself fine tune my strategy.
My strategy is one of market maker cycles. The end goal: to trade off of the Daily chart by drilling down to the 15 minutes for entries. Everything revolves around the Daily chart. The only indicator I us
Related futures
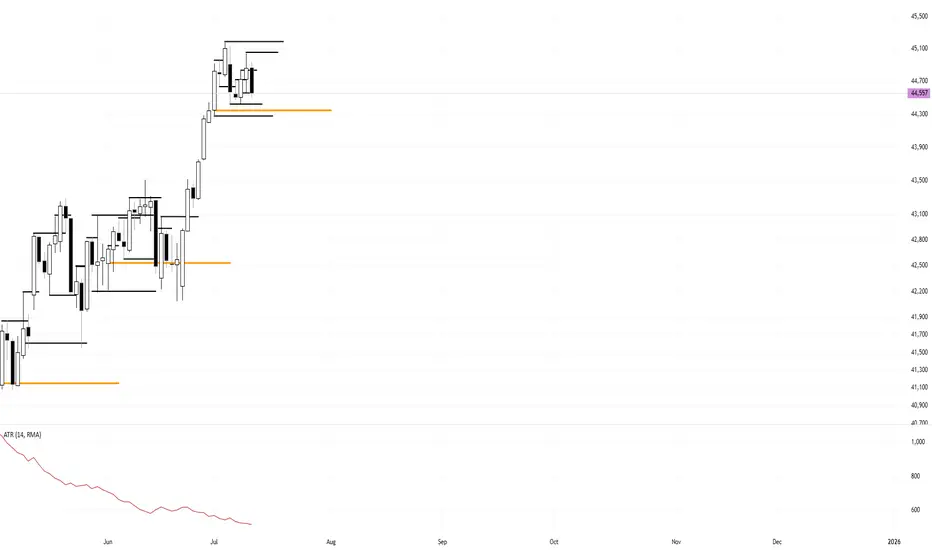
DOW JONES-MYM -SELL PREDICTIONThe market has created a new weekly high. Im expecting a short sell off in the upcoming week down into the weekly FVG. Then possible move to the upside.

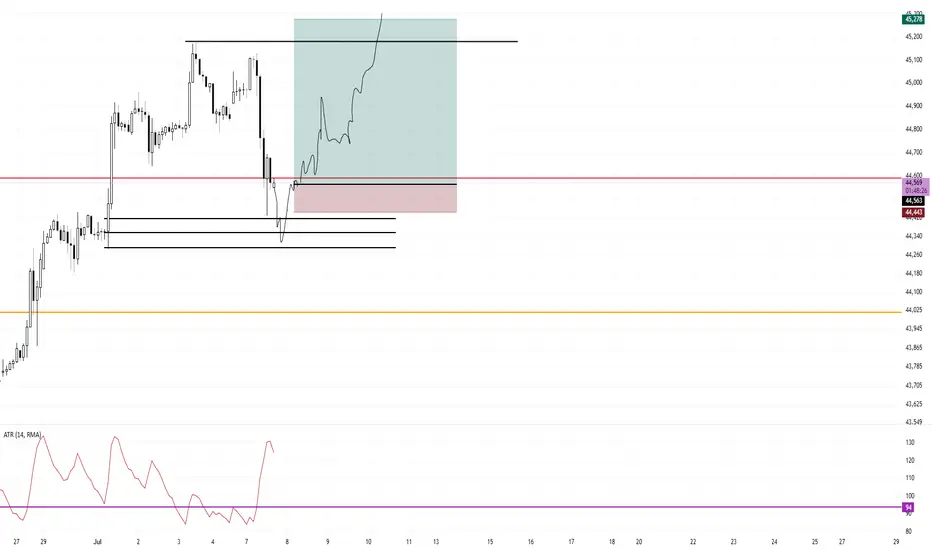
Range Bound Trade Trigger Long Dow FuturesI am Long now at 44,437
120 tick stop
335 tick target
Market gapped down, flushed the lows, tapped the monthly open by a hair and closed back inside. My stop is under the low and under the monthly open. My idea is that is will continue bullish back into the range.
Price is forming a range and mea

Dow Jones Bullish 12 Hour Doji Buy Setup 6:1If I see a 12 hour doji form at the close of this candle (4am my time) I will jump in bullish and target the highs for 600 ticks. I am looking for price to tap into the lows and close as a doji.
CPI Long Off of March's Monthly Open Possible NY SessionIf I can get a small doji formed after CPI at around the orange line (March's Monthly Open) I will enter Long.
Once entered, stop loss is 120 ticks and target the high 325 ticks.
I believe CPI will be whipsawed and range bound until NY opens up swinging
This is the 2 Hour chart for the pattern.

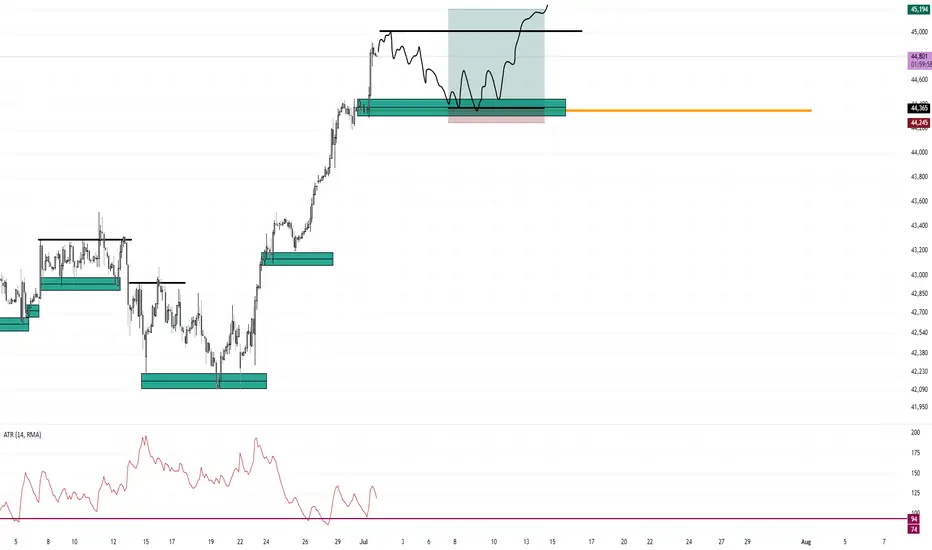
MYM-FUTURES-US30- Retracement & ContinuationBias changed from July 13, 2025 to Bullish for a quick scalp. Tomorrow expecting some retracement and a possible move higher. Overall, Bais hasn't changed. Looking for a short into weekly FVG.

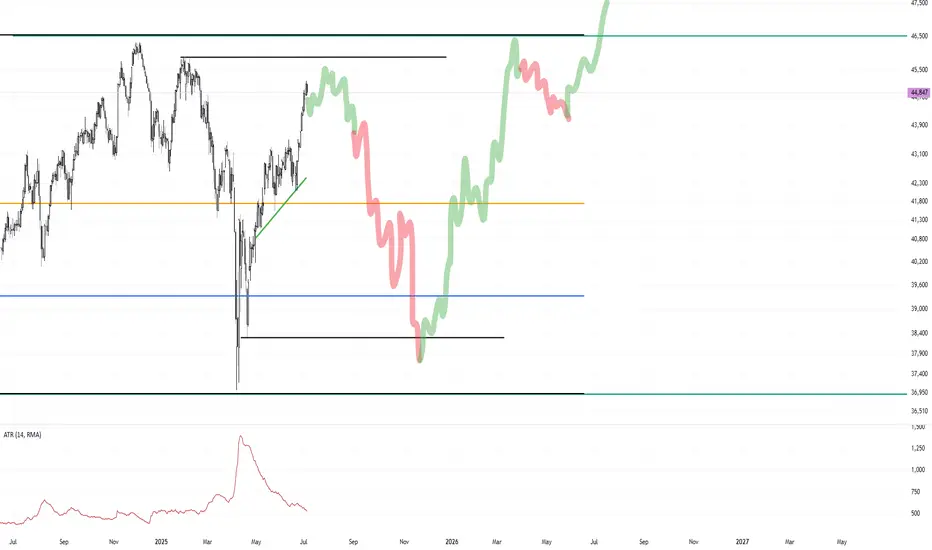
Dow Jones Monthly Range Bound GameplanWith updated information I can see price is in a range. Currently, price is in a bullish phase and I am soon expecting a topping process and a roll over. The daily trend should then switch bearish and take out all of the bull side liquidity. The low of April 21st should also be taken.
All of this
Bull Trend Buy Pullback to July Monthly OpenI am looking/waiting for a pullback to July's monthly open for a buy support trade in this strong bullish trend. Based on the close of the 3 month quarterly chart, the trend is EXTREMELY bullish.
This doji candle on the monthly chart for the SP500 is EXTREME Bullishness.
Below are exampl
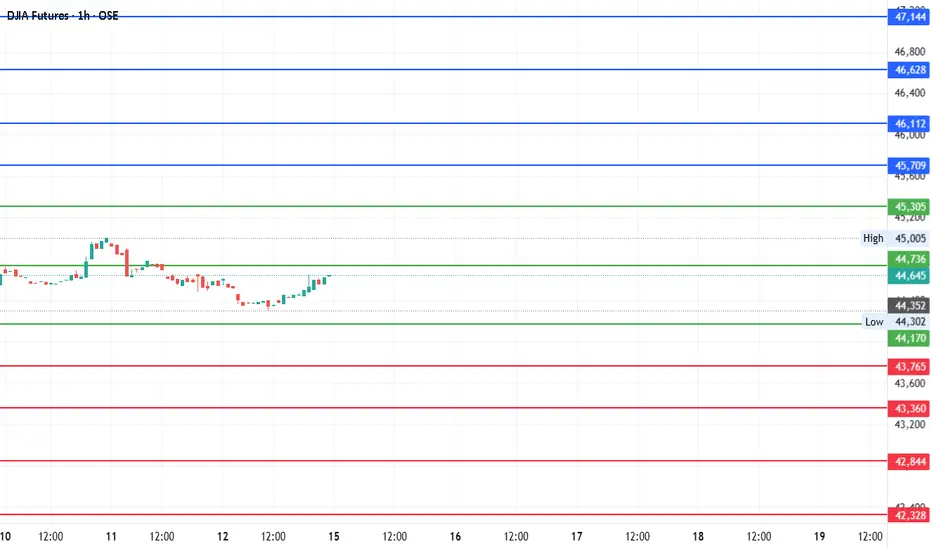
#DJI Futures Outlook: Key Levels to Watch Around Pivot 44,736Date: 14-07-2025
📊 Current Price: 44,645
📍 Pivot Point: 44,736.00
🔼 Upside / Bullish Scenario
If the price sustains above the pivot point (44,736), it could target the following resistance and bullish targets:
Immediate Resistance: 45,305.40
Target 1: 45,708.70
Target 2: 46,112.00
Target 3: 46
ABC Correction with Bullish Shark & Bat Type 1 Return Target 39KUptrend ABC Correction with Bullish Shark Retrace to .786 & Bullish Bat Type 1 Return Confirmation Higher Low. Full Fib Extension Target Top 39,000-39,600.

See all ideas
Summarizing what the indicators are suggesting.
Neutral
SellBuy
Strong sellStrong buy
Strong sellSellNeutralBuyStrong buy
Neutral
SellBuy
Strong sellStrong buy
Strong sellSellNeutralBuyStrong buy
Neutral
SellBuy
Strong sellStrong buy
Strong sellSellNeutralBuyStrong buy
A representation of what an asset is worth today and what the market thinks it will be worth in the future.
Displays a symbol's price movements over previous years to identify recurring trends.
Frequently Asked Questions
The current price of DJIA Futures is 44,320 JPY — it has fallen −0.03% in the past 24 hours. Watch DJIA Futures price in more detail on the chart.
The volume of DJIA Futures is 220.00. Track more important stats on the DJIA Futures chart.
The nearest expiration date for DJIA Futures is Sep 19, 2025.
Traders prefer to sell futures contracts when they've already made money on the investment, but still have plenty of time left before the expiration date. Thus, many consider it a good option to sell DJIA Futures before Sep 19, 2025.
Open interest is the number of contracts held by traders in active positions — they're not closed or expired. For DJIA Futures this number is 1.26 K. You can use it to track a prevailing market trend and adjust your own strategy: declining open interest for DJIA Futures shows that traders are closing their positions, which means a weakening trend.
Buying or selling futures contracts depends on many factors: season, underlying commodity, your own trading strategy. So mostly it's up to you, but if you look for some certain calculations to take into account, you can study technical analysis for DJIA Futures. Today its technical rating is buy, but remember that market conditions change all the time, so it's always crucial to do your own research. See more of DJIA Futures technicals for a more comprehensive analysis.