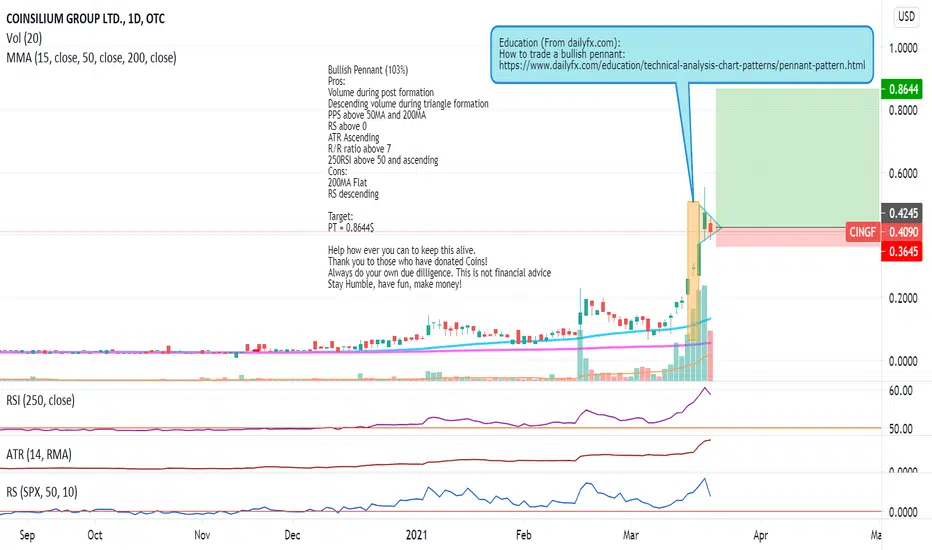
CINGF: Bullish Pennant (103%)Bullish Pennant (103%)
Pros:
Volume during post formation
Descending volume during triangle formation
PPS above 50MA and 200MA
RS above 0
ATR Ascending
R/R ratio above 7
250RSI above 50 and ascending
Cons:
200MA Flat
RS descending
Target:
PT = 0.8644$
Help how ever you can to keep this alive.
Tha
−0.0056 USD
−1.24 M USD
131.20 K USD
352.75 M
About COINSILIUM GROUP LTD
Sector
Industry
CEO
Eddy Roger Travia
Website
Headquarters
London
Founded
2014
FIGI
BBG00CZPJMX4
Coinsilium Group Ltd. engages in the crypto currency investments. It operates through the following geographical segments: United Kingdom, British Virgin Islands, and Hong Kong. The United Kingdom segment includes the administrative activities. The British Virgin Islands segment refers to investment activities. The Hong Kong segment is responsible for advisory services. The company was founded by Cameron John Parry, Eddy Roger Travia, Hakim Mamoni, and Malcolm Pallé on September 25, 2014 and is headquartered in London, the United Kingdom.
Related stocks
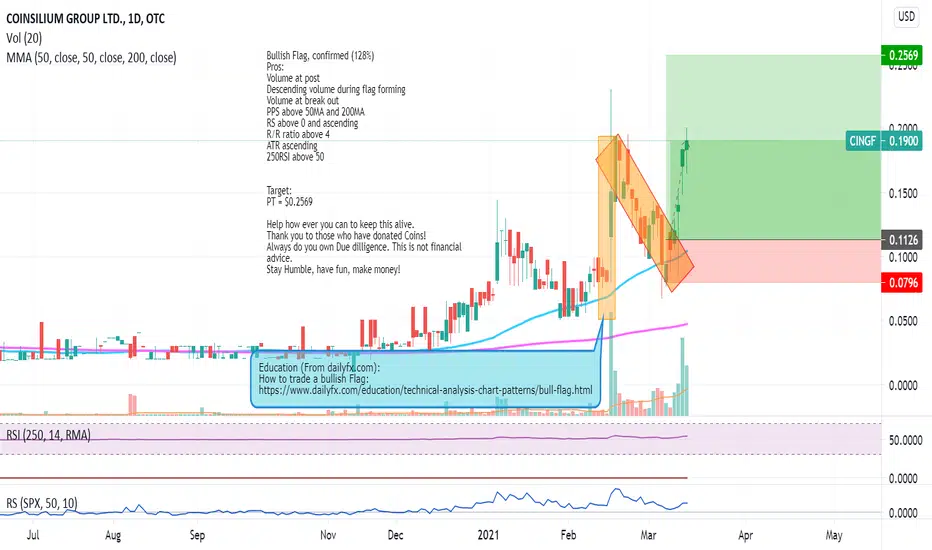
CINGF: Bullish Flag, confirmed (128%)Bullish Flag, confirmed (128%)
Pros:
Volume at post
Descending volume during flag forming
Volume at break out
PPS above 50MA and 200MA
RS above 0 and ascending
R/R ratio above 4
ATR ascending
250RSI above 50
Target:
PT = $0.2569
Help how ever you can to keep this alive.
Thank you to those who h
See all ideas
Summarizing what the indicators are suggesting.
Oscillators
Neutral
SellBuy
Strong sellStrong buy
Strong sellSellNeutralBuyStrong buy
Oscillators
Neutral
SellBuy
Strong sellStrong buy
Strong sellSellNeutralBuyStrong buy
Summary
Neutral
SellBuy
Strong sellStrong buy
Strong sellSellNeutralBuyStrong buy
Summary
Neutral
SellBuy
Strong sellStrong buy
Strong sellSellNeutralBuyStrong buy
Summary
Neutral
SellBuy
Strong sellStrong buy
Strong sellSellNeutralBuyStrong buy
Moving Averages
Neutral
SellBuy
Strong sellStrong buy
Strong sellSellNeutralBuyStrong buy
Moving Averages
Neutral
SellBuy
Strong sellStrong buy
Strong sellSellNeutralBuyStrong buy
Displays a symbol's price movements over previous years to identify recurring trends.
Frequently Asked Questions
The current price of CINGF is 0.2590 USD — it has decreased by −24.18% in the past 24 hours. Watch Coinsilium Group Ltd. stock price performance more closely on the chart.
Depending on the exchange, the stock ticker may vary. For instance, on OTC exchange Coinsilium Group Ltd. stocks are traded under the ticker CINGF.
CINGF stock has fallen by −49.03% compared to the previous week, the month change is a 218.89% rise, over the last year Coinsilium Group Ltd. has showed a 1.36 K% increase.
CINGF reached its all-time high on Jun 23, 2025 with the price of 1.2400 USD, and its all-time low was 0.0089 USD and was reached on Oct 10, 2023. View more price dynamics on CINGF chart.
See other stocks reaching their highest and lowest prices.
See other stocks reaching their highest and lowest prices.
CINGF stock is 45.63% volatile and has beta coefficient of −1.19. Track Coinsilium Group Ltd. stock price on the chart and check out the list of the most volatile stocks — is Coinsilium Group Ltd. there?
Today Coinsilium Group Ltd. has the market capitalization of 106.56 M, it has increased by 125.77% over the last week.
Yes, you can track Coinsilium Group Ltd. financials in yearly and quarterly reports right on TradingView.
CINGF net income for the last half-year is −1.27 M USD, while the previous report showed 37.35 K USD of net income which accounts for −3.51 K% change. Track more Coinsilium Group Ltd. financial stats to get the full picture.
No, CINGF doesn't pay any dividends to its shareholders. But don't worry, we've prepared a list of high-dividend stocks for you.
EBITDA measures a company's operating performance, its growth signifies an improvement in the efficiency of a company. Coinsilium Group Ltd. EBITDA is −931.61 K USD, and current EBITDA margin is −709.83%. See more stats in Coinsilium Group Ltd. financial statements.
Like other stocks, CINGF shares are traded on stock exchanges, e.g. Nasdaq, Nyse, Euronext, and the easiest way to buy them is through an online stock broker. To do this, you need to open an account and follow a broker's procedures, then start trading. You can trade Coinsilium Group Ltd. stock right from TradingView charts — choose your broker and connect to your account.
Investing in stocks requires a comprehensive research: you should carefully study all the available data, e.g. company's financials, related news, and its technical analysis. So Coinsilium Group Ltd. technincal analysis shows the sell today, and its 1 week rating is buy. Since market conditions are prone to changes, it's worth looking a bit further into the future — according to the 1 month rating Coinsilium Group Ltd. stock shows the buy signal. See more of Coinsilium Group Ltd. technicals for a more comprehensive analysis.
If you're still not sure, try looking for inspiration in our curated watchlists.
If you're still not sure, try looking for inspiration in our curated watchlists.