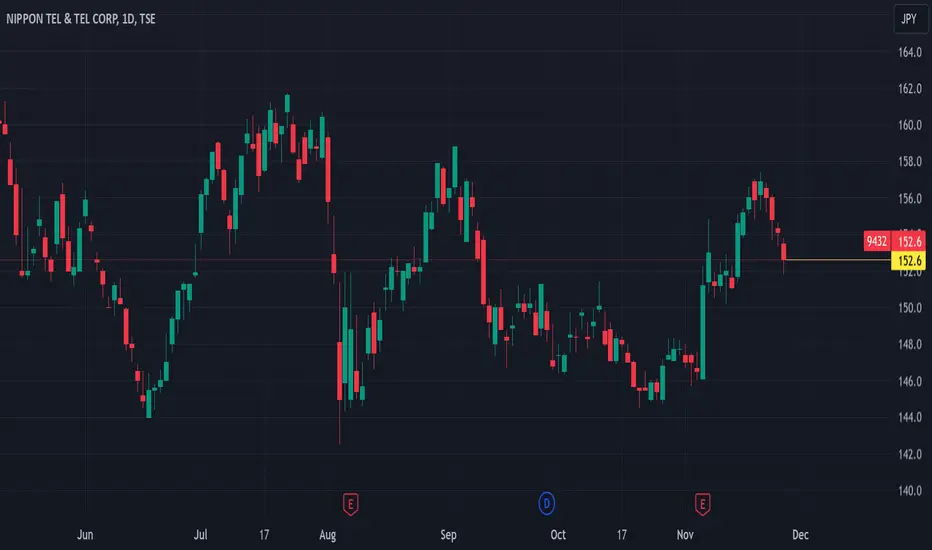
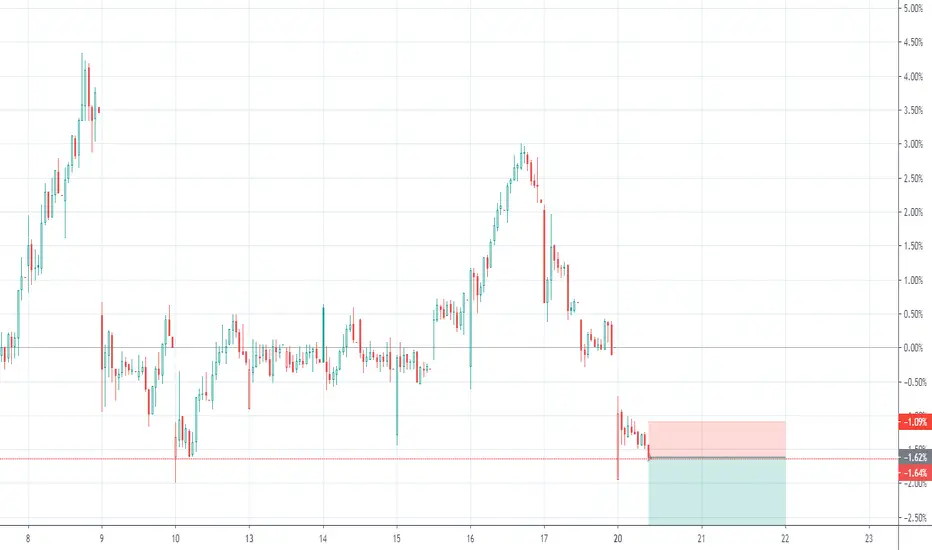
🇯🇵 Long Nippon Tel & Tel at 152.6For today's international stock hypothetical trade, I'm off to the Asia-Pacific region to visit the Nikkei and attempt to outdo its 20 year average annual return in this trade alone. Since that is -1.1% per year, I think I can clear that bar. Plus, with the US markets closed tomorrow, I need someth
Next report date
—
Report period
—
EPS estimate
—
Revenue estimate
—
0.0797 USD
6.67 B USD
91.36 B USD
45.82 B
About NTT INC
Sector
Industry
CEO
Akira Shimada
Website
Headquarters
Tokyo
Founded
2005
ISIN
JP3735400008
FIGI
BBG000C4MC15
NTT, Inc. is a holding company, which engages in the provision of telecommunication services for domestic and overseas markets. It operates through the following segments: Integrated Information and Communications Technology (ICT) Business, Regional Communications Business, Global Solutions Business, and Others. The Integrated ICT Business segment includes mobile phone services, domestic inter-prefectural communications services, international communications services, solutions services, and system development services and related services. The Regional Communications Business segment is involved in the domestic intra-prefectural communications services and related ancillary services. The Global Solutions Business segment offers system integration services, network system services, cloud services, global data center services, and related services. The Others segment refers to real estate business, energy business, and other activities. The company was founded on August 1, 1952 and is headquartered in Tokyo, Japan.
Related stocks
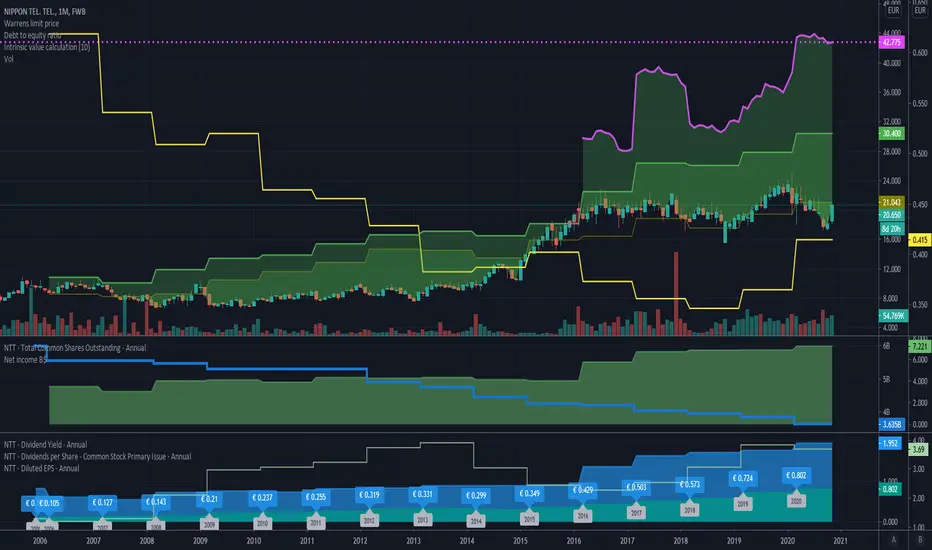
Value investing chart setI would like to share the set of charts I use to find and analyse candidates for value investing.
It is a rather dense and telling setup where you can find a lots of information. Please allow me to explain them one by one.
(The chart is made on the company Nippon Tel. It is not a recomendation for
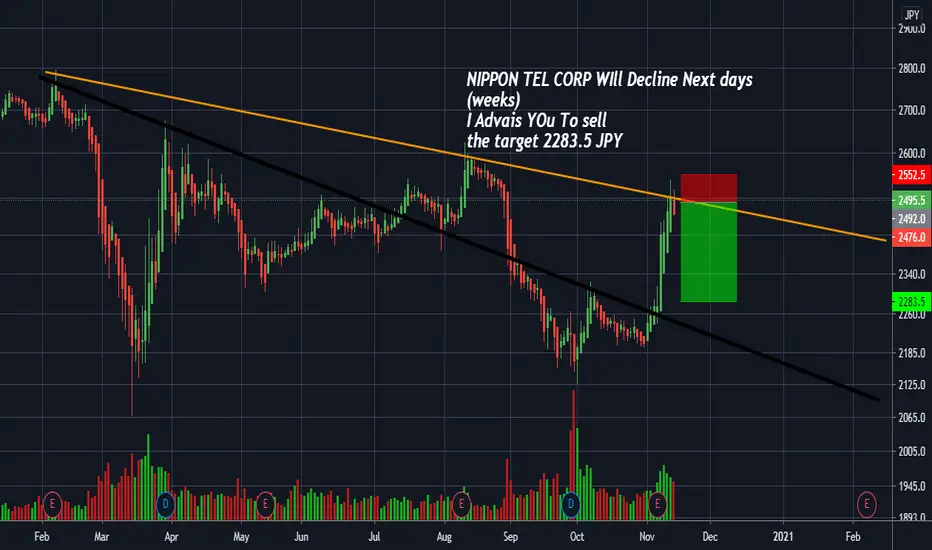
I Recommend SELLING !NIPPON TEL CORP WIll Decline Next days
(weeks)
I Advais YOu To sell
the target 2283.5 JPY
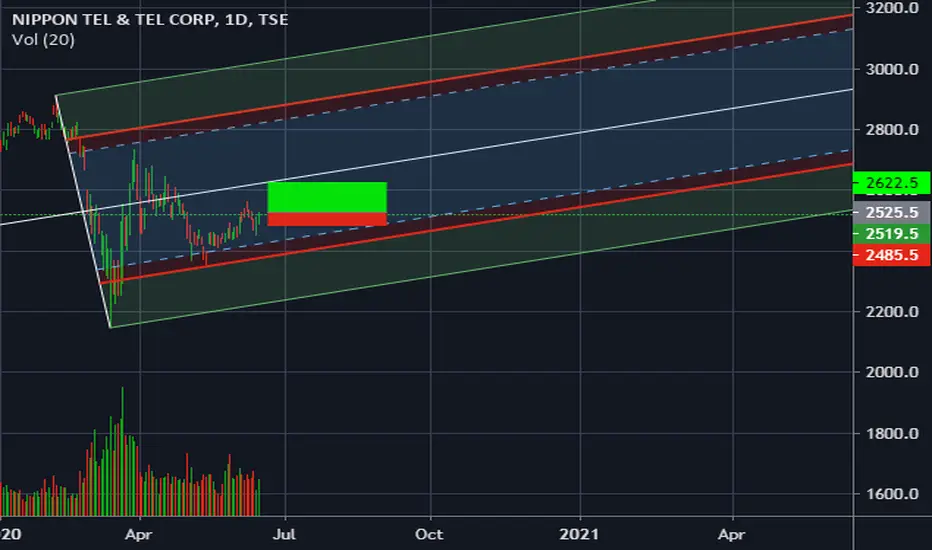
NIPPON TEL DAILY ANALYSIS Hi friends
the daily chart for this market shows with a very high probability that it will experience an uptrend up to the level of2626.0 with the vigilance of market reversal
for more information please subscribe
cordially
See all ideas
Summarizing what the indicators are suggesting.
Neutral
SellBuy
Strong sellStrong buy
Strong sellSellNeutralBuyStrong buy
Neutral
SellBuy
Strong sellStrong buy
Strong sellSellNeutralBuyStrong buy
Neutral
SellBuy
Strong sellStrong buy
Strong sellSellNeutralBuyStrong buy
An aggregate view of professional's ratings.
Neutral
SellBuy
Strong sellStrong buy
Strong sellSellNeutralBuyStrong buy
Neutral
SellBuy
Strong sellStrong buy
Strong sellSellNeutralBuyStrong buy
Neutral
SellBuy
Strong sellStrong buy
Strong sellSellNeutralBuyStrong buy
Displays a symbol's price movements over previous years to identify recurring trends.
NTT5139690
NTT Finance Corporation 2.065% 03-APR-2031Yield to maturity
5.02%
Maturity date
Apr 3, 2031
NTT5139688
NTT Finance Corporation 1.591% 03-APR-2028Yield to maturity
4.71%
Maturity date
Apr 3, 2028
NTT5840192
NTT Finance Corporation 5.136% 02-JUL-2031Yield to maturity
4.69%
Maturity date
Jul 2, 2031
NTT5840190
NTT Finance Corporation 5.11% 02-JUL-2029Yield to maturity
4.63%
Maturity date
Jul 2, 2029
NTT5449480
NTT Finance Corporation 4.239% 25-JUL-2025Yield to maturity
4.63%
Maturity date
Jul 25, 2025
NTT5139686
NTT Finance Corporation 1.162% 03-APR-2026Yield to maturity
4.53%
Maturity date
Apr 3, 2026
NTT5449482
NTT Finance Corporation 4.372% 27-JUL-2027Yield to maturity
4.51%
Maturity date
Jul 27, 2027
NTT5840188
NTT Finance Corporation 5.104% 02-JUL-2027Yield to maturity
4.39%
Maturity date
Jul 2, 2027
XS230502692
NTT FINANCE 21/30 REGSYield to maturity
3.38%
Maturity date
Mar 3, 2030
XS277837412
NTT FINANCE 24/31 MTNYield to maturity
3.24%
Maturity date
Mar 12, 2031
8E2A
NTT FINANCE CORP 2021-13.12.28Yield to maturity
2.83%
Maturity date
Dec 13, 2028
See all NPPXF bonds
Frequently Asked Questions
The current price of NPPXF is 1.0655 USD — it has decreased by −2.32% in the past 24 hours. Watch NTT Inc. stock price performance more closely on the chart.
Depending on the exchange, the stock ticker may vary. For instance, on OTC exchange NTT Inc. stocks are traded under the ticker NPPXF.
NPPXF stock has fallen by −10.34% compared to the previous week, the month change is a −20.07% fall, over the last year NTT Inc. has showed a 6.55% increase.
We've gathered analysts' opinions on NTT Inc. future price: according to them, NPPXF price has a max estimate of 1.48 USD and a min estimate of 1.03 USD. Watch NPPXF chart and read a more detailed NTT Inc. stock forecast: see what analysts think of NTT Inc. and suggest that you do with its stocks.
NPPXF reached its all-time high on Jun 27, 2000 with the price of 537.2800 USD, and its all-time low was 0.7644 USD and was reached on Mar 18, 2020. View more price dynamics on NPPXF chart.
See other stocks reaching their highest and lowest prices.
See other stocks reaching their highest and lowest prices.
NPPXF stock is 12.90% volatile and has beta coefficient of 0.41. Track NTT Inc. stock price on the chart and check out the list of the most volatile stocks — is NTT Inc. there?
Today NTT Inc. has the market capitalization of 88.10 B, it has decreased by −2.28% over the last week.
Yes, you can track NTT Inc. financials in yearly and quarterly reports right on TradingView.
NTT Inc. is going to release the next earnings report on Aug 6, 2025. Keep track of upcoming events with our Earnings Calendar.
NPPXF earnings for the last quarter are 0.01 USD per share, whereas the estimation was 0.03 USD resulting in a −62.89% surprise. The estimated earnings for the next quarter are 0.02 USD per share. See more details about NTT Inc. earnings.
NTT Inc. revenue for the last quarter amounts to 24.36 B USD, despite the estimated figure of 23.68 B USD. In the next quarter, revenue is expected to reach 22.73 B USD.
NPPXF net income for the last quarter is 995.40 M USD, while the quarter before that showed 1.88 B USD of net income which accounts for −47.11% change. Track more NTT Inc. financial stats to get the full picture.
NTT Inc. dividend yield was 3.59% in 2024, and payout ratio reached 43.48%. The year before the numbers were 2.84% and 33.80% correspondingly. See high-dividend stocks and find more opportunities for your portfolio.
As of Jul 7, 2025, the company has 341.32 K employees. See our rating of the largest employees — is NTT Inc. on this list?
EBITDA measures a company's operating performance, its growth signifies an improvement in the efficiency of a company. NTT Inc. EBITDA is 23.42 B USD, and current EBITDA margin is 26.03%. See more stats in NTT Inc. financial statements.
Like other stocks, NPPXF shares are traded on stock exchanges, e.g. Nasdaq, Nyse, Euronext, and the easiest way to buy them is through an online stock broker. To do this, you need to open an account and follow a broker's procedures, then start trading. You can trade NTT Inc. stock right from TradingView charts — choose your broker and connect to your account.
Investing in stocks requires a comprehensive research: you should carefully study all the available data, e.g. company's financials, related news, and its technical analysis. So NTT Inc. technincal analysis shows the buy rating today, and its 1 week rating is buy. Since market conditions are prone to changes, it's worth looking a bit further into the future — according to the 1 month rating NTT Inc. stock shows the sell signal. See more of NTT Inc. technicals for a more comprehensive analysis.
If you're still not sure, try looking for inspiration in our curated watchlists.
If you're still not sure, try looking for inspiration in our curated watchlists.