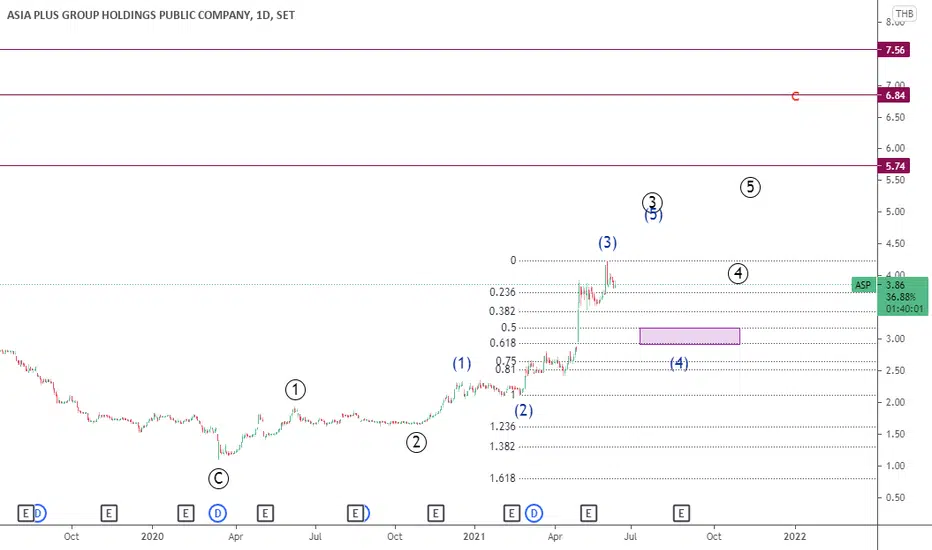
ASP (THAILAND) - ELLIOT WAVE ANALYSIS- Month TF:we are currently in Cycle wave C - expect price to with TP as 5.74, 6.84, and 7.56 respectively.
- Date TF: Within the Cycle Wave C, we are in an Intermediate Wave (4) of Primary Wave . Hence, we can expect a minor retracement to around 2.90 to 3.16 area. A good opportunity to enter would
0.10 THB
356.42 M THB
2.14 B THB
About ASIA PLUS GROUP HLDGS PCL
Sector
Industry
CEO
Kongkiat Opaswongkarn
Website
Headquarters
Bangkok
Founded
1974
ISIN
TH0137010R18
FIGI
BBG000BNNY24
Asia Plus Group Holdings Public Co. Ltd. is an investment company, which engages in the securities business. Through its subsidiaries, it operates through the following segments: Securities and Derivatives Brokerage; Investment Banking; Fund Management; Investment Trading; and Other. The Securities and Derivatives Brokerage segment offers brokering services for both local and foreign investors. The Investment Banking segment provides financial advisory services and underwriting services. The Fund Management includes fund management services and investments in unit trusts. The Investment Trading segment comprises of buying, selling, and exchanges securities in its own accounts. The Other segment deals with back office, equity derivatives, Wealth Plus, and treasury operating segments. The company was founded on October 22, 1974 and is headquartered in Bangkok, Thailand.
Related stocks
Summarizing what the indicators are suggesting.
Oscillators
Neutral
SellBuy
Strong sellStrong buy
Strong sellSellNeutralBuyStrong buy
Oscillators
Neutral
SellBuy
Strong sellStrong buy
Strong sellSellNeutralBuyStrong buy
Summary
Neutral
SellBuy
Strong sellStrong buy
Strong sellSellNeutralBuyStrong buy
Summary
Neutral
SellBuy
Strong sellStrong buy
Strong sellSellNeutralBuyStrong buy
Summary
Neutral
SellBuy
Strong sellStrong buy
Strong sellSellNeutralBuyStrong buy
Moving Averages
Neutral
SellBuy
Strong sellStrong buy
Strong sellSellNeutralBuyStrong buy
Moving Averages
Neutral
SellBuy
Strong sellStrong buy
Strong sellSellNeutralBuyStrong buy
Displays a symbol's price movements over previous years to identify recurring trends.