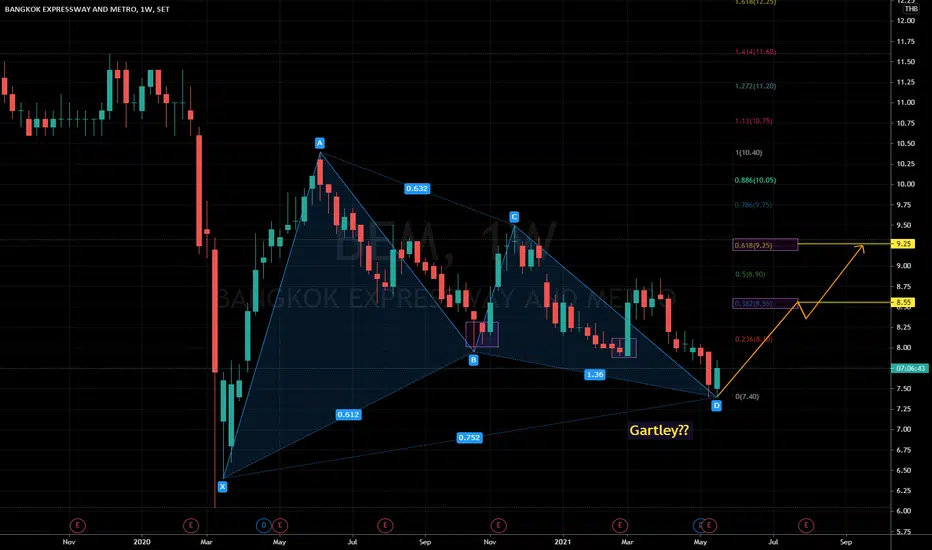
BEM | Leading Diagonal Pattern Projection - Wave B CorrectionA possible ABC correction after finishing mega leading diagonal wave pattern:
Wave B target 0.5 - 0.618 retracement of wave A and EMA 20 week resistance
A possible false breakout EMA200 week
Wave C - Targeting 0.786 fibonanci zone of major Wave 1
0.25 THB
3.77 B THB
17.00 B THB
About BANGKOK EXPRESSWAY AND METRO PCL
Sector
Industry
CEO
Sombat Kitjalaksana
Website
Headquarters
Bangkok
Founded
2015
ISIN
TH6999010R15
FIGI
BBG00BS5PMX1
Bangkok Expressway & Metro Public Co. Ltd. engages in the management of expressway and metro service provider. It operates through the following business segments: Expressway Business, Rail Business, Commercial Development Business, and Other. The Expressway Business segment operates and constructs the expressway. The Rail Business segment focuses on the operation of the rapid transit system. The Commercial Development Business segment refers to the retail space, and provision of advertising media and telecommunication services. The Other segment relates to the operation of Bang Pa-In-Pak Kret expressway project. The company was founded on December 30, 2015 and is headquartered in Bangkok, Thailand.
Related stocks

BEM | Parallel Channel | Short term trade setupPrice Action & Chart Pattern Short-term Trading
> Parallel Channel uptrend trade setup
> Entry @ bullish breakout EMA50 and EMA200
Indicator:
> Smart Money and Banker Chip Volume significant level support
> BBD bullish divergence crossed above baseline
> Fundflow strong uptrend
> KDJ strong uptrend
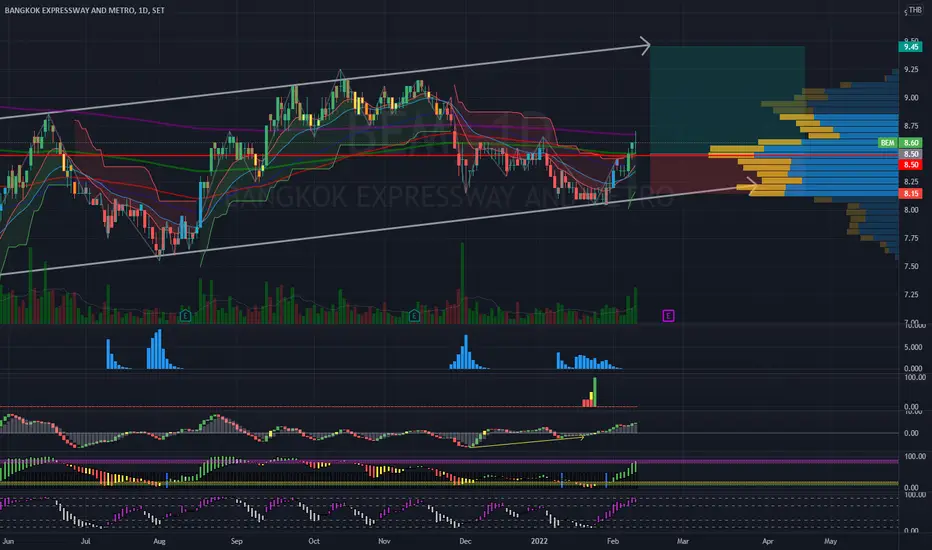

Price moves into long term bullish support. Long BEM. TP: 10.50BEM's initial drop due to traffic dropping 20% as a result of COVID. As a business, it is highly sustainable (rights to collect highway tolls and metro fees after build), with a big opportunity to grow as the country develops. Long.


See all ideas
Summarizing what the indicators are suggesting.
Oscillators
Neutral
SellBuy
Strong sellStrong buy
Strong sellSellNeutralBuyStrong buy
Oscillators
Neutral
SellBuy
Strong sellStrong buy
Strong sellSellNeutralBuyStrong buy
Summary
Neutral
SellBuy
Strong sellStrong buy
Strong sellSellNeutralBuyStrong buy
Summary
Neutral
SellBuy
Strong sellStrong buy
Strong sellSellNeutralBuyStrong buy
Summary
Neutral
SellBuy
Strong sellStrong buy
Strong sellSellNeutralBuyStrong buy
Moving Averages
Neutral
SellBuy
Strong sellStrong buy
Strong sellSellNeutralBuyStrong buy
Moving Averages
Neutral
SellBuy
Strong sellStrong buy
Strong sellSellNeutralBuyStrong buy
Displays a symbol's price movements over previous years to identify recurring trends.