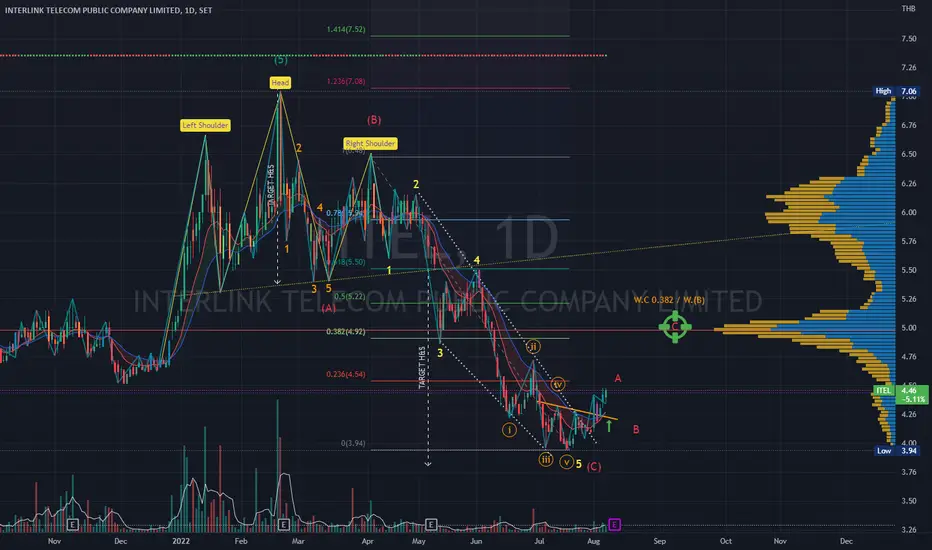
ITEL | Elliott Wave Projection | Falling Wedge BreakoutPrice action and chart pattern trading
> Elliott wave downtrend falling wedge breakout
> Inverse head & shoulders reversal pattern with breakout
> Entry @ pullback B-wave retraced near neckline zone
> Target @ 0.386 retracement of (A) wave - volume profile point of control zone
> Stoploss @ the lowe
0.15 THB
303.99 M THB
2.48 B THB
About INTERLINK TELECOM PCL
Sector
Industry
CEO
Nuttanai Anuntarumporn
Website
Headquarters
Bangkok
Founded
2007
ISIN
TH7414010R14
FIGI
BBG00DLCHVP7
Interlink Telecom Public Co., Ltd. engages in the development and provision of telecommunication services. It offers domestic and international data communication services through fiber optical networks. The firm also provides services of design, construction, and contracting for fiber optic project and telecommunications project. The company was founded on January 3, 2007 and is headquartered in Bangkok, Thailand.
Related stocks
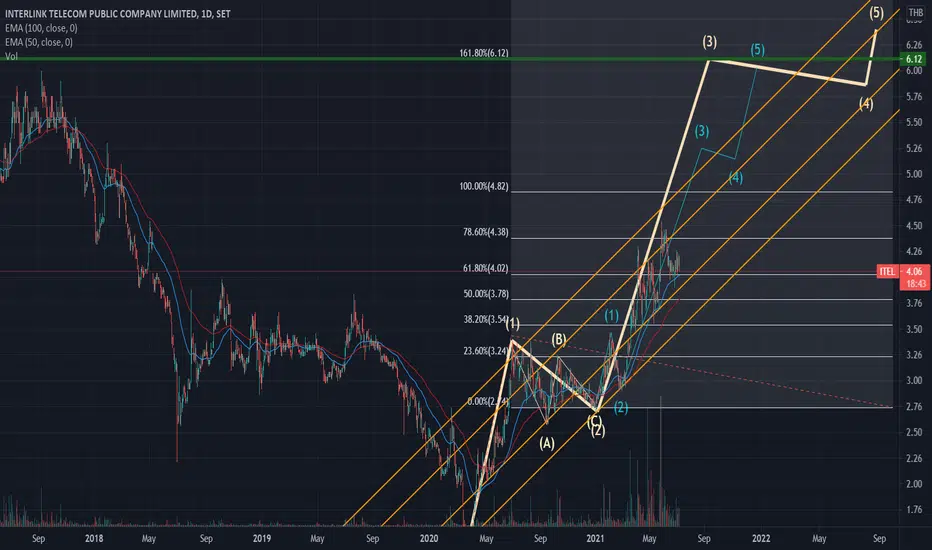
ITEL | Wave Projection | Downtrend Channel Breakout - A-Wave?Price action and chart pattern trading setup:
> A possible downtrend A-wave reversal zone at the 5-wave uptrend Head & Shoulders target
> Now breakout downtrend 5-wave channel and developing an Inverse Head & Shoulders reversal pattern below SMMA200D zone.
> If breakout successfully, A possible sce

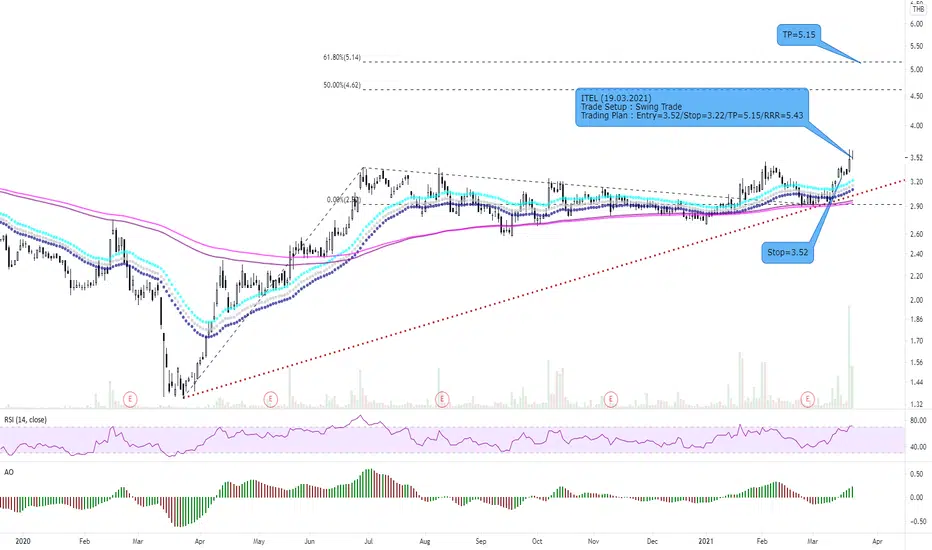
ITEL | Bullish Flag Breakout | Entry PositionITEL | Thailand SET Index | ICT Sector | Price Action Trading
Chart Pattern: Falling Wedge Reversal
Price Action: Bullish Breakout with Breakaway Candle
Indicator:
> RSI & MACD golden cross above baseline
Placing your stop-loss 5-7% below the entry, there may be some pullback
Risk ratio: 3:1 m

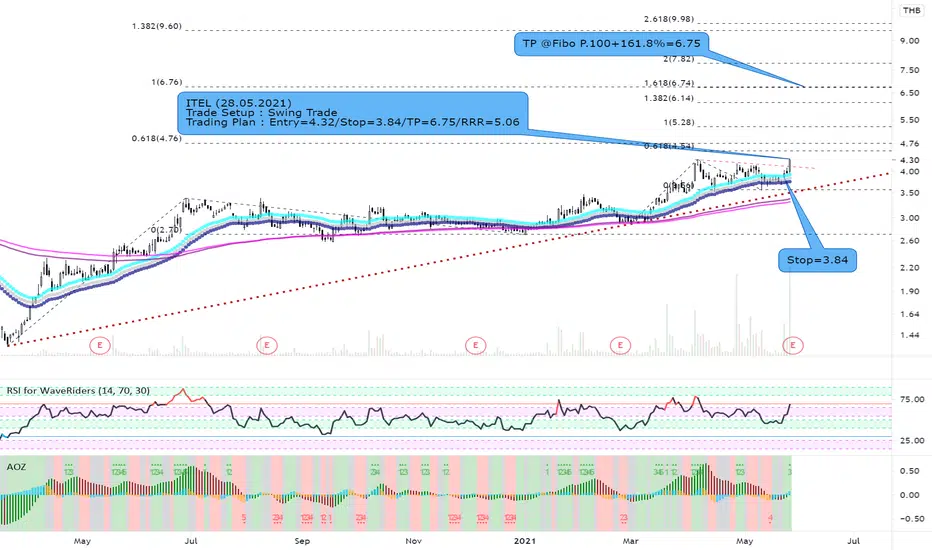
ITEL and Swing Trade SetupITEL and Swing Trade Setup with double Fibo. P. 100% and 161.8% as the first target price. Good Luck
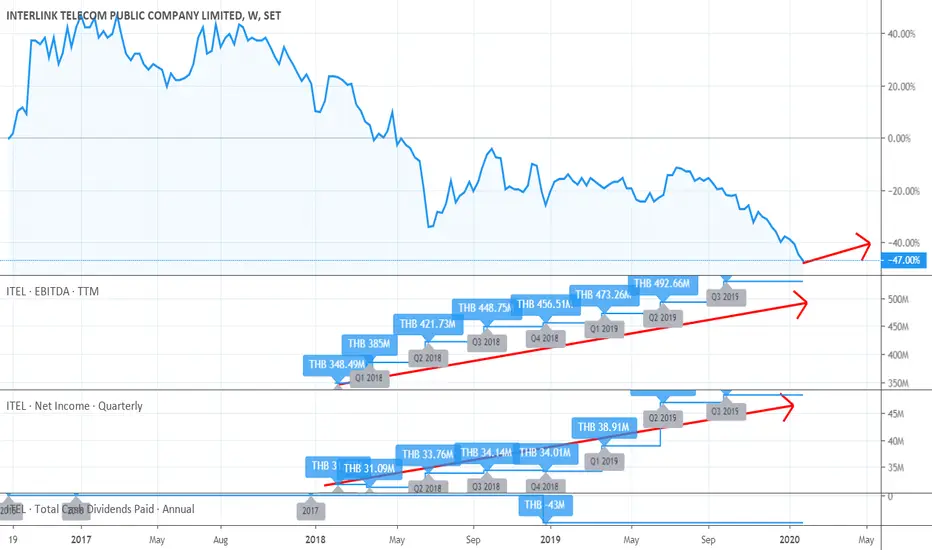
ITEL increasing EBITDA, Net Income and DividenThe company were in strong growth. The trend should sustain for the next few years. The good trend of higher GPM due to more recurring income contributions from Data Services.
See all ideas
Summarizing what the indicators are suggesting.
Oscillators
Neutral
SellBuy
Strong sellStrong buy
Strong sellSellNeutralBuyStrong buy
Oscillators
Neutral
SellBuy
Strong sellStrong buy
Strong sellSellNeutralBuyStrong buy
Summary
Neutral
SellBuy
Strong sellStrong buy
Strong sellSellNeutralBuyStrong buy
Summary
Neutral
SellBuy
Strong sellStrong buy
Strong sellSellNeutralBuyStrong buy
Summary
Neutral
SellBuy
Strong sellStrong buy
Strong sellSellNeutralBuyStrong buy
Moving Averages
Neutral
SellBuy
Strong sellStrong buy
Strong sellSellNeutralBuyStrong buy
Moving Averages
Neutral
SellBuy
Strong sellStrong buy
Strong sellSellNeutralBuyStrong buy
Displays a symbol's price movements over previous years to identify recurring trends.