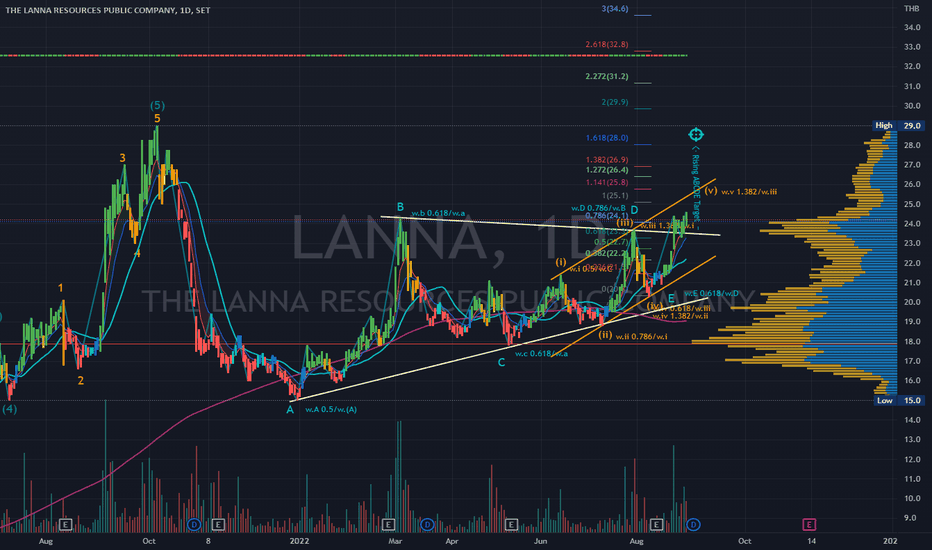
LANNA | Wave Analysis | ABCDE Triangle Breakout TargetPrice action and chart pattern trading
> Elliott Wave Projection - Rising triangle wave ABCDE breakout pattern
> TP1 @ Upper channel resistance wave v leading diagonal - 1.382 extension of wave iii +12% upside
> TP2 @ 1.618 extension of wave D +18% upside
> Stoploss @ SMA20 - 6-7%
> Risk reward rati
2.5 THB
1.66 B THB
20.78 B THB
About LANNA RESOURCES
Sector
Industry
CEO
Srihasak Arirachakaran
Website
Headquarters
Bangkok
Founded
1985
ISIN
TH0409010R11
FIGI
BBG000BDDM50
The Lanna Resources Public Co., Ltd. engages in the production and distribution of coal products. It operates through the following segments: Domestic Coal, Overseas Coal, Ethanol, Wood Pallet, Soil Conditioner. The Domestic Coal Segment includes the purchase and sale of coal. The Overseas Coal segment consists of the production and sale of coal. The Ethanol segment refers to the production and sale of ethanol. The Wood Pallet segment manufactures wood pallets. The company was founded on October 4, 1985 and is headquartered in Bangkok, Thailand.
Related stocks
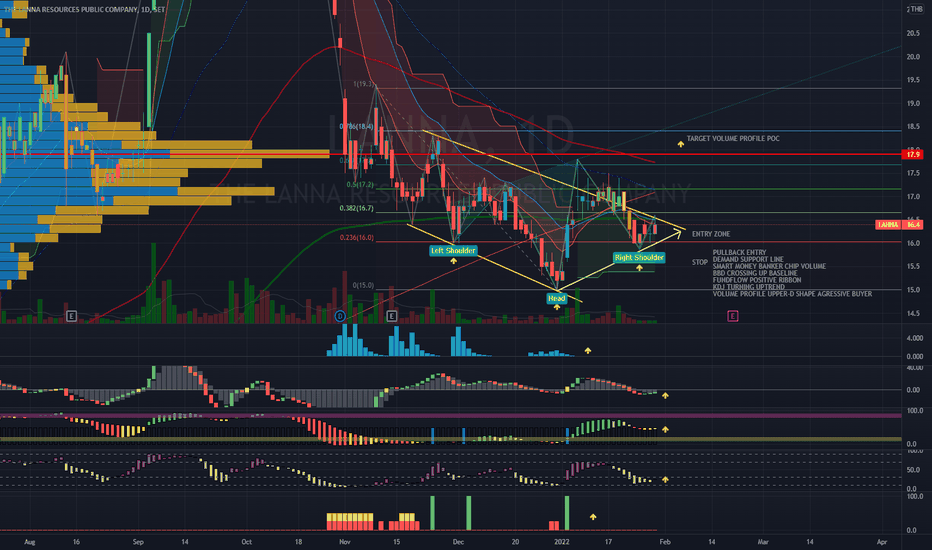
LANNA | Inverted Head & Shoulders | Entry SetupPrice Action & Chart Pattern Trading
> Inverted Head & Shoulders forming | Entry @ Demand support line zone (right shoulder) crossing up EMA200 and SMA200
Indicators:
> Smart Money and Banker Chip volume support
> BBD crossing up baseline
> Fundflow turning positive in-flow bullish signal
> KDJ bu
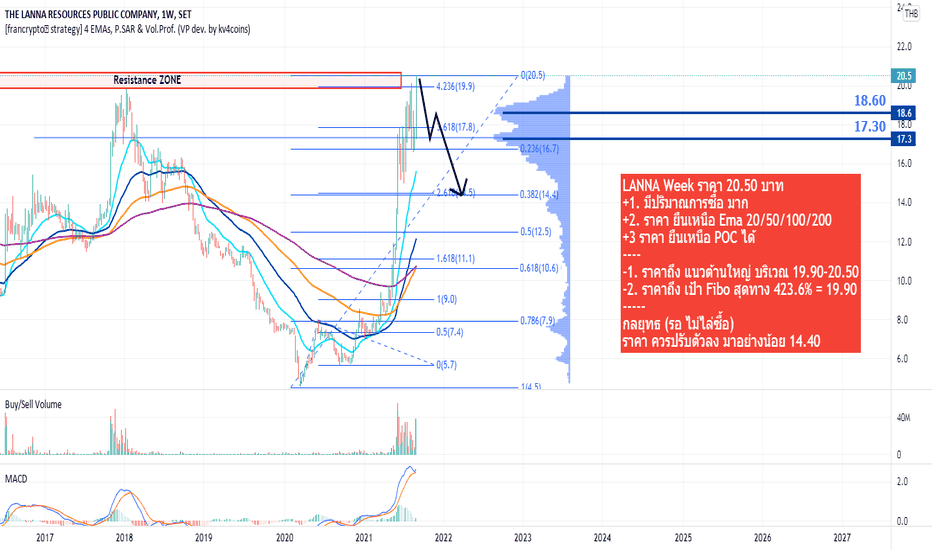
LANNA Week price 20.50 bahtLANNA Week price 20.50 baht
+1. There is a large purchase volume.
+2. Price Stands Above Ema 20/50/100/200
+3 Price can stand above POC
----
-1. Price reaches a large resistance in the area of 19.90-20.50
-2. Price reached the end of the Fibo target 423.6% = 19.90
-----
Strategy (wait)
The price s
See all ideas
Summarizing what the indicators are suggesting.
Oscillators
Neutral
SellBuy
Strong sellStrong buy
Strong sellSellNeutralBuyStrong buy
Oscillators
Neutral
SellBuy
Strong sellStrong buy
Strong sellSellNeutralBuyStrong buy
Summary
Neutral
SellBuy
Strong sellStrong buy
Strong sellSellNeutralBuyStrong buy
Summary
Neutral
SellBuy
Strong sellStrong buy
Strong sellSellNeutralBuyStrong buy
Summary
Neutral
SellBuy
Strong sellStrong buy
Strong sellSellNeutralBuyStrong buy
Moving Averages
Neutral
SellBuy
Strong sellStrong buy
Strong sellSellNeutralBuyStrong buy
Moving Averages
Neutral
SellBuy
Strong sellStrong buy
Strong sellSellNeutralBuyStrong buy
Displays a symbol's price movements over previous years to identify recurring trends.


