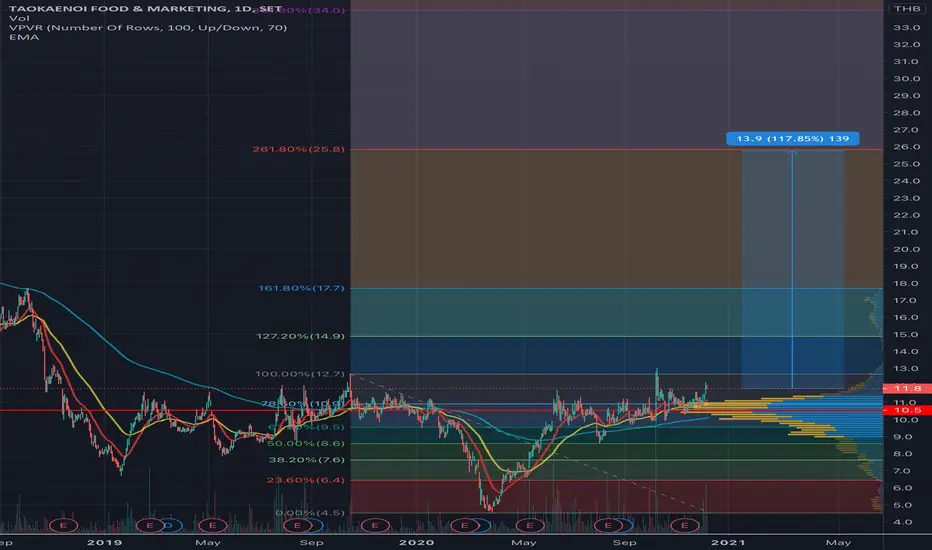
TKN | Wave Analysis | Possible Upcoming Impulse 3-Wave ForecastPrice action and chart pattern trading setup
> Wave pattern: 2-Wave Triangle ABCDE - possible upcoming wave E before rising impulse 3 wave.
> Entry: Support level SMMA50 and SMMA20 @ 0.618 and 0.786 retracement zone
> Target: 3 -wave triangle breakout plus distance of the triangle channel 1.272 exte
Next report date
—
Report period
—
EPS estimate
—
Revenue estimate
—
0.45 THB
836.10 M THB
5.71 B THB
About TAOKAENOI FOOD & MARKETING PCL
Sector
Industry
CEO
Itthipat Peeradechapan
Website
Headquarters
Nonthaburi
Founded
2004
ISIN
TH6927010R16
FIGI
BBG00BJY7KF2
Taokaenoi Food and Marketing Public Co. Ltd. engages in the manufacture and distribution of snacks. It operates through the following segments: Snack, Retailer and Restaurant, and Other. The Snack segment involves the sale of fried, grilled, and baked seaweed and snacks in domestic and overseas markets. The Retailer and Restaurant segment covers the distribution of snacks, food, and beverages. The company was founded on September 21, 2004 and is headquartered in Nonthaburi, Thailand.
Related stocks

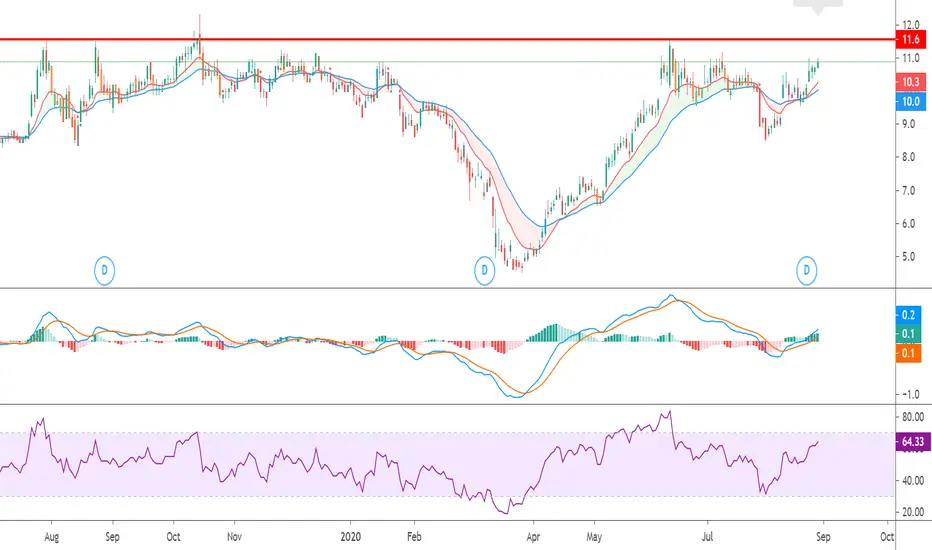
TKN | possible breakout but upside limited bearish divergencePrice Action and chart pattern trading - possible breakout but upside limited
> Testing the upper limit of uptrend parallel channel and key resistance of volume profile
Indicator
> Bearish divergence signal: Fundflow, BBD, and KDJ Stochastic
> Strong volume support with smart money and banker chip

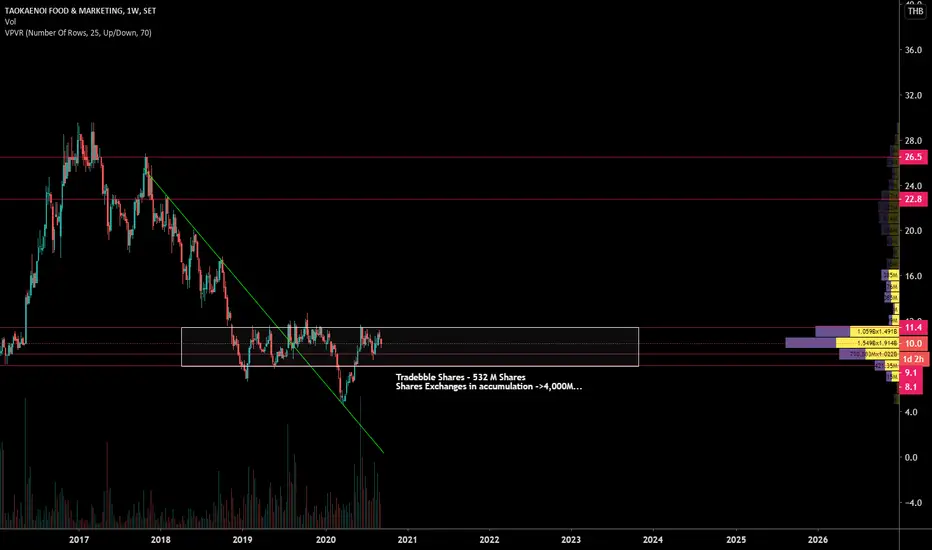
SET:TKN - Long Opportunity - Massive Volume ConsolidatonIs this a Wykcoff - Not sure, but whatever it is, TKN has a an outstanding tradable shares of 532M Shares......My hypothesis is someone accumulating a massive position here.

See all ideas
Summarizing what the indicators are suggesting.
Neutral
SellBuy
Strong sellStrong buy
Strong sellSellNeutralBuyStrong buy
Neutral
SellBuy
Strong sellStrong buy
Strong sellSellNeutralBuyStrong buy
Neutral
SellBuy
Strong sellStrong buy
Strong sellSellNeutralBuyStrong buy
An aggregate view of professional's ratings.
Neutral
SellBuy
Strong sellStrong buy
Strong sellSellNeutralBuyStrong buy
Neutral
SellBuy
Strong sellStrong buy
Strong sellSellNeutralBuyStrong buy
Neutral
SellBuy
Strong sellStrong buy
Strong sellSellNeutralBuyStrong buy
Displays a symbol's price movements over previous years to identify recurring trends.