TTB THANACHART
TTB THANACHART
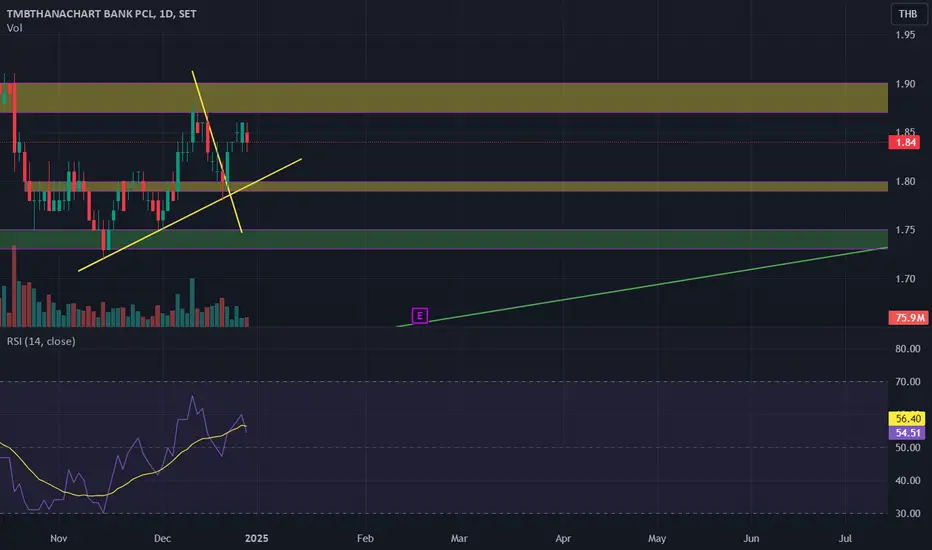
Price Close 1.48
Buy 1.88 Next Resistance is 1.90
Or Buy Zone Is 1.80 Next Demand is 1.75
If Price Low Then 1.75 Sell
0.21 THB
21.03 B THB
99.21 B THB
About TMBTHANACHART BANK PCL
Sector
Industry
CEO
Piti Tantakasem
Website
Headquarters
Bangkok
Founded
1957
ISIN
TH0068010R15
FIGI
BBG000BSMGC2
TMBThanachart Bank Public Co. Ltd. engages in the commercial banking businesses. It operates under the Commercial Banking and Retail Banking segments. The Commercial Banking segment focuses on wholesale banking and small enterprise. The Retail Banking segment includes deposits, housing loans, hire purchase, finance lease, personal loans, cards services, bancassurance and mutual funds, and foreign currency services. The company was founded on November 8, 1957 and is headquartered in Bangkok, Thailand.

TTBSETHD
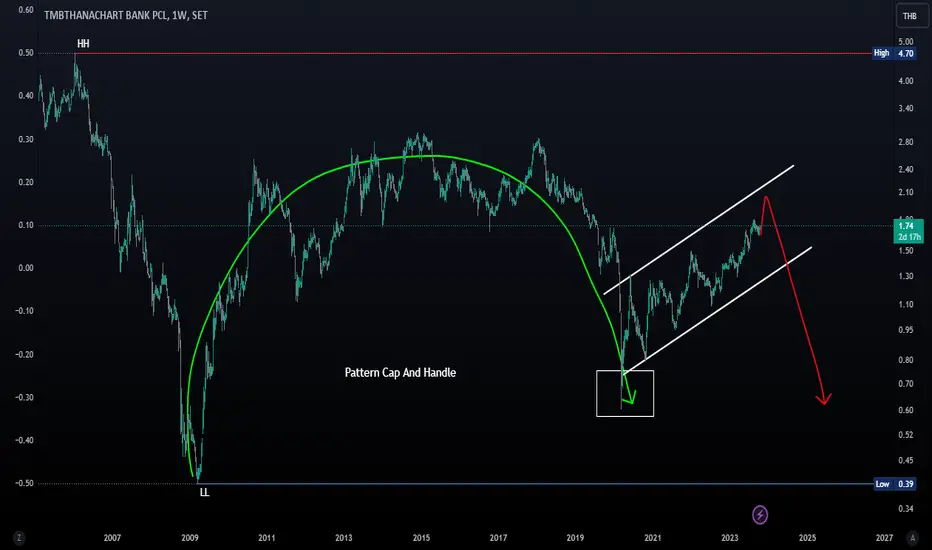
Pattern Cap And Handle
Big cup and make small Cup? or Make Handle
i think now it On wave Double or Triple WXY / WXYXXZ
TTB TP: 1.60Better banking outlook is good for TTB since the merger because it is still laggard compared to the sector. Target price expected between 1.60-1.80

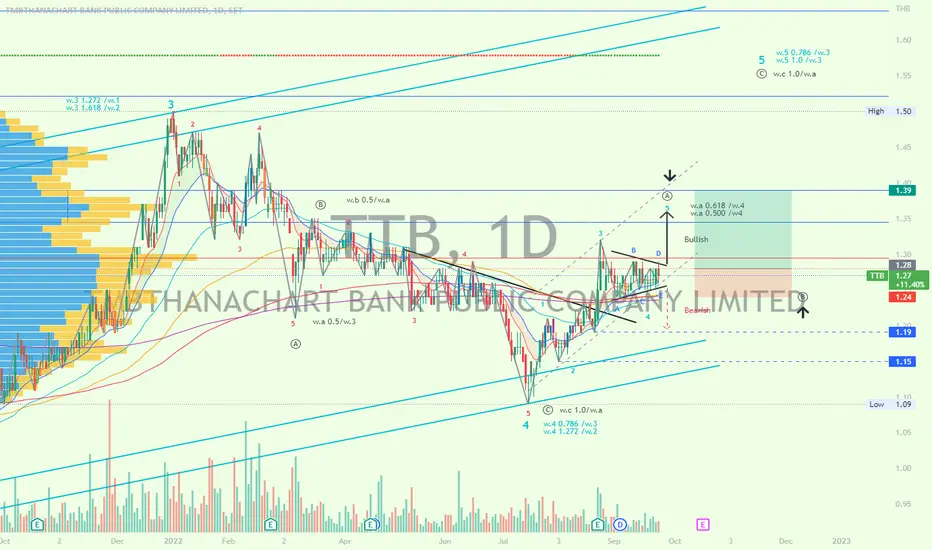
TTB | Wave Analysis | Triangle 4-wave Trading SetupPrice action and chart pattern trading
> An overall global leading diagonal pattern with a possible A -wave uptrend with minor triangle 4-wave
> Target minor 5-wave of local A wave at 0.5 - 0.618 retracement global 4 wave +8-10%
> Stoploss @ lower triangle support - 3 - 4%
> RRR: 2.5:1
Always trad
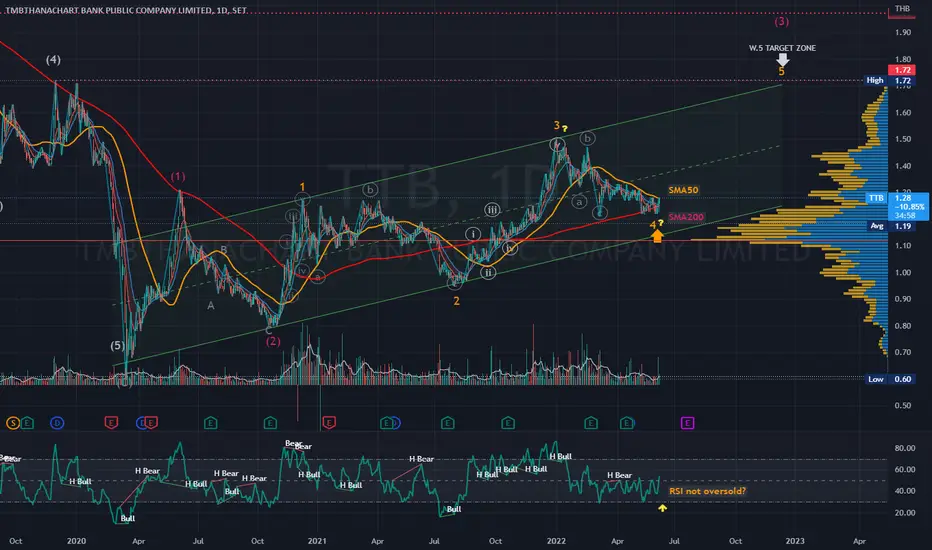
TTB | Wave Analysis - Possible Target DowntrendPrice action and chart pattern trading
> A possible target downtrend is within the range at SMA200 zone
> Wave 4 Zigzag family ABC currently retraced 0.5 Fibonacci of wave 3 which slightly overlapped with wave 1 is still valid.
> Long Entry @ SMA50 breakout zone as dynamic wave resistance
> Stoploss
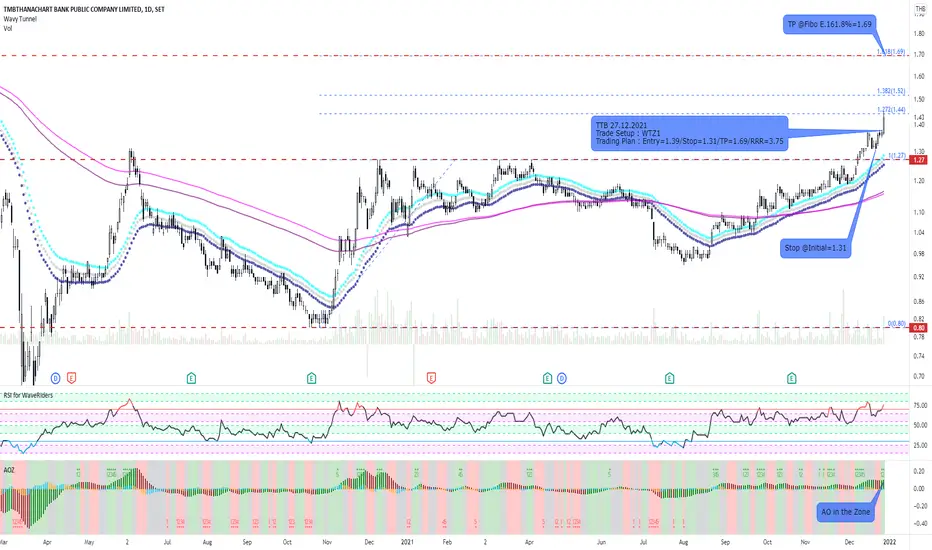
TTB and WTZ1 Trade SetupFor TTB, we had first entry 2 month ago as a pre-buy signal. Some positions have been liquidated due to hitting the target price. However, this is another opportunity to trade on WTZ1 setup. Good luck.
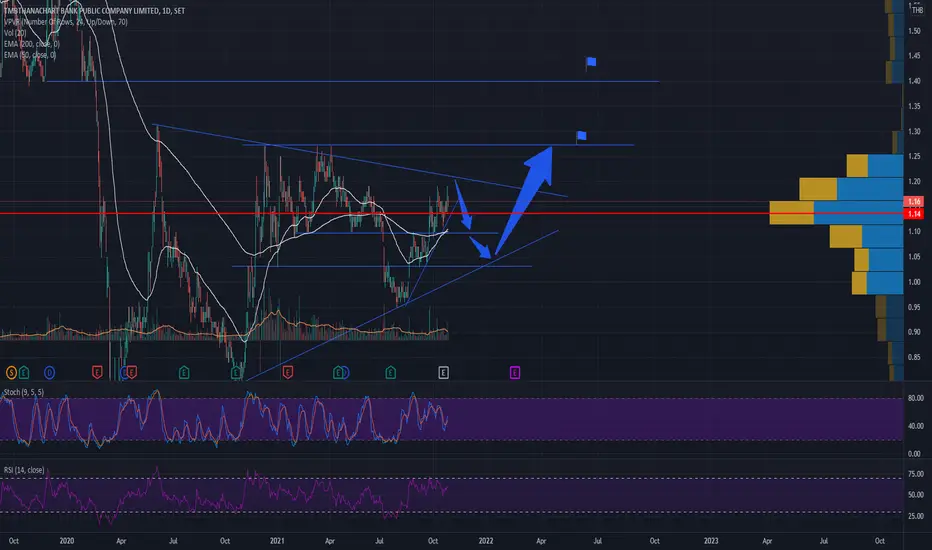
TTB back to base for new wave
price up to 1.20 and down to 1.10
entry @ 1.10
cutloss @ 1.03-1.05 if deep down on support line
target @ 1.27 / 1.40 if break resistance line
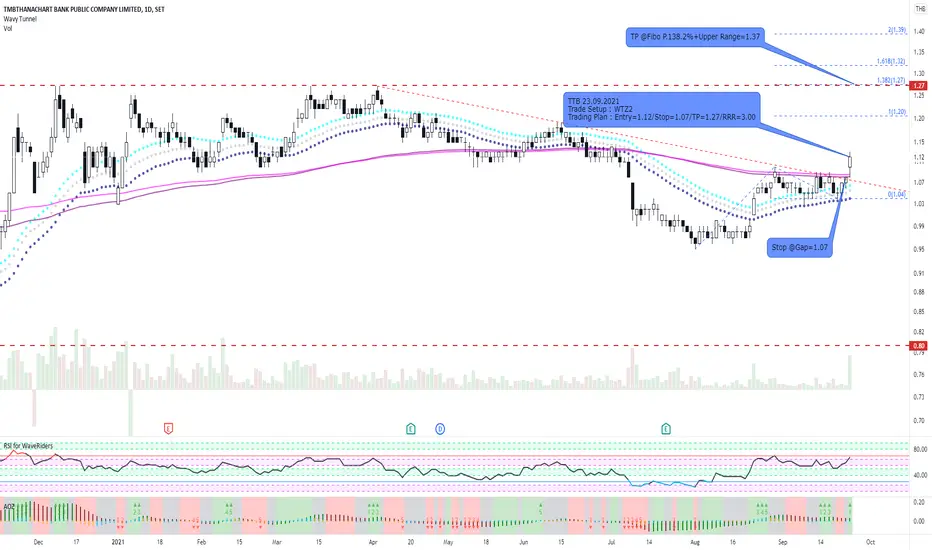
TTB and WTZ2+Upper RangeTTB and WTZ2+Upper Range. Take this opportunities but manage your risks well. Good Luck
TTB price fallTTB is not going to receiving any payment back from the loan they gave to the business and personal loan anytime soon for at least a year.
It has a high chance that it will continue going down.

See all ideas
Summarizing what the indicators are suggesting.
Oscillators
Neutral
SellBuy
Strong sellStrong buy
Strong sellSellNeutralBuyStrong buy
Oscillators
Neutral
SellBuy
Strong sellStrong buy
Strong sellSellNeutralBuyStrong buy
Summary
Neutral
SellBuy
Strong sellStrong buy
Strong sellSellNeutralBuyStrong buy
Summary
Neutral
SellBuy
Strong sellStrong buy
Strong sellSellNeutralBuyStrong buy
Summary
Neutral
SellBuy
Strong sellStrong buy
Strong sellSellNeutralBuyStrong buy
Moving Averages
Neutral
SellBuy
Strong sellStrong buy
Strong sellSellNeutralBuyStrong buy
Moving Averages
Neutral
SellBuy
Strong sellStrong buy
Strong sellSellNeutralBuyStrong buy
Displays a symbol's price movements over previous years to identify recurring trends.