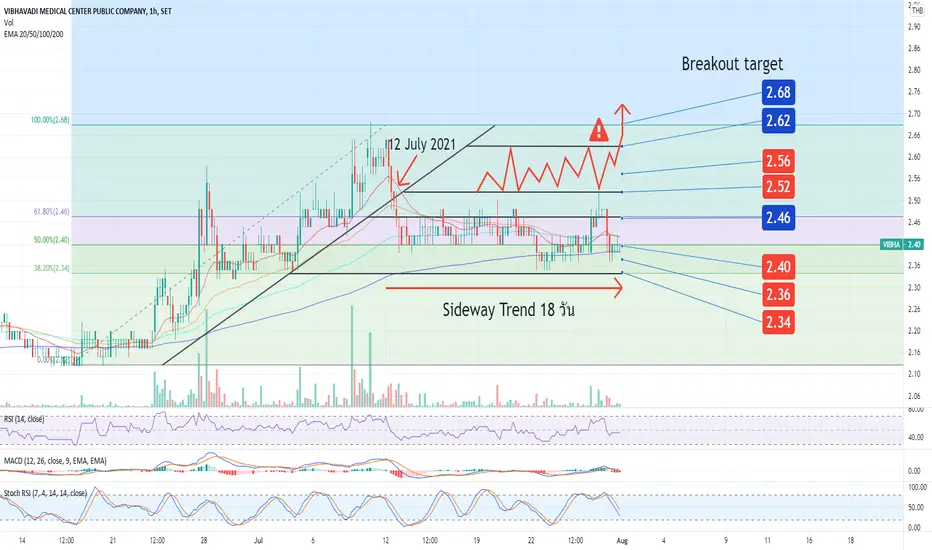
VIBHA | Symmetrical Triangle Breakout Entry SetupPrice Action and chart pattern trading setup
> symmetrical triangle breakout with smart money and banker chip volume support
> Entry at confirmed breakout or pullback retest candlestick above the triangle support
Indicator: bullish RSI above 50 strong uptrend and MACD crossed above baseline
RR: 2:
0.03 THB
698.61 M THB
8.55 B THB
About VIBHAVADI MEDICAL CENTRE CO
Sector
Industry
CEO
Pijit Viriyamettakul
Website
Headquarters
Bangkok
Founded
1986
ISIN
TH0295010R14
FIGI
BBG000BRZL39
Vibhavadi Medical Center Public Co.Ltd engages in the provision of medical services through Vibhavadi Hospital. Its services include wellness and occupational health service center, acupuncture, pediatric, surgical and dental clinics, emergency, eye and heart centers, and other medical services. It operates through the Hospital and Others segments. The Hospital segment refers to the general hospital, hospital in social security and the national health security office systems. The Others segment operates rental and hotel services. The company was founded on March 1, 1986 and is headquartered in Bangkok, Thailand.
Related stocks

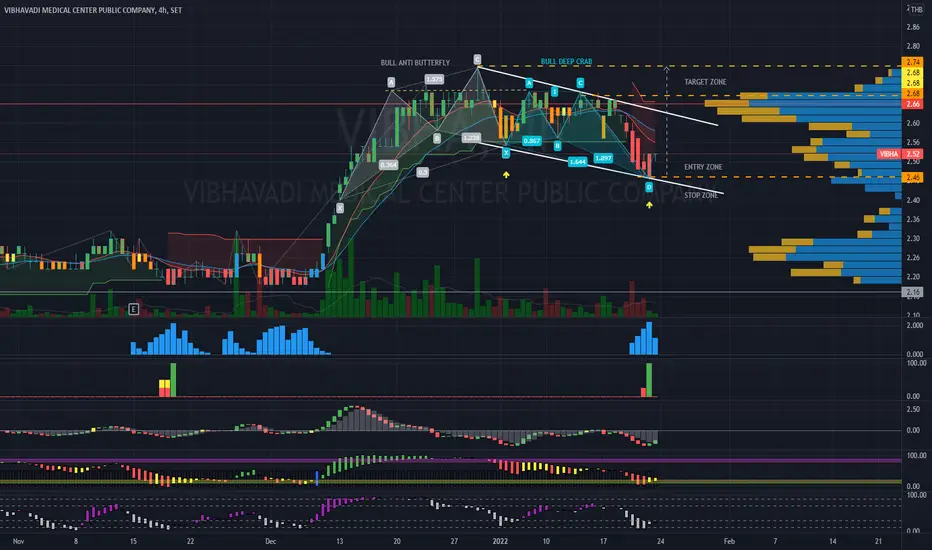
VIBHA | Bullish Harmonic Pattern | Entry Setup TF4HPrice Action & Chart Pattern Trading in ti
> Bullish Harmonic Butterfly and Deep Crab with reversal flag pattern
> Entry Zone @ Support flag
> Indicators| smart money entry | Banker Chip volume support | BBD banker signal turned green | positive FUND FLOW | KDJ divergence turning uptrend ribbon
Tr

VIBHAJust post memory actual buy into port.
IN 1.76, SL 1.60. Target#1- 2.22
Actual sell 1.8x (LOL).

See all ideas
Summarizing what the indicators are suggesting.
Oscillators
Neutral
SellBuy
Strong sellStrong buy
Strong sellSellNeutralBuyStrong buy
Oscillators
Neutral
SellBuy
Strong sellStrong buy
Strong sellSellNeutralBuyStrong buy
Summary
Neutral
SellBuy
Strong sellStrong buy
Strong sellSellNeutralBuyStrong buy
Summary
Neutral
SellBuy
Strong sellStrong buy
Strong sellSellNeutralBuyStrong buy
Summary
Neutral
SellBuy
Strong sellStrong buy
Strong sellSellNeutralBuyStrong buy
Moving Averages
Neutral
SellBuy
Strong sellStrong buy
Strong sellSellNeutralBuyStrong buy
Moving Averages
Neutral
SellBuy
Strong sellStrong buy
Strong sellSellNeutralBuyStrong buy
Displays a symbol's price movements over previous years to identify recurring trends.