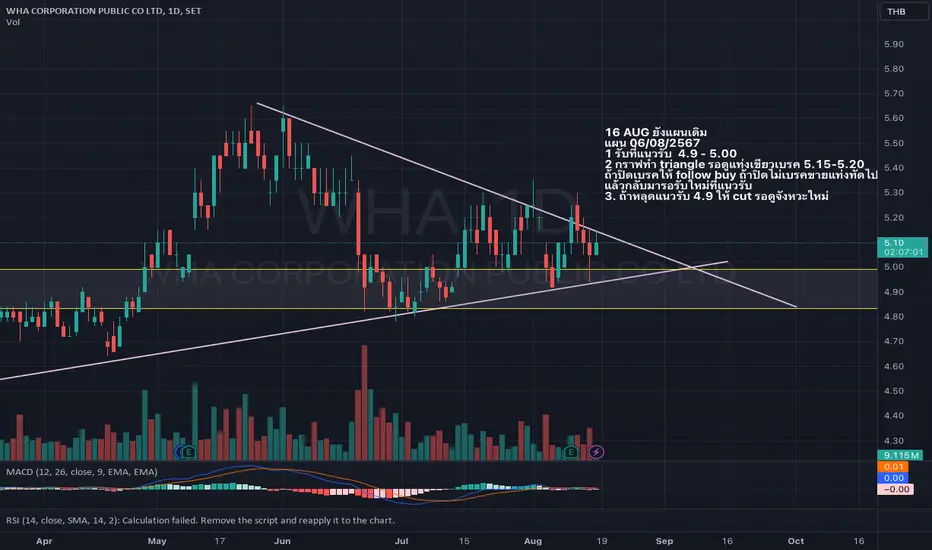
WHA plan 16 Aug 202416 AUG still using same plan
6 AUG 2204
1. support 4.9 - 5.00
2. techincal shows triangulation support-resistance
3. monitor if the price crossing up 5.15-5.20 then follow buy
if not monitor if the price drop down the strand line and standing
4. if crossing down 4.9 then cut and wait
0.34 THB
4.36 B THB
11.33 B THB
About WHA CORPORATION PUBLIC CO LTD
Sector
Industry
CEO
Jareeporn Jarukornsakul
Website
Headquarters
Bang Phli
Founded
2007
ISIN
TH3871010R19
FIGI
BBG003H31J96
WHA Corp. Public Co. Ltd. engages in the sale and leasing of properties. Its activities include the rental and sale of lands, buildings, factories, warehouses, and other properties; development and management of properties in industrial estates and industrial zones; and provision of digital services, data center, Internet connection, and other information technology services. It operates through the following segments: Synergy, Real Estate Development Business, Power Business, Water Business, and Other Business. The company was founded by Jareeporn Jarukornsakul on September 25, 2007 and is headquartered in Bang Phli, Thailand.
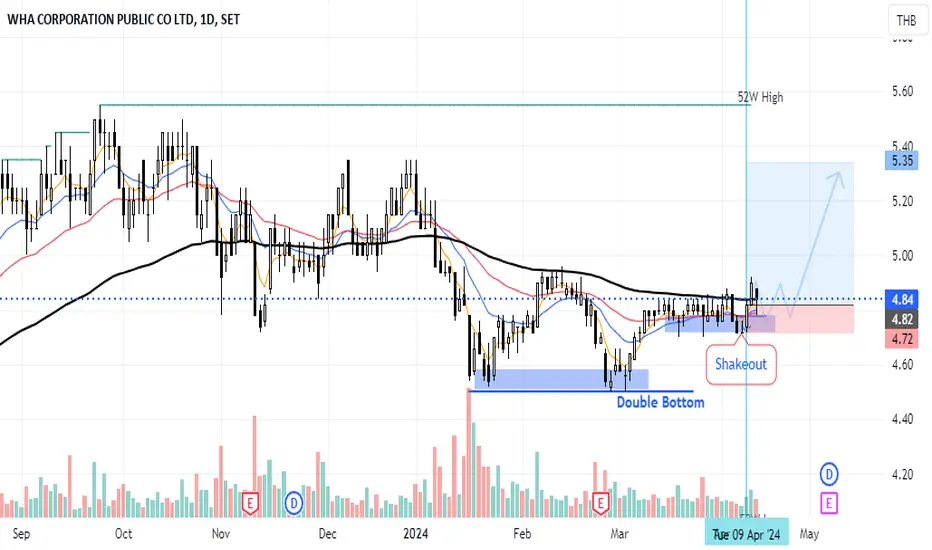
WHA Looking good ***Trend analysis
Major-Uptrend
Minor-Sideway
***Pattern analysis
Major - Double bottom
Minor - Shakeout
***Tactics
1.Buy on Weakness
2.Price> MA
3.MA Cross up
Expected TP1 RR 1:5
Have a good trade kub :)
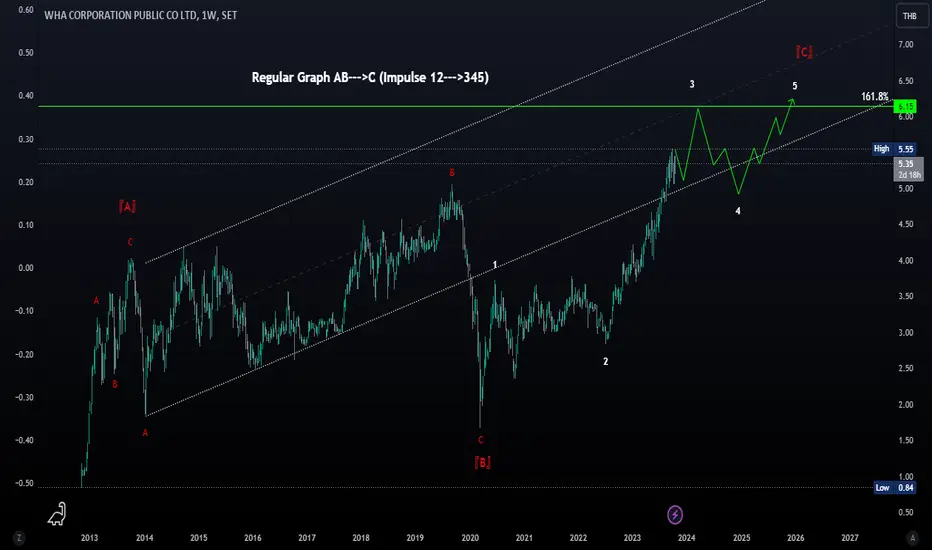
WHARegular Graph
Big Stacture is Flat
Position now AB Done and now i think it make wave --->C = mush be Impulse or Ending Diagoanl Positiion 12---> Now i think it make Wave --->345)
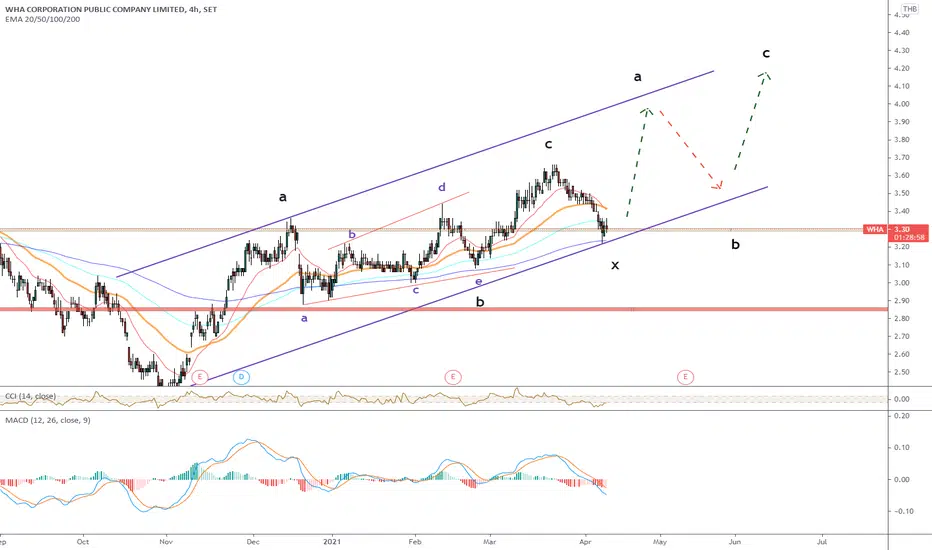
WHA | Wave Projection | ABCDE Rising Triangle TargetPrice action and chart pattern trading setup:
> The key level to watch for the price now almost reaches the upcoming channel resistance and minor ABC pattern T1 zone.
> Take partial profit recommendation, most likely to retest the triangle neckline or breakdown making E wave dump and pump pattern.
>

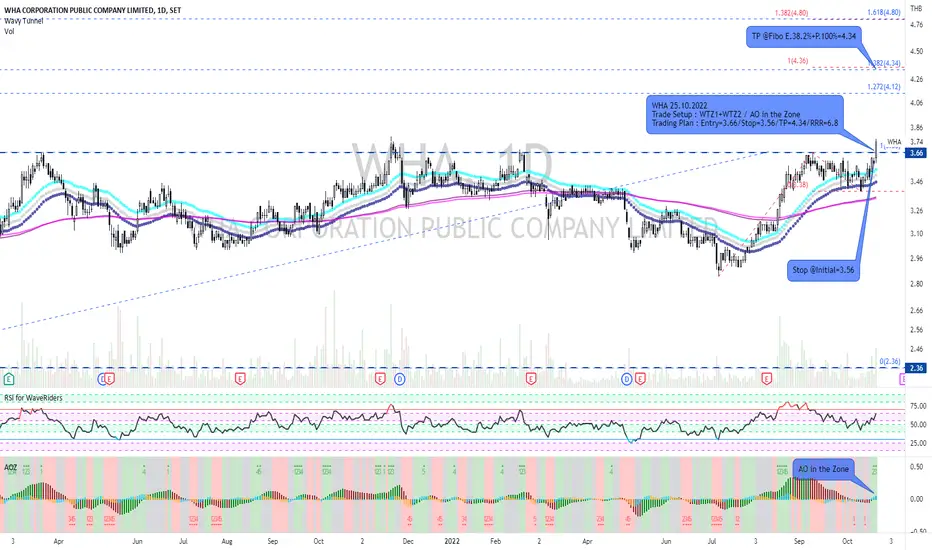
WHA and WTZ1/WTZ2 (Multi-Setup) + AO in the ZoneWHA has consolidated in several months with wide rage of sideway. Today, it just broke out the range with distinct volume and AO in the zone signal. I apply WTZ1 together with WTZ2 in multi-setup for fibo. measurement as the target while AO signal can enhance the competitive entry. However, don't
WHA | Wave Projection | Inverted H&S Bull DivergencePrice action and chart pattern trading setup:
> Wave projection possible intermediate 4-wave rebound with inverted head & shoulders reversal pattern and MACD bullish divergence
> Entry @ Neckline pullback
> Target @ H&S Target or 0.386 retracement of previous 3-wave +6% upside
> Stop @ right shoulde

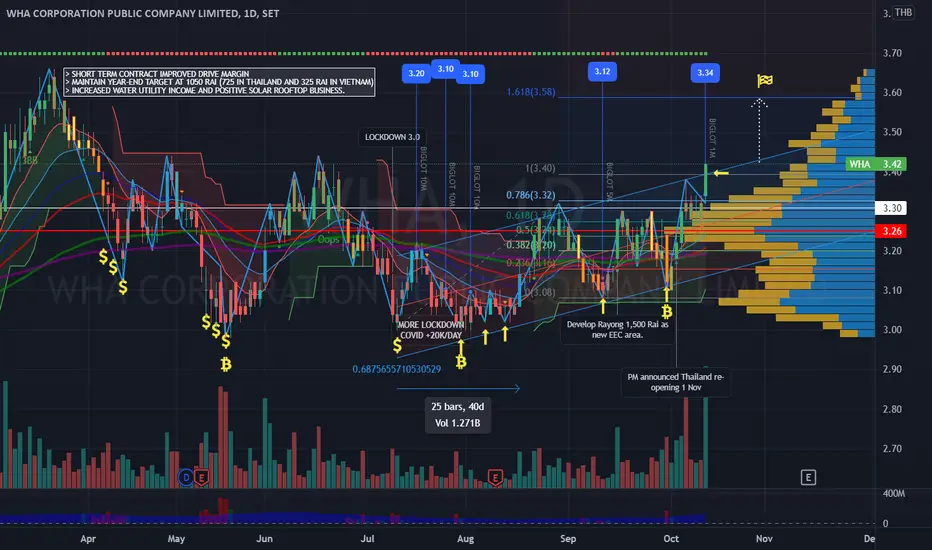
WHA | Breakout channel of trade | buy signal | TP 3.60 SL 3.30WHA breakout channel of trade upward trend - strong buy signal target price 3.60, stop loss 3.30
> Strong volume big lot 1 mil share push
> VA dominant on buy side
> positive BBD banker chip / fund flow
> average broker annual target price 4.80 - 5.00.

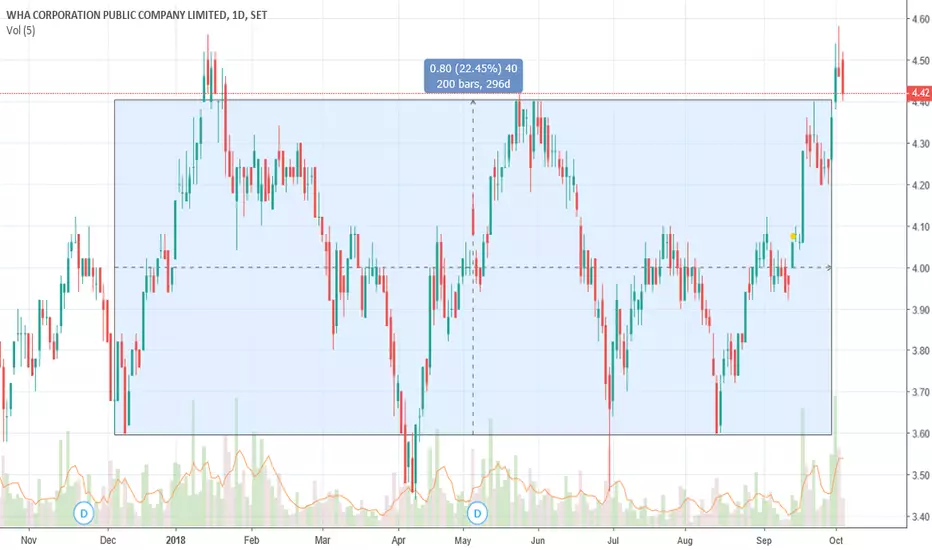
WHA : Long Position after new high 200 barsWHA : Long Position after new high 200 bars
I aim to open long position at 4.40 price
See all ideas
Summarizing what the indicators are suggesting.
Oscillators
Neutral
SellBuy
Strong sellStrong buy
Strong sellSellNeutralBuyStrong buy
Oscillators
Neutral
SellBuy
Strong sellStrong buy
Strong sellSellNeutralBuyStrong buy
Summary
Neutral
SellBuy
Strong sellStrong buy
Strong sellSellNeutralBuyStrong buy
Summary
Neutral
SellBuy
Strong sellStrong buy
Strong sellSellNeutralBuyStrong buy
Summary
Neutral
SellBuy
Strong sellStrong buy
Strong sellSellNeutralBuyStrong buy
Moving Averages
Neutral
SellBuy
Strong sellStrong buy
Strong sellSellNeutralBuyStrong buy
Moving Averages
Neutral
SellBuy
Strong sellStrong buy
Strong sellSellNeutralBuyStrong buy
Displays a symbol's price movements over previous years to identify recurring trends.