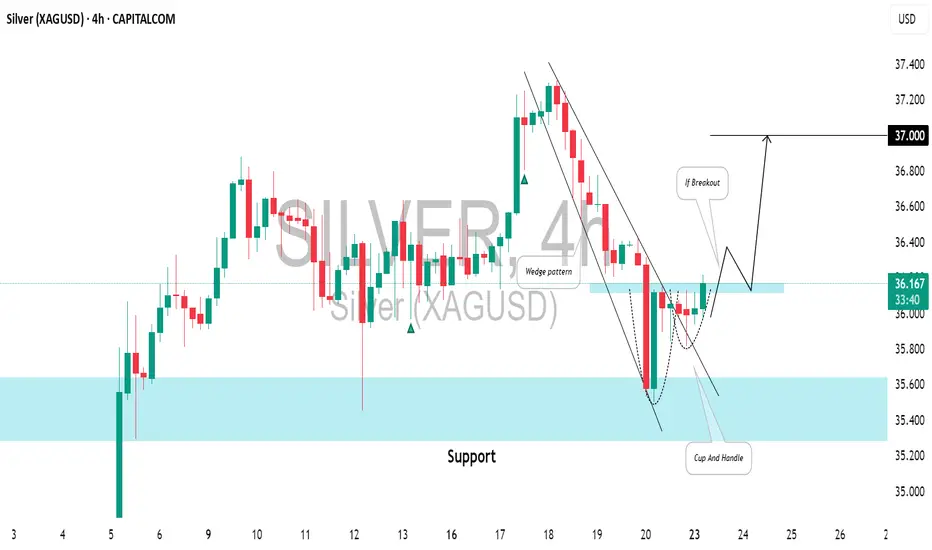
SILVER (XAGUSD): Waiting For BreakoutIt appears that ⚠️SILVER is gearing up for a bullish trend.
Analyzing the 4H time frame, I spotted a falling wedge pattern and a confirmed breakout above its upper boundary.
The final hurdle for buyers is the 36.11 - 36.17 neckline of a cup and handle pattern.
If the bulls manage to break and close above this level, it will serve as a significant bullish signal, likely leading to a continuation towards at least 37.00.
SILVER trade ideas
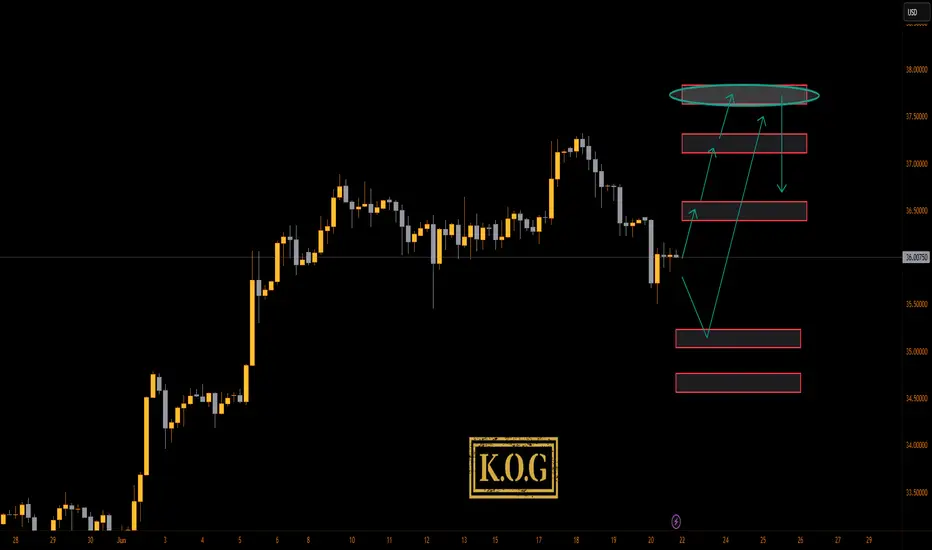
KOG - SILVERSILVER
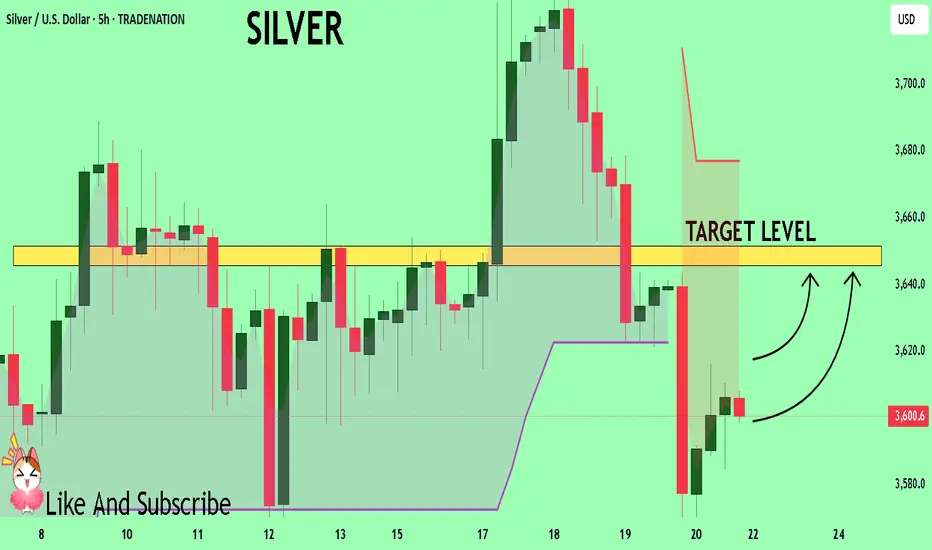
As with gold and oil, looking at this expecting a gap on open and potential for a move driven by the news. If we do spike down, the red box is the level to watch with the red box levels above as potential target levels on the breaks.
Please do support us by hitting the like button, leaving a comment, and giving us a follow. We’ve been doing this for a long time now providing traders with in-depth free analysis on Gold, so your likes and comments are very much appreciated.
As always, trade safe.
KOG
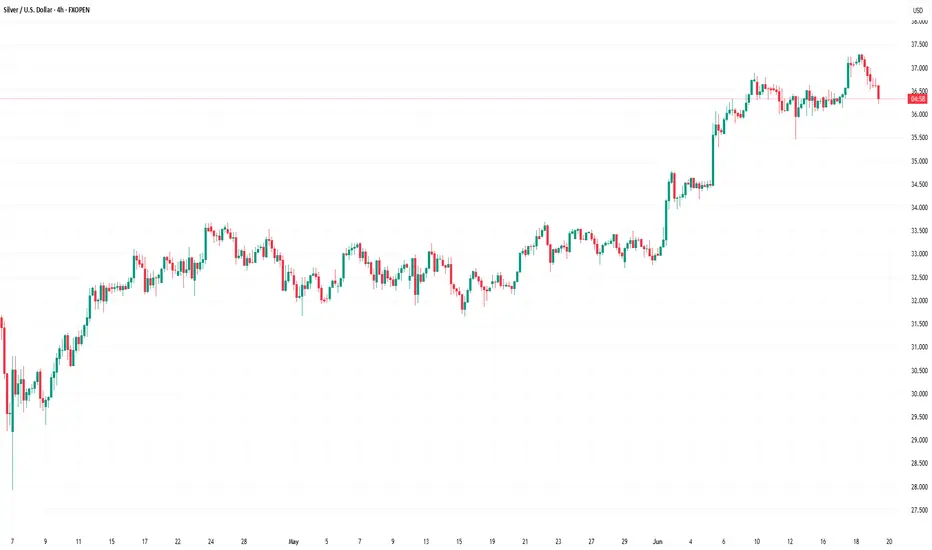
Silver Price Retreats from 2012 HighsSilver Price Retreats from 2012 Highs
As shown on the XAG/USD chart, the price of silver climbed above $37 per ounce yesterday — a level not seen since 2012. However, this morning, the price has dropped by approximately 2.5% from yesterday’s peak.
The bullish driver behind the rally has been fears that the US could become involved in a military conflict between Israel and Iran. Concerns in financial markets intensified after media reports stated that US officials are preparing for a potential strike on Iran.
Another factor influencing silver's price was the Federal Reserve’s decision to keep interest rates unchanged and maintain a cautious policy stance. Yesterday, Jerome Powell warned that President Trump’s tariffs could fuel inflation (a bullish signal for silver) and complicate the economic outlook.
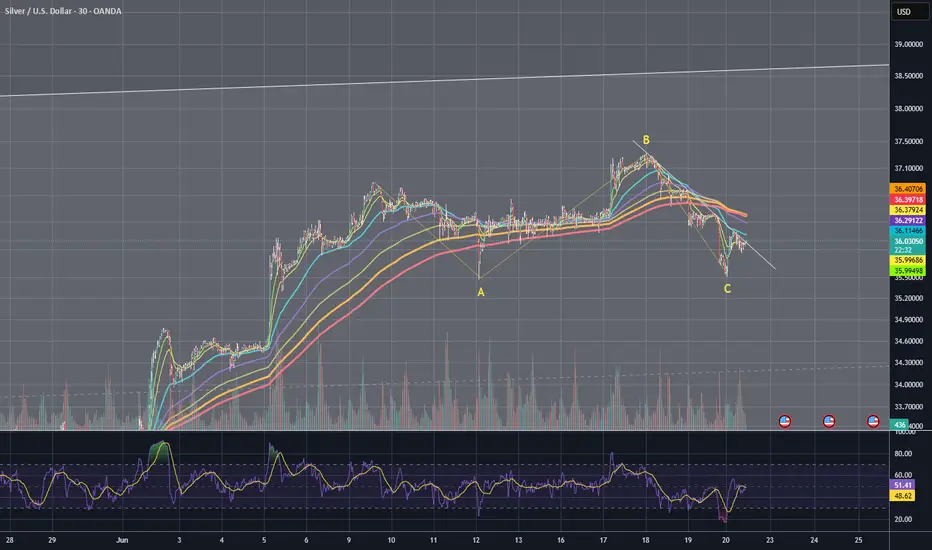
Technical Analysis of the XAG/USD Chart
In our previous analysis of the XAG/USD chart, we identified an upward channel. This channel remains relevant, though its configuration has shifted.
The price of silver remains in the upper part of the channel (a sign of strong demand). However, two signals suggest a potential correction may develop:
→ A bearish divergence on the RSI indicator;
→ A sharp decline from the channel’s upper boundary (marked with a red arrow), breaking through the local line that divides the upper half of the channel into quarters.
Nevertheless, given the scale of geopolitical risks, there is a chance that the bears may struggle to significantly shift the trend — especially with markets nearing the weekend closure.
This article represents the opinion of the Companies operating under the FXOpen brand only. It is not to be construed as an offer, solicitation, or recommendation with respect to products and services provided by the Companies operating under the FXOpen brand, nor is it to be considered financial advice.
market next move 🔻 Bearish Disruption Perspective:
1. Breakdown of the Support Zone
The highlighted red box is acting as support.
However, multiple retests of this zone indicate weakening support.
If price breaks below ~$35.50 decisively, it could trigger a bearish continuation.
2. Low Volume on Recent Candles
Volume appears to be declining during the latest consolidation phase.
A bullish breakout ideally requires increasing volume, which is not evident here.
This could indicate lack of buyer interest at this level.
3. Downtrend Momentum
The price is in a clear short-term downtrend (series of lower highs and lower lows).
Without a strong reversal signal (like a hammer, bullish engulfing), expecting a breakout may be premature.
4. Fundamental Risk Factors
Silver often reacts strongly to:
Interest rate decisions
USD strength
Inflation data

Multi Year Silver BreakOut to USD 42.11We're looking at XAGUSD breaking out to USD 42.11 after several years of being in consolidation and storing a lot of suppressed energy/ momentum which has broken out a few weeks back. This is also supported by a Gold Silver ratio exceeding 100 and as of now cooling down below 95.
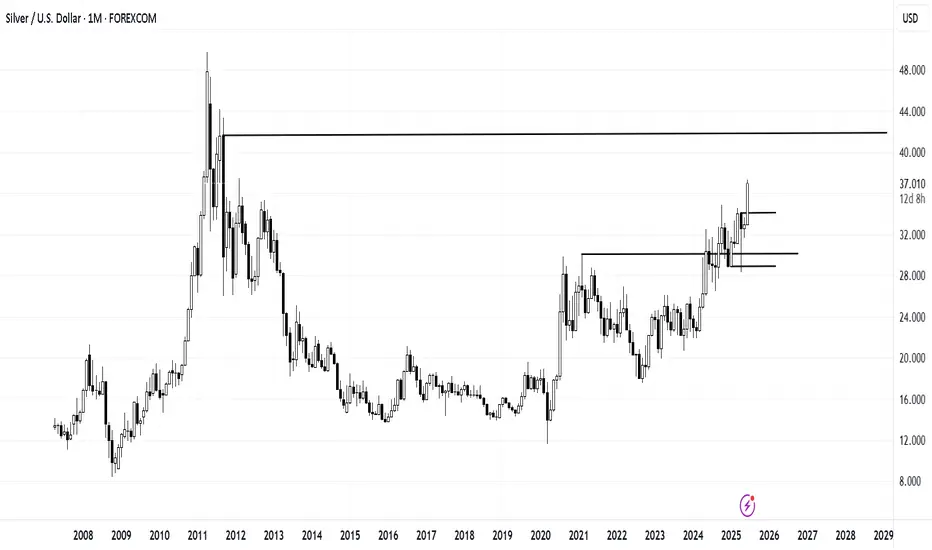
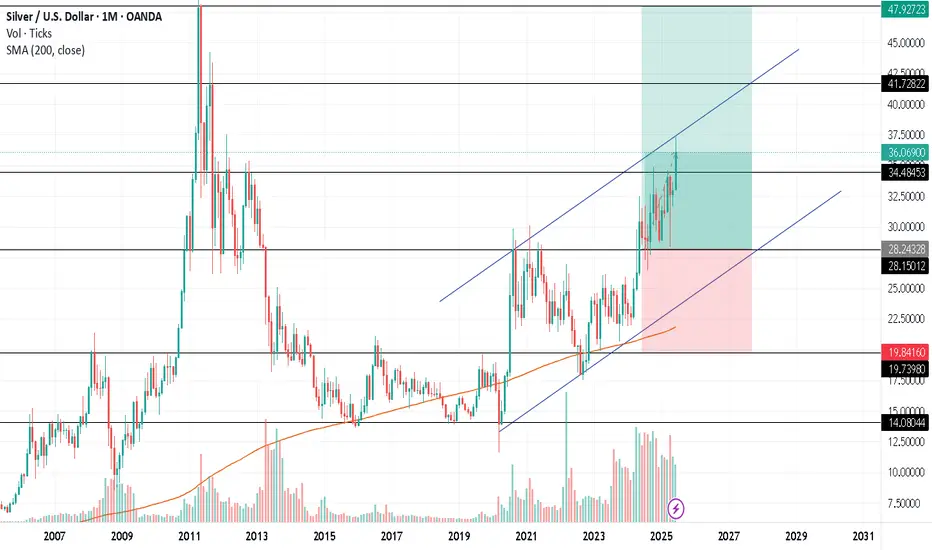
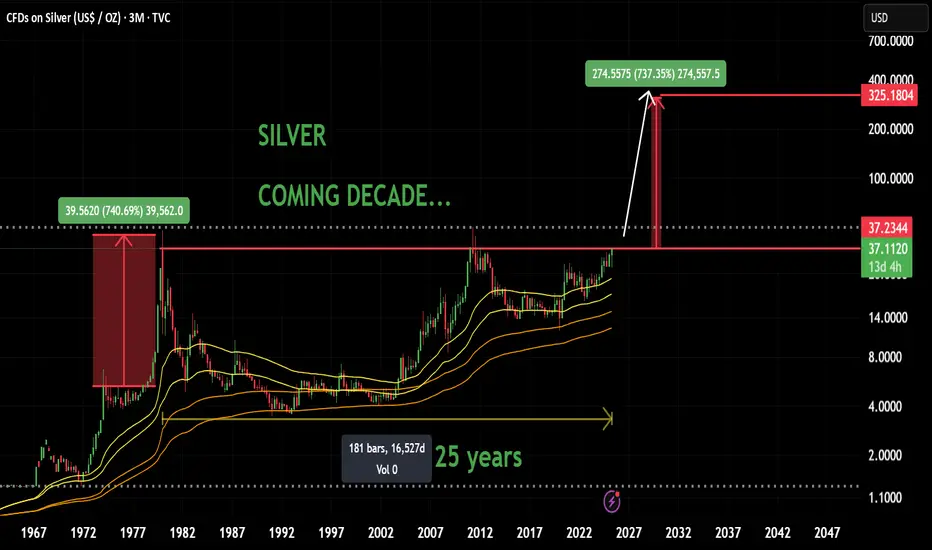
Silver Large Cup & Handle The image is a chart showing the price of silver (CFDs on Silver / USD per ounce) over time, from 2013 through 2025, with future projections. The chart suggests a bullish outlook for silver, possibly forecasting a rise to ~$41 based on historical patterns.

SILVER- LONG( positional and investments)TVC:SILVER 25 years of consolidation with cup handle formation on quarterly chart setup will predict that next 5 to 10 years may be good upward movements for silver.
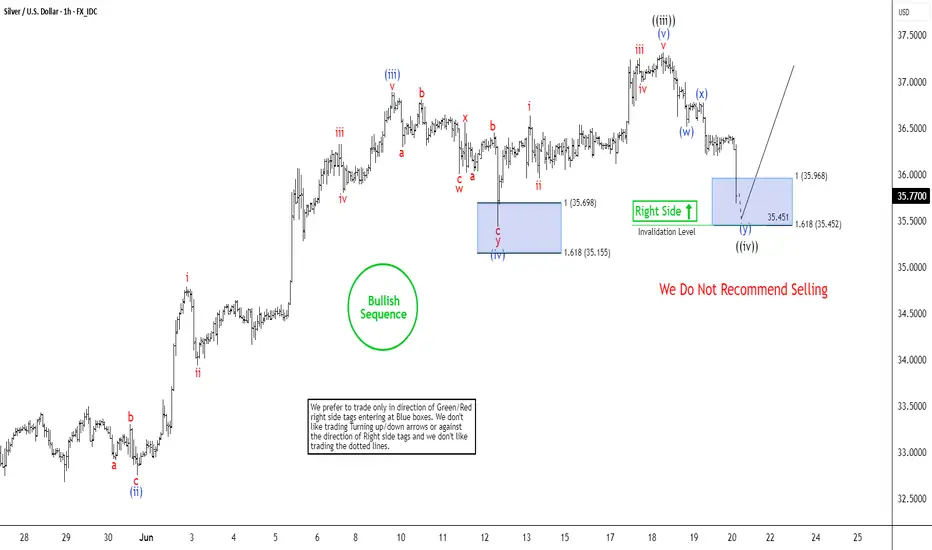
Silver (XAGUSD) Nears Key Support ZoneSilver (XAGUSD) has surged to a new 13-year high, decisively confirming the bullish trend in the precious metal. The ongoing rally, which began from the May 15, 2025 low, is unfolding as an impulsive Elliott Wave structure, characterized by strong upward momentum. From the May 15 low, wave 1 peaked at 33.69. A corrective pullback in wave 2 followed that concluded at 32.58. The metal then resumed its ascent in wave 3, demonstrating robust bullish sentiment.
Within wave 3, the internal structure is clear. Wave ((i)) reached 33.56 and a shallow pullback in wave ((ii)) followed to 32.67. The subsequent wave ((iii)) propelled silver to a high of 37.31, underscoring the strength of the uptrend. Currently, a corrective wave ((iv)) is unfolding as a double three Elliott Wave pattern. From the wave ((iii)) peak, wave (w) declined to 36.51, followed by a brief recovery in wave (x) to 36.78.
The ongoing decline in wave (y) is expected to find support between 35.45 and 35.96, potentially completing wave ((iv)). Once this correction concludes, silver is poised to either extend higher in wave ((v)) to a new peak or rally in at least three waves, reinforcing the bullish outlook.
SILVER: Will Go Up! Long!
My dear friends,
Today we will analyse SILVER together☺️
The in-trend continuation seems likely as the current long-term trend appears to be strong, and price is holding above a key level of 36.351 So a bullish continuation seems plausible, targeting the next high. We should enter on confirmation, and place a stop-loss beyond the recent swing level.
❤️Sending you lots of Love and Hugs❤️
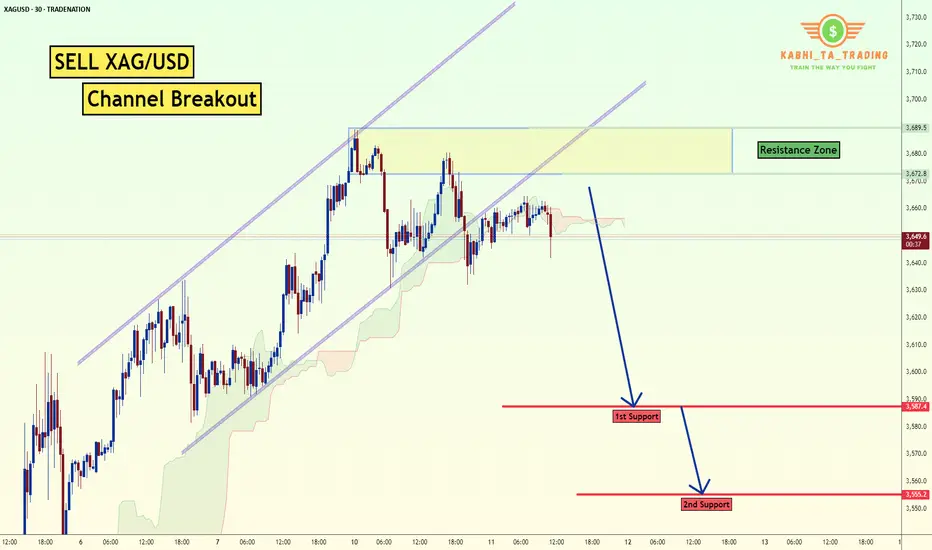
XAG/USD - Channel Breakout (11.06.2025) The XAG/USD Pair on the M30 timeframe presents a Potential Selling Opportunity due to a recent Formation of a CHannel Breakout Pattern. This suggests a shift in momentum towards the downside in the coming hours.
Possible Short Trade:
Entry: Consider Entering A Short Position around Trendline Of The Pattern.
Target Levels:
1st Support – 3587
2nd Support – 3555
🎁 Please hit the like button and
🎁 Leave a comment to support for My Post !
Your likes and comments are incredibly motivating and will encourage me to share more analysis with you.
Best Regards, KABHI_TA_TRADING
Thank you.
Disclosure: I am part of Trade Nation's Influencer program and receive a monthly fee for using their TradingView charts in my analysis.
SILVERSilver, US 10-Year Yield, and Interest Rate Dynamics
the relationship between silver prices, the US 10-year Treasury yield (US10Y), and interest rates is characterized by strong inverse correlations, driven by macroeconomic forces and monetary policy expectations. Below is a detailed analysis:
1. Silver and US 10-Year Yield: Inverse Correlation
Core Mechanism: Silver prices typically move inversely to the US 10-year yield. When bond yields rise, silver becomes less attractive as a non-yielding asset, increasing its opportunity cost. Conversely, falling yields boost silver’s appeal.
Current Data (June 2025):
US10Y: ~4.377% (slightly down from recent peaks).
Silver (XAG/USD): ~$36.02.00/oz,
Historical Evidence:
A correlation coefficient of -0.94 between silver and 5-year yields (and -0.86 vs. 10-year yields) confirms this inverse link.
Periods of declining yields (e.g., 2024–2025) coincided with silver rallies (Aprail 2024 and jan 2025) silver buyers come bullish
2. Interest Rates and Silver: Opportunity Cost Driver
Rate Hikes: Higher interest rates strengthen the dollar and increase the opportunity cost of holding silver, pressuring prices.
Rate Cuts: Lower rates weaken the dollar and reduce silver’s opportunity cost, boosting demand.
Fed Policy Impact (June 2025):
The Fed held rates at 4.25%–4.50%, but signaled potential cuts in late 2025, will give silver under valued metal a bullish impulse.
Geopolitical/Safe-Haven Demand Conflicts (e.g., Israel-Iran) or recessions increase silver’s appeal.
Industrial Demand Renewable energy/electronics demand provides structural support.
4. Current Market Outlook
Bearish Pressures:
Rising bond yields or delayed Fed cuts could trigger silver selloffs.
US10Y above 4.5% historically pressured silver.
Bullish Catalysts:
Fed rate cuts (expected late 2025) and falling real yields could drive silver toward $40/oz. to 50$
Geopolitical risks and sustained central bank buying (e.g., inflation hedging) add upside.
Conclusion: Silver remains highly responsive to US10Y and interest rate shifts, with real yields being the paramount driver. In 2025, silver’s rally hinges on Fed easing, subdued real yields, and safe-haven demand—though bond yield resurgences pose risks.
#silver #gold #dollar

Silver is Again in the Bullish directionHello Traders
In This Chart XAGUSD HOURLY Forex Forecast By FOREX PLANET
today XAGUSD analysis 👆
🟢This Chart includes_ (XAGUSD market update)
🟢What is The Next Opportunity on XAGUSD Market
🟢how to Enter to the Valid Entry With Assurance Profit
This CHART is For Trader's that Want to Improve Their Technical Analysis Skills and Their Trading By Understanding How To Analyze The Market Using Multiple Timeframes and Understanding The Bigger Picture on the Charts
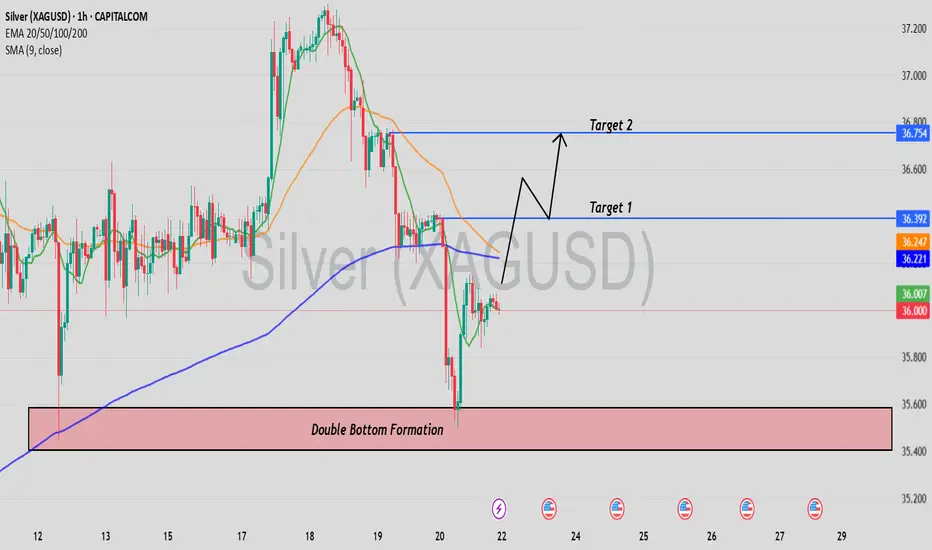
Bullish Continuation?We may have just finished a bullish correction phase.
If silver can reclaim $36.30 hold then I'd consider the bullish trend to be back and look to buy pullback on our way up to $40+
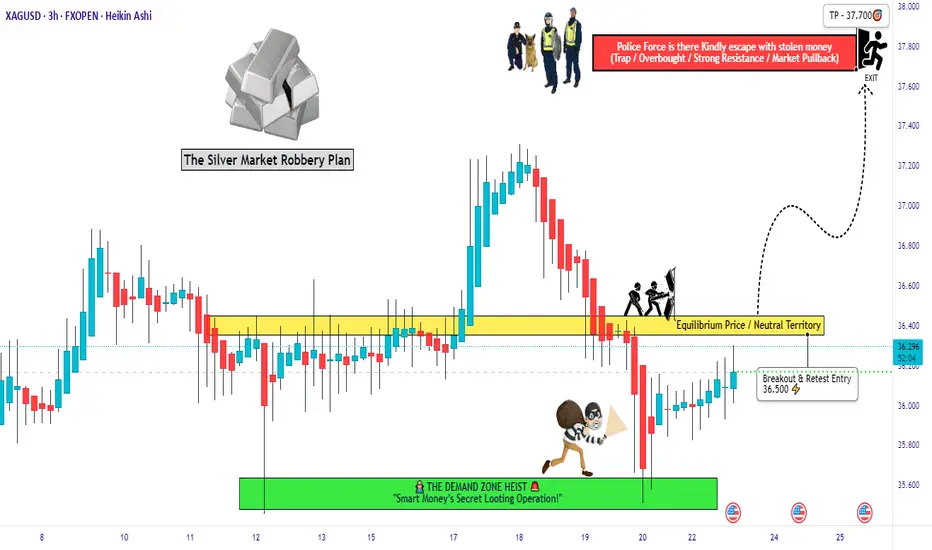
“Can This XAG/USD Setup Make You the Next Market Thief?”🏴☠️ Operation Silver Swipe — Thief Trading Heist Plan for XAG/USD 🪙💸
🚨 Target Locked: The Silver Vault 🧳🎯
🌟Hi! Hola! Ola! Bonjour! Hallo! Marhaba!🌟
Dear Market Hustlers & Chart Whisperers, 🕵️♂️💼📉💰
Step into the shadows with our stealth plan based on our signature Thief Trading Style—a mix of smart technicals and crafty fundamentals. Today, we’re eyeing XAG/USD (Silver) for a clean sweep. Here's how to gear up for the breakout job:
🎯 Entry Zone — “The Heist Is On!” 💥
📍Key Level: Break & Retest above 36.500 – that's your cue to act.
🔑Strategy:
Buy Stop Orders: Set above the breakout level
Buy Limit Orders: Use recent 15/30M swings for a sneaky pullback entry 🎯
🛑 Stop Loss — “Every Thief Has a Backup Plan” 🎭
Place your SL like a pro, not a panic button!
📌Recommended: Around 31.700 using the 4H swing low
⚠️Tip: Adjust based on your risk appetite, lot size, and number of entries. You’re the mastermind, not a minion.
🎯 Target — “Escape Route” 🏃♂️💸
📌 First checkpoint: 37.700
📌 Or take your loot early if the heat rises! (Overbought zones, trend traps, or reversal zones)
💡 Scalper's Shortcut 💡
Go only long for safety. If you’ve got the cash stack, jump in fast. If you’re more of a sneaky swing trader, follow the roadmap and trail your SL to secure that bag 🧳📈
🔍 Market Status
Silver’s in a Neutral Phase – but signs point to an upward getaway 🚀
Fueling this momentum:
Macro & Fundamental trends
COT Positioning
Intermarket Clues
Sentimental Signals
🔗 Read the full breakdown check there 👉🔗🔗🌏🌎!
📢 Trading Alert — News Release Caution ⚠️
Don’t get caught mid-escape during news bombs! 💣
✅ Avoid fresh entries during high-impact events
✅ Use trailing SL to lock in your gains and cover your tracks
💖 Smash the Boost Button if you vibe with this plan 💥
Support the crew and help keep the charts hot and the loot flowing. Your boost powers up our next big heist 🚁🔥
📡 Stay tuned for more street-smart setups... we rob the charts, not the rules! 🐱👤💸📊💎
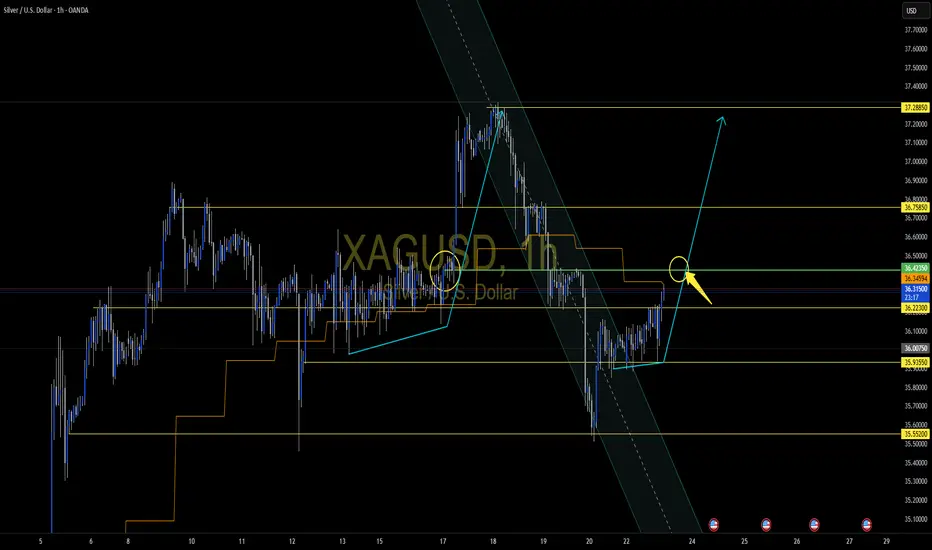
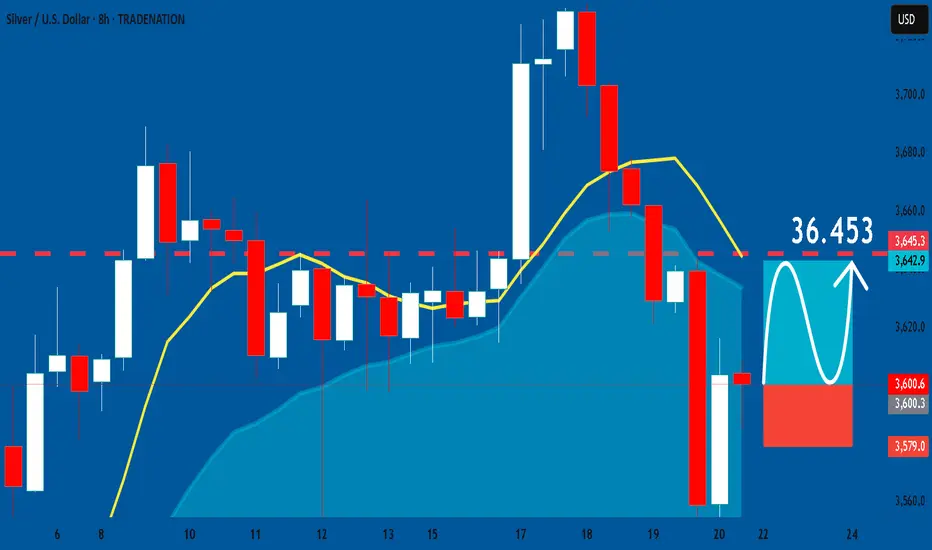
SILVER On The Rise! BUY!
My dear followers,
I analysed this chart on SILVER and concluded the following:
The market is trading on 36.006 pivot level.
Bias - Bullish
Technical Indicators: Both Super Trend & Pivot HL indicate a highly probable Bullish continuation.
Target - 36.456
About Used Indicators:
A super-trend indicator is plotted on either above or below the closing price to signal a buy or sell. The indicator changes color, based on whether or not you should be buying. If the super-trend indicator moves below the closing price, the indicator turns green, and it signals an entry point or points to buy.
Disclosure: I am part of Trade Nation's Influencer program and receive a monthly fee for using their TradingView charts in my analysis.
———————————
WISH YOU ALL LUCK
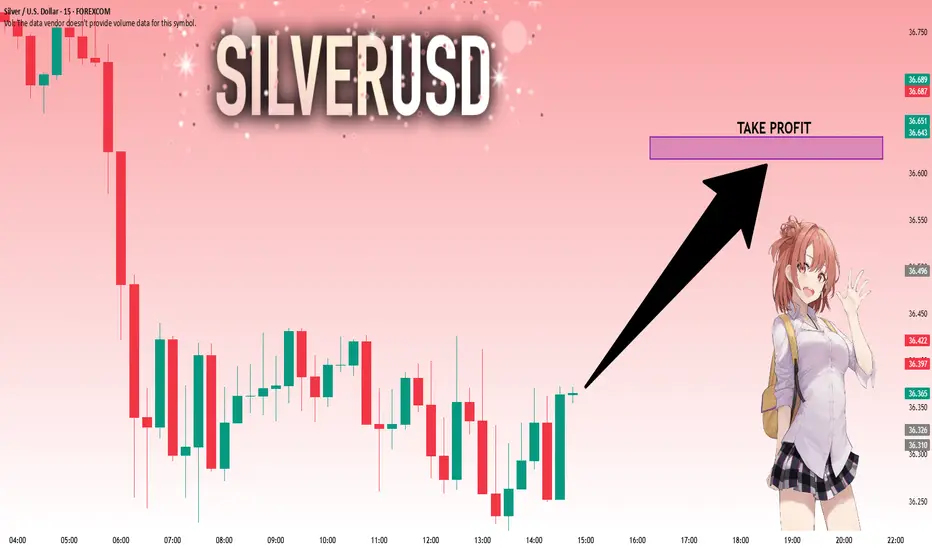
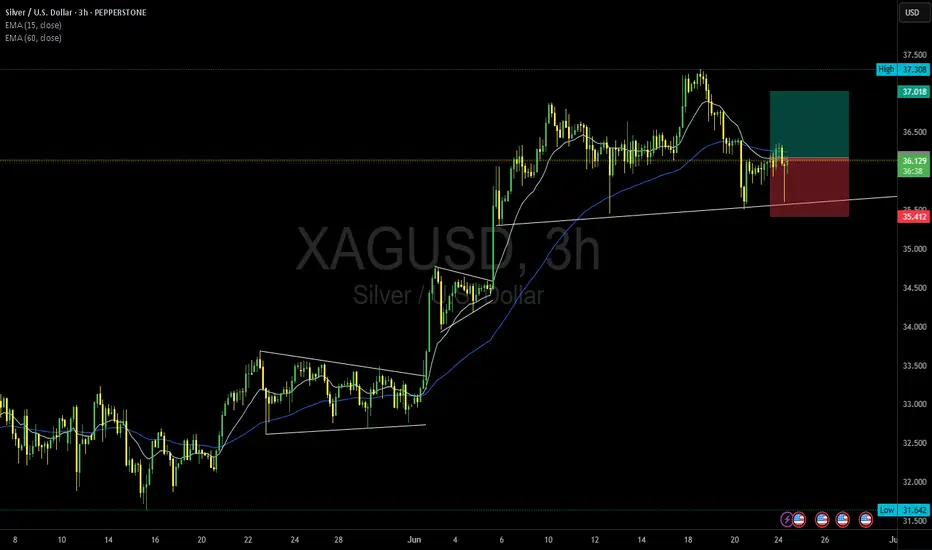
XAGUSD - Buy for RR1XAGUSD – Positioning for a Continuation Push 🚀
Silver's recent structure shows bulls defending the 35.5 region with conviction. After a healthy consolidation, price has reclaimed short-term momentum, eyeing a return to previous highs.
I'm entering long from 36.147, expecting bullish continuation toward the next key resistance level.
Entry: 36.147
Take Profit (TP): 37.0
Stop Loss (SL): 35.4
RR:1
Let’s see how price action unfolds — I’ll be watching closely for momentum confirmation.
#XAGUSD #SILVER #MJTRADING #FOREX #SIGNALS
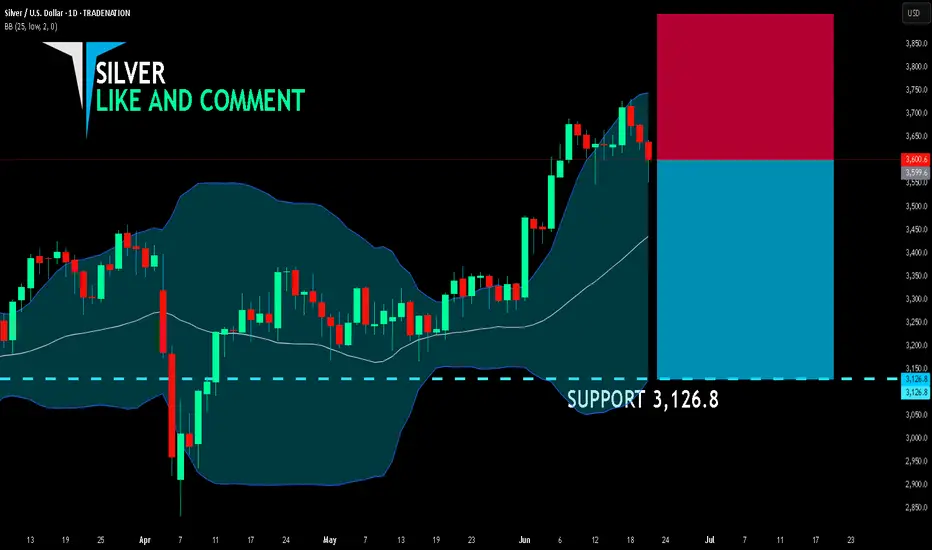
SILVER SELLERS WILL DOMINATE THE MARKET|SHORT
SILVER SIGNAL
Trade Direction: short
Entry Level: 3,599.6
Target Level: 3,126.8
Stop Loss: 3,914.2
RISK PROFILE
Risk level: medium
Suggested risk: 1%
Timeframe: 1D
Disclosure: I am part of Trade Nation's Influencer program and receive a monthly fee for using their TradingView charts in my analysis.
✅LIKE AND COMMENT MY IDEAS✅
Silver possible repeat pattern setting upJust trying to see where the next move will be. The pattern trying tp plays out should be soon wait for your confirmations before entering. Hope this helps
SILVER: Long Trading Opportunity
SILVER
- Classic bullish formation
- Our team expects growth
SUGGESTED TRADE:
Swing Trade
Buy SILVER
Entry Level -36.006
Sl - 35.790
Tp - 36.453
Our Risk - 1%
Start protection of your profits from lower levels
Disclosure: I am part of Trade Nation's Influencer program and receive a monthly fee for using their TradingView charts in my analysis.
❤️ Please, support our work with like & comment! ❤️
Silver Under Pressure with Dollar on the MoveSitting in a rising wedge and with momentum indicators rolling over, the ducks look to be lining up for a potential downside break for silver. Throw in signs the U.S. dollar may have bottomed—an adversary to commodity prices—and the unwind could be sizeable, especially if risk appetite were to evaporate.
If silver were to break beneath wedge support and hold there, it would allow for shorts to be established with a tight stop above the level for protection. $35.50—where the price bounced strongly from on June 12—screens as an initial target. If broken, it would bring uptrend support established in early April, along with the October 2024 highs at $34.87, into play.
Bullish momentum that helped power silver higher is also showing signs of waning—we’ve seen bearish divergence between RSI (14) and price, while MACD is also rolling over towards the signal line. The momentum picture isn’t outright bearish but just looks heavy.
Another important factor to consider beyond technicals is that silver and other commodity prices often struggle in an environment where the U.S. dollar is strengthening. That point is reinforced by the inverse correlation between silver and DXY over the past month, sitting with a score of -0.66—not strong by any stretch, but not something you can ignore either.
Good luck!
DS

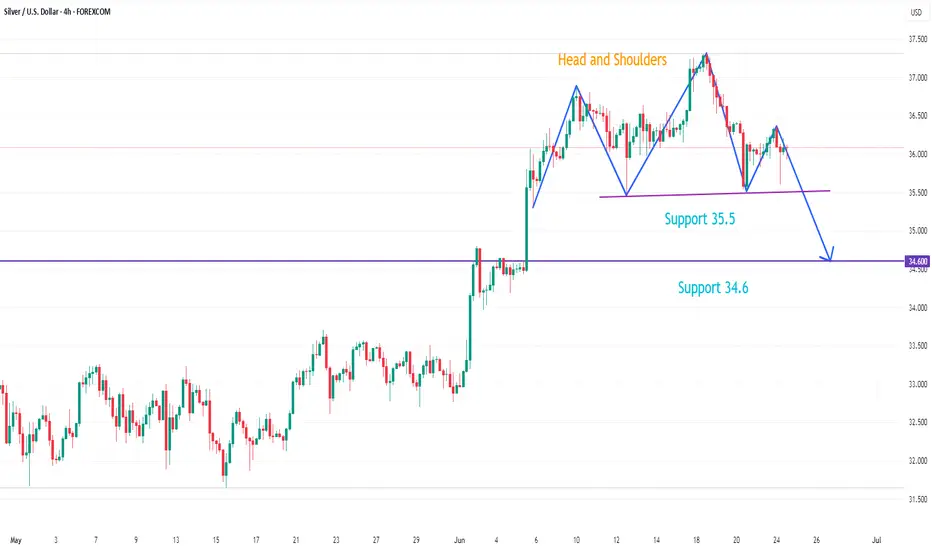
XAGUSD potential head and shoulders topOn the 4-hour chart, XAGUSD has formed a potential head and shoulders top pattern. Currently, we can focus on the support around 35.5. If it falls below, it is expected to continue to fall, and the downside target is around 34.6.
US500,DXY, EURUSD & XAGUSD Daily Trade SetupsIn this update we review the recent price action in the SP500, Euro, Dollar & SIlver and identify the next high-probability trade setups and price objectives to target. To review today's video analysis, click here!
