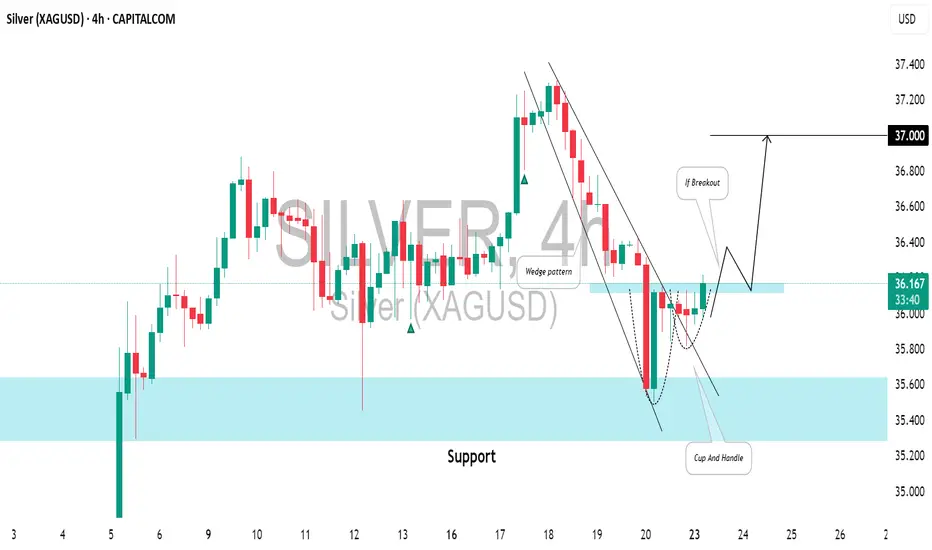
SILVER (XAGUSD): Waiting For BreakoutIt appears that ⚠️SILVER is gearing up for a bullish trend.
Analyzing the 4H time frame, I spotted a falling wedge pattern and a confirmed breakout above its upper boundary.
The final hurdle for buyers is the 36.11 - 36.17 neckline of a cup and handle pattern.
If the bulls manage to break and
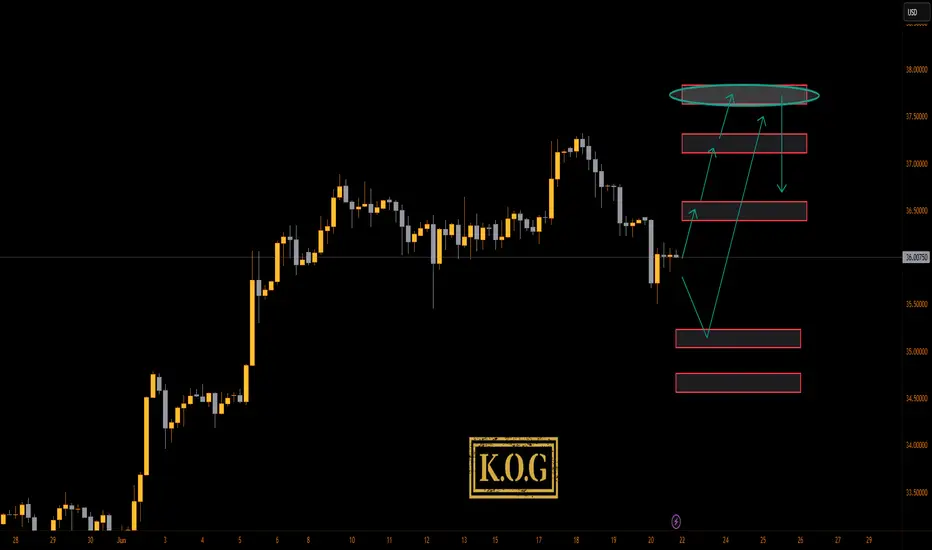
KOG - SILVERSILVER
As with gold and oil, looking at this expecting a gap on open and potential for a move driven by the news. If we do spike down, the red box is the level to watch with the red box levels above as potential target levels on the breaks.
Please do support us by hitting the like button, leavi
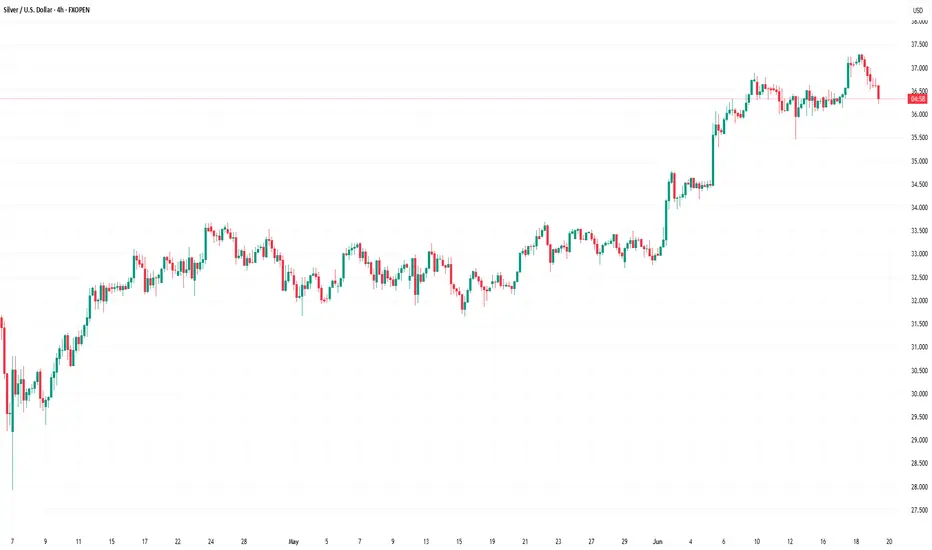
Silver Price Retreats from 2012 HighsSilver Price Retreats from 2012 Highs
As shown on the XAG/USD chart, the price of silver climbed above $37 per ounce yesterday — a level not seen since 2012. However, this morning, the price has dropped by approximately 2.5% from yesterday’s peak.
The bullish driver behind the rally has been fear
market next move 🔻 Bearish Disruption Perspective:
1. Breakdown of the Support Zone
The highlighted red box is acting as support.
However, multiple retests of this zone indicate weakening support.
If price breaks below ~$35.50 decisively, it could trigger a bearish continuation.
2. Low Volume on Recent Candles

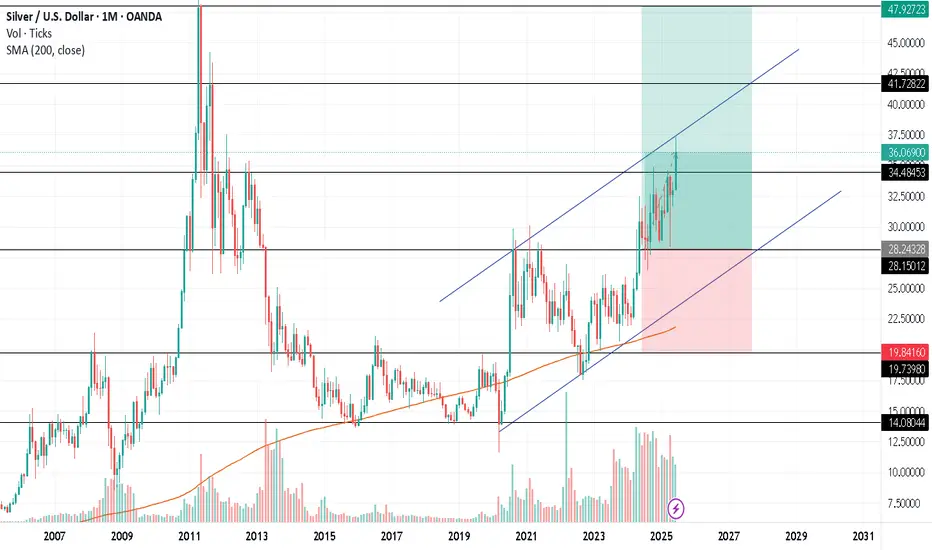
Multi Year Silver BreakOut to USD 42.11We're looking at XAGUSD breaking out to USD 42.11 after several years of being in consolidation and storing a lot of suppressed energy/ momentum which has broken out a few weeks back. This is also supported by a Gold Silver ratio exceeding 100 and as of now cooling down below 95.
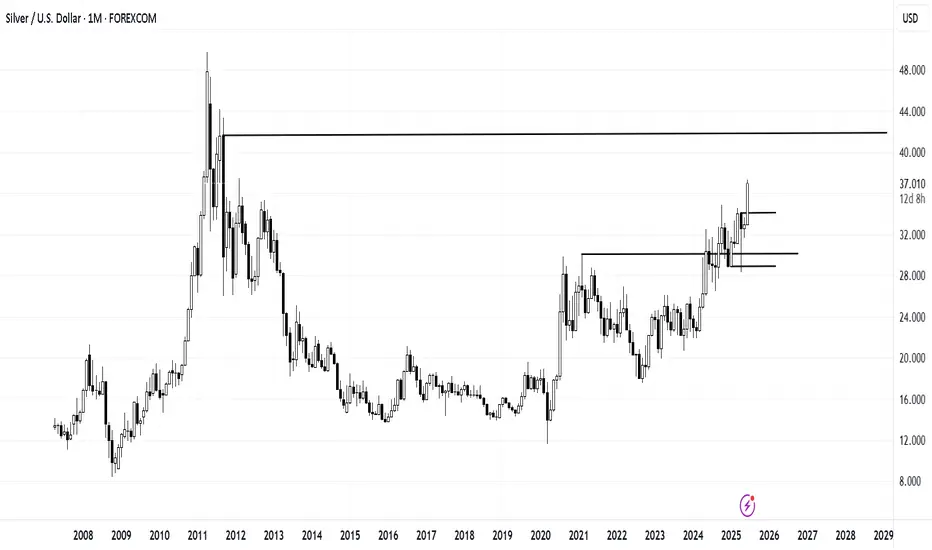
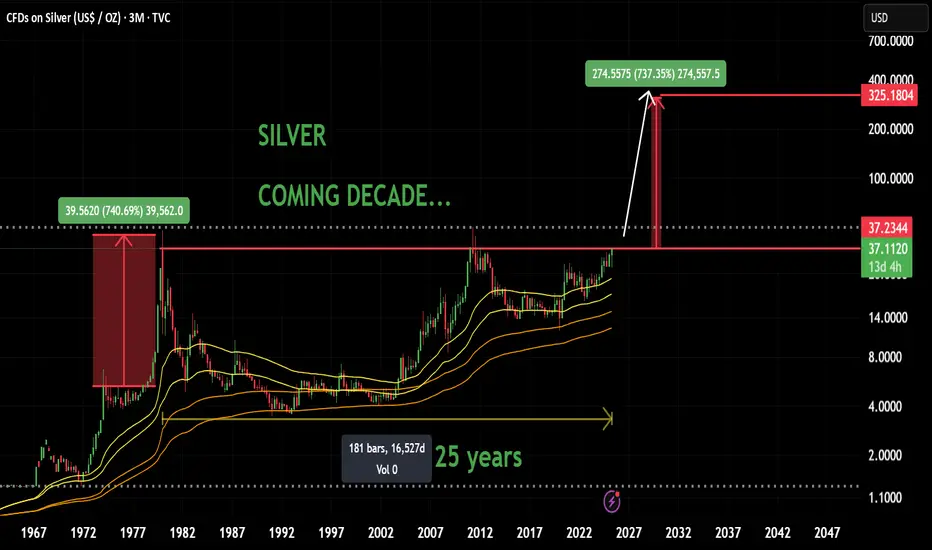
Silver Large Cup & Handle The image is a chart showing the price of silver (CFDs on Silver / USD per ounce) over time, from 2013 through 2025, with future projections. The chart suggests a bullish outlook for silver, possibly forecasting a rise to ~$41 based on historical patterns.

SILVER- LONG( positional and investments)TVC:SILVER 25 years of consolidation with cup handle formation on quarterly chart setup will predict that next 5 to 10 years may be good upward movements for silver.
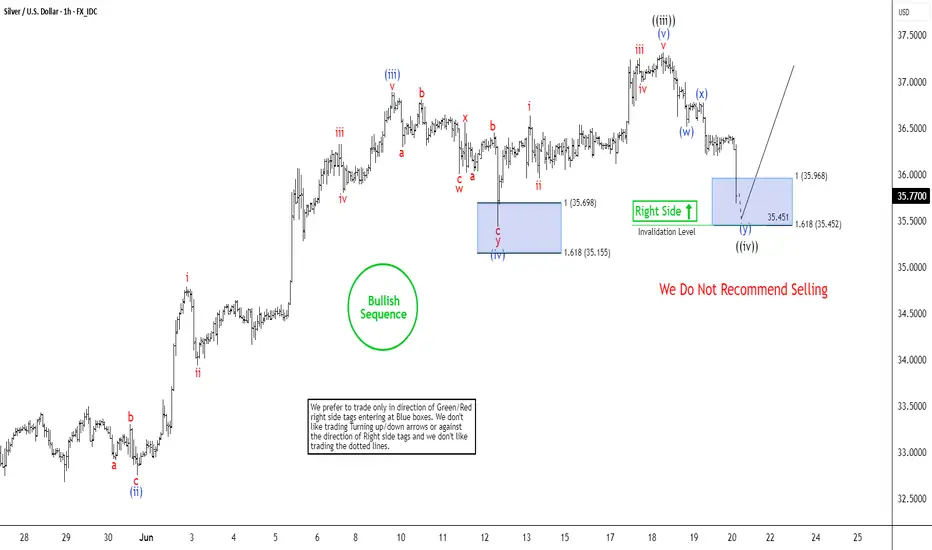
Silver (XAGUSD) Nears Key Support ZoneSilver (XAGUSD) has surged to a new 13-year high, decisively confirming the bullish trend in the precious metal. The ongoing rally, which began from the May 15, 2025 low, is unfolding as an impulsive Elliott Wave structure, characterized by strong upward momentum. From the May 15 low, wave 1 peaked
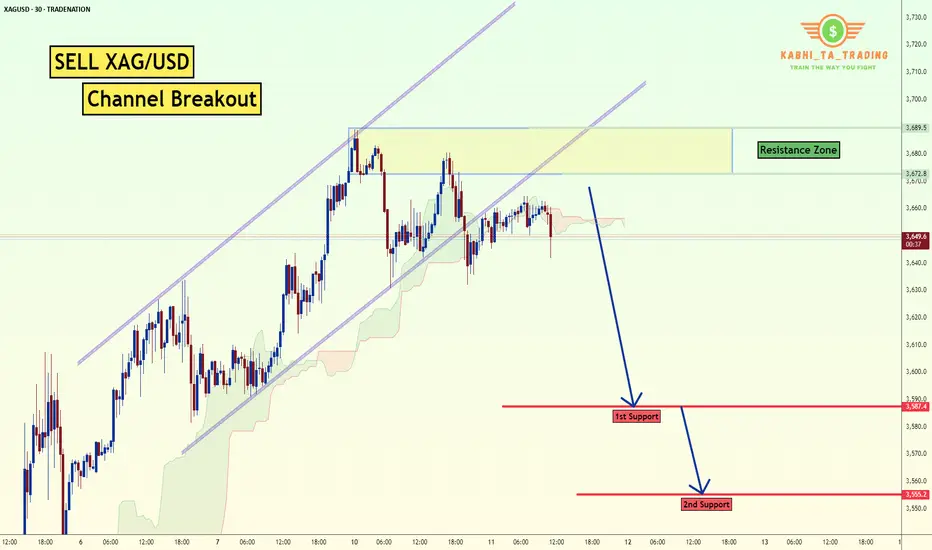
XAG/USD - Channel Breakout (11.06.2025) The XAG/USD Pair on the M30 timeframe presents a Potential Selling Opportunity due to a recent Formation of a CHannel Breakout Pattern. This suggests a shift in momentum towards the downside in the coming hours.
Possible Short Trade:
Entry: Consider Entering A Short Position around Trendline O
See all ideas
Displays a symbol's price movements over previous years to identify recurring trends.