S&P 500 Bullish Rounding Bottom in PlayS&P 500 continues its upward trajectory, supported by a clearly defined rounding bottom formation. Price has successfully broken above the neckline resistance, followed by a technical pullback which was met with a strong buy reaction, validating this zone as a key demand area.
This pullback area no

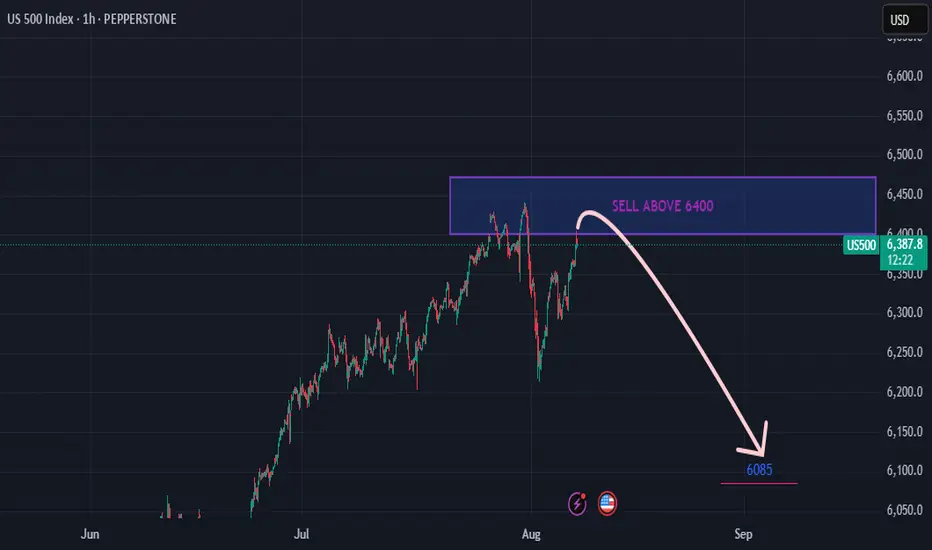
US500 Needs retracementVery good opportunity to sell above 6400... and then i expect it to touch 6085
SP500 reinforcing a bearish short-term trendThe S&P 500 retreated in the final session of July, weighed down by renewed tariff concerns and ongoing uncertainty surrounding the Fed’s next policy move. Despite the late pullback, the index remains positive for the month overall.
From a technical perspective, the index has declined approximately

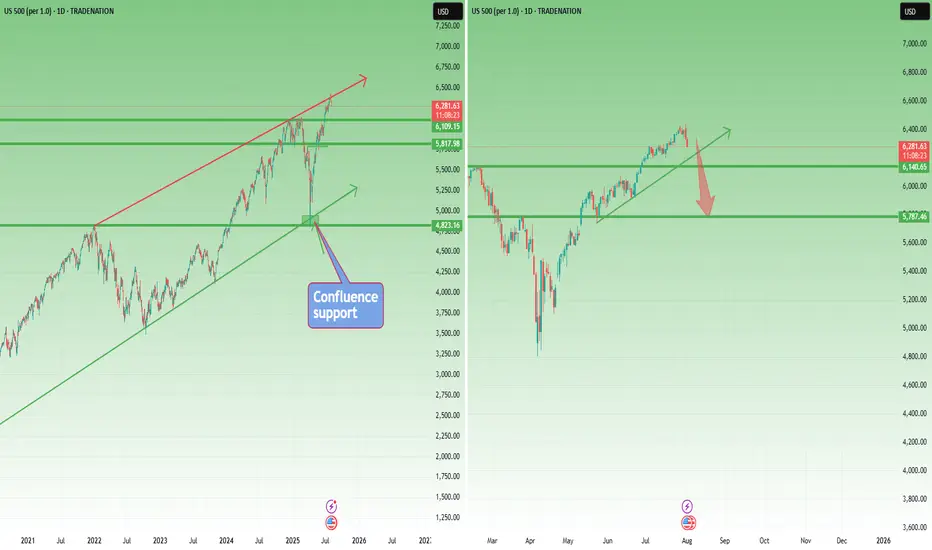
Correction Ahead? SP500 Prints Reversal Signal at Key Resistance📘 This market moves like a textbook chart
SP500 is acting like a perfect case study from a trading manual. Back in early April, the index dipped just below 5,000, right into a confluence support zone ( I had spoken about this at the time ) – formed by the long-term ascending trendline and the 202
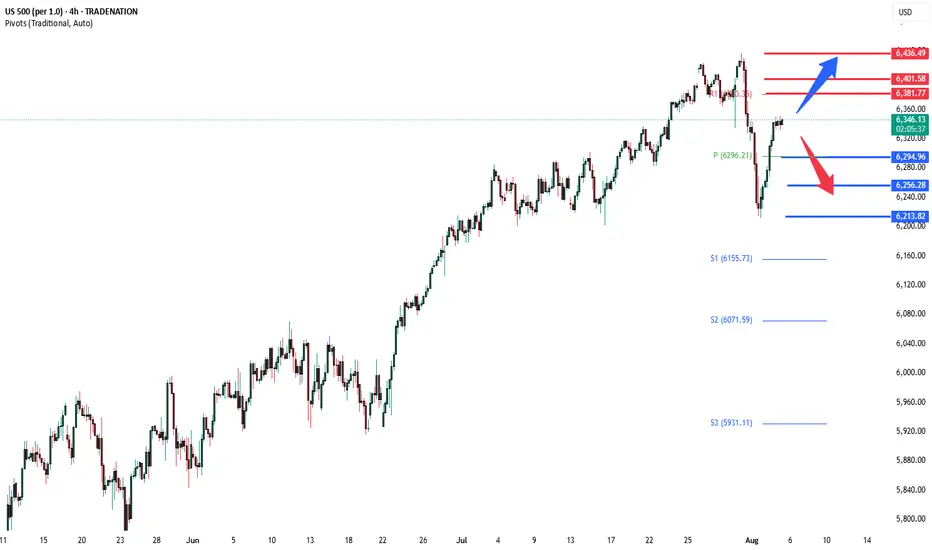
US500 Bearish Idea: Waiting for Structure Break ConfirmationWatching the SPX US500 right now 📈 — it’s rallied hard with strong momentum and is pushing into a key resistance level ⚠️. Since price is overextended, I’m expecting a pullback towards equilibrium on the current move 🔄. My bias is bearish from this level 🔻, with entry dependent on a break in structu

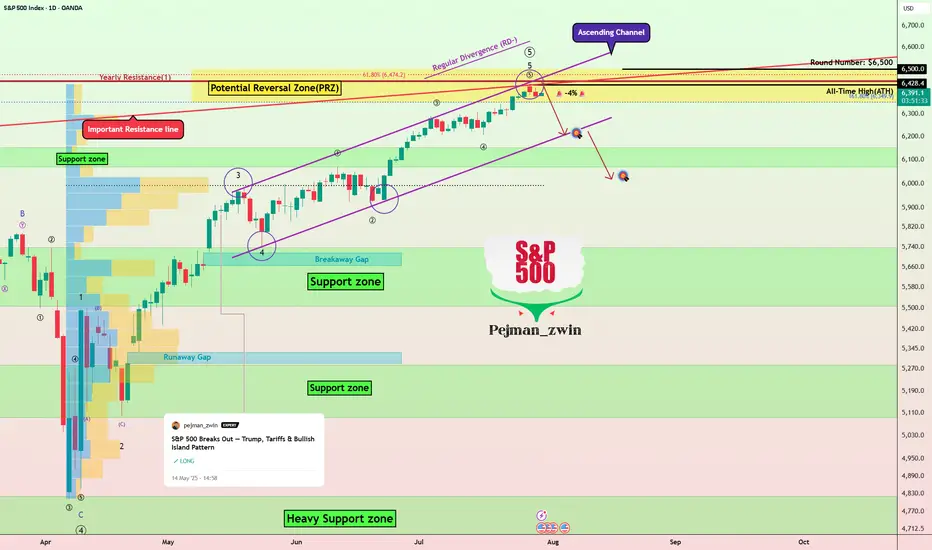
S&P500’s Bullish Island Turns Risky: Elliott Wave Says “Top”The S&P500 Index( SP:SPX ) started to rise and even created a new All-Time High(ATH=$6,428) with the help of the Bullish Long Island Pattern , as I published in my previous idea on May 14, 2025 .
The S&P500 Index is currently moving near the Potential Reversal Zone(PRZ) , upper line of the
S&P 500: Bearish For The Short Term! Sell It!Welcome back to the Weekly Forex Forecast for the week of July 28 - Aug 1st.
In this video, we will analyze the following FX market for the week of Aug 4-8th:
S&P 500 (ES1!)
The S&P 500 rose Friday to fresh highs, following a busy week of tariff updates and earnings. The S&P ended the week with

S&P 500 Obeying Elliott Wave TheoryThis is an update of a previous publication. A Flat occurred for Wave 2(Green) and if Wave 3 is over, we can expect a Zigzag for Wave 4. Zigzags have 3 waves. A confirmation at its current location will trigger a sell for Wave 4(Green).
For more information on the same, go to:

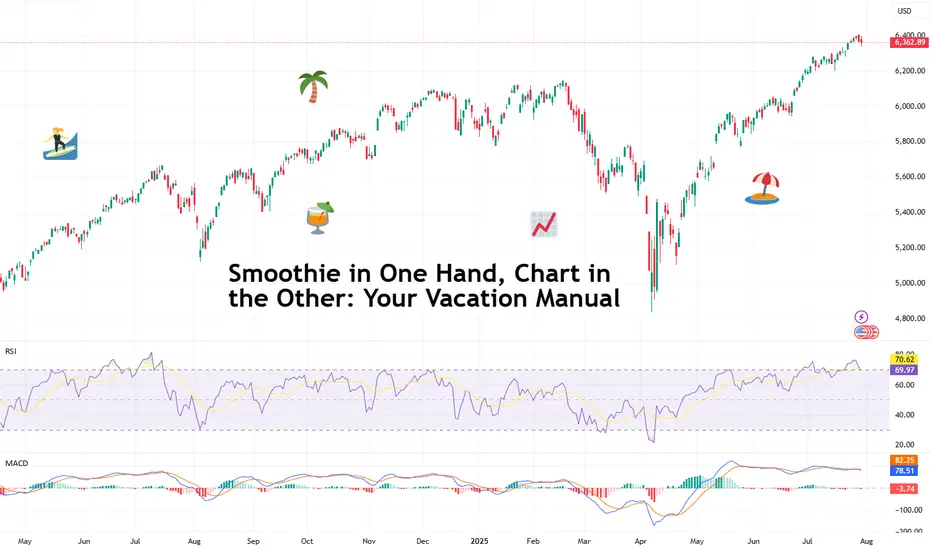
Smoothie in One Hand, Chart in the Other: Your Vacation ManualSome traders bring a beach read. Others bring their TradingView charts.
It’s the heat of the summer and we figured, why not take it easy with a breeze of lightweight lines to pair with your mezcal espresso martini? Let’s talk about how to relax while still watching the markets.
🏄♂️ Market Neve
S&P500 at pivot zone Stocks are climbing higher, with S&P 500 futures up on hopes for interest rate cuts and solid company earnings. The outlook is positive, especially in the finance world—bankers, hedge funds, and asset managers are expected to get higher bonuses this year, reflecting stronger market conditions.
On t
See all ideas
Displays a symbol's price movements over previous years to identify recurring trends.
Frequently Asked Questions
US SPX 500 Cash reached its highest quote on Jul 31, 2025 — 6,436.49 USD. See more data on the US SPX 500 Cash chart.
The lowest ever quote of US SPX 500 Cash is 3,487.79 USD. It was reached on Oct 12, 2022. See more data on the US SPX 500 Cash chart.
US SPX 500 Cash is just a number that lets you track performance of the instruments comprising the index, so you can't invest in it directly. But you can buy US SPX 500 Cash futures or funds or invest in its components.