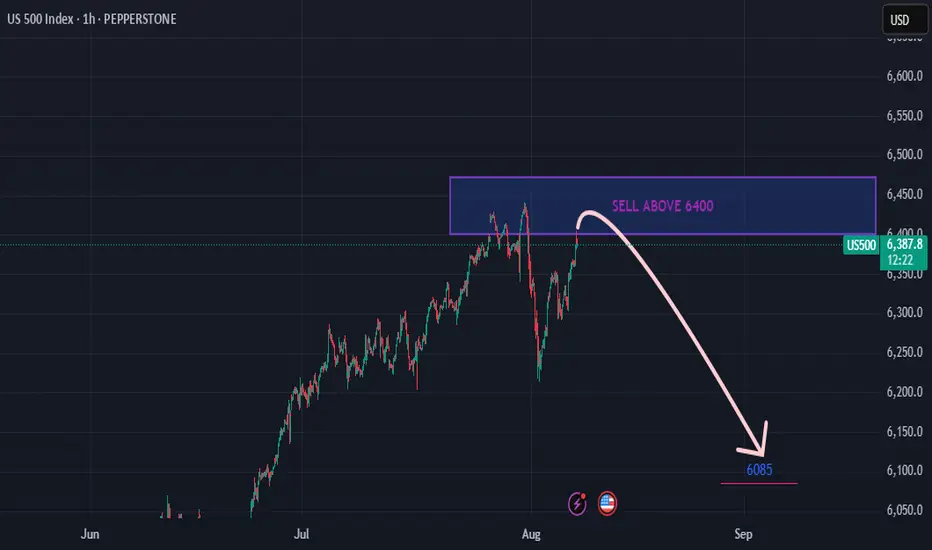
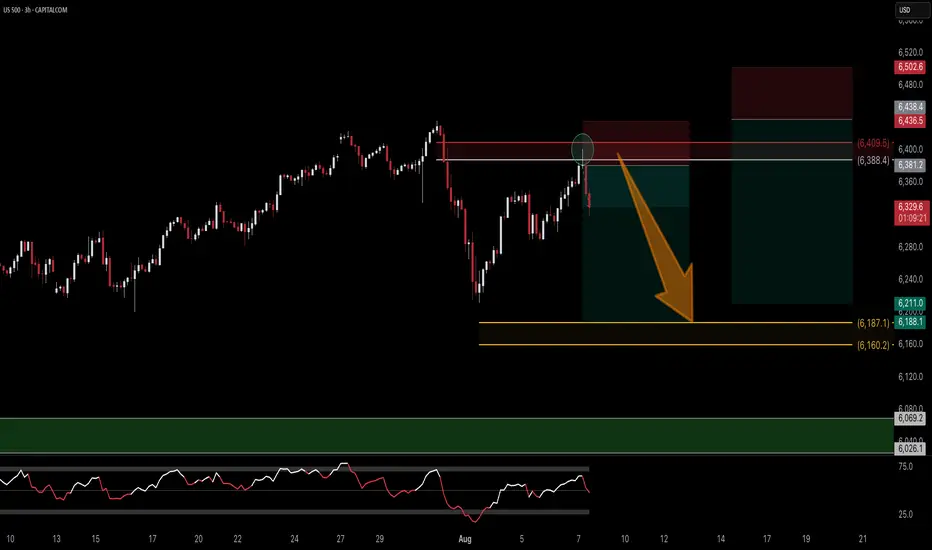
US500 Needs retracementVery good opportunity to sell above 6400... and then i expect it to touch 6085
WHY TRADING IS HARD – EVEN FOR GOD!THE BRUTAL TRUTH ABOUT PERFECT PORTFOLIOS AND IMPERFECT HUMANS
Imagine having access to the same portfolio strategy that made Ray Dalio one of the world's wealthiest hedge fund managers. Picture yourself armed with Nobel Prize-winning research, billion-dollar backtesting results, and a mathematica
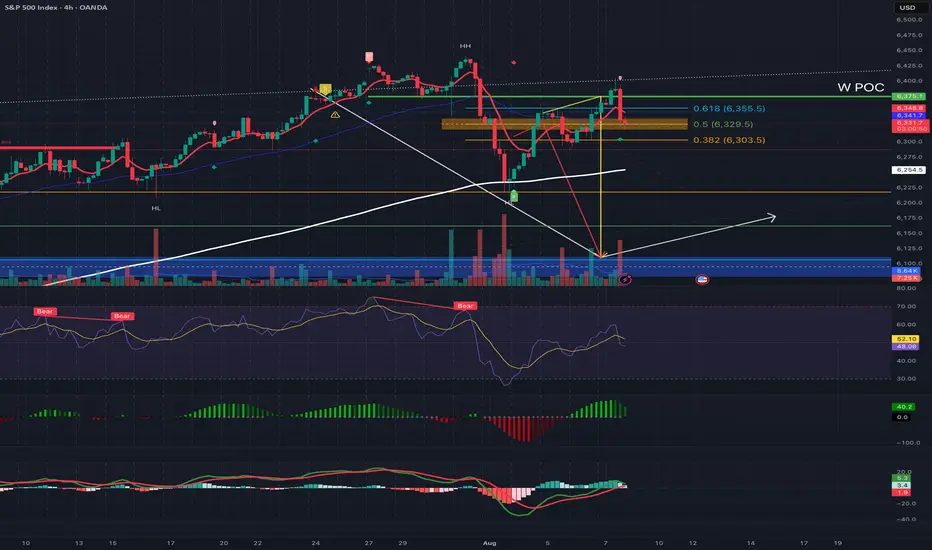
Lower High Complete?OFC earnings provided buys a good level to pick up price but POC at 6375 was key.
The 4HR shows and englufing with LH partially complete.
Bias is Short!
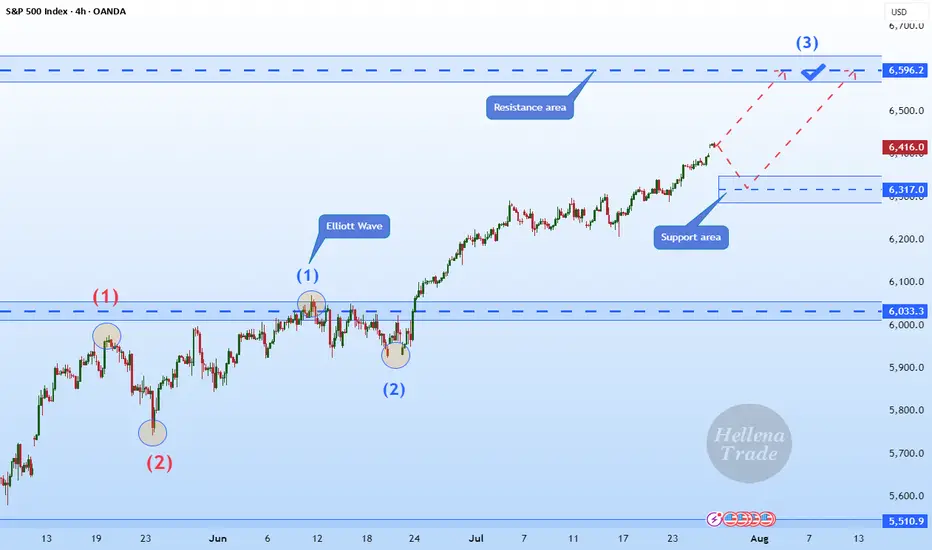
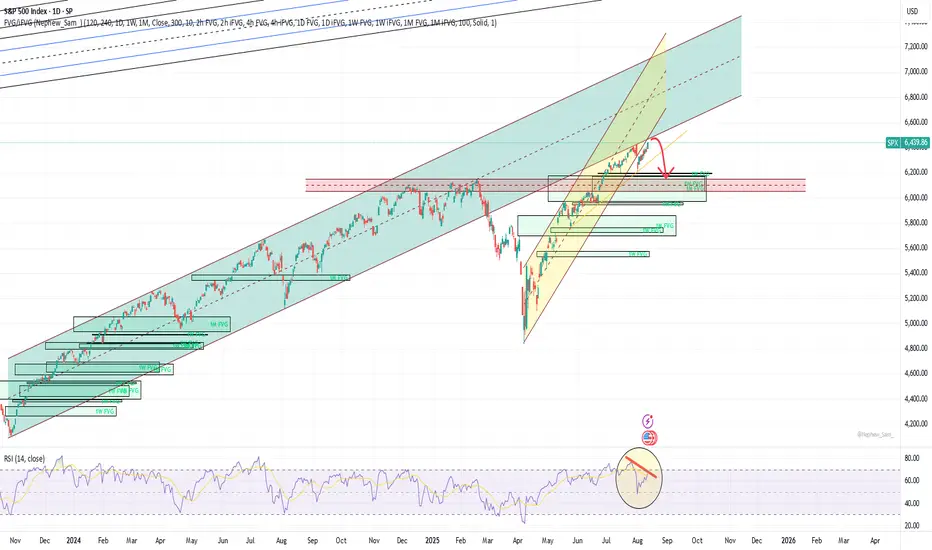
Hellena | SPX500 (4H): LONG to resistance area of 6596 .Dear colleagues, I haven't made a forecast for the SNP500 in a long time and was waiting for a correction, but it seems that a major correction is not yet close, and at the moment the price continues to be in an upward five-wave movement.
Therefore, I believe that we should expect to reach the 6596
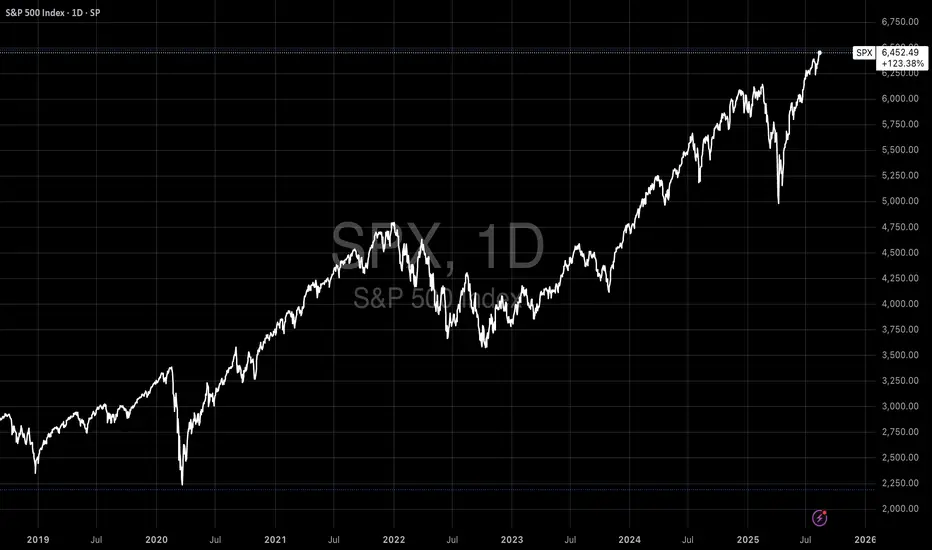
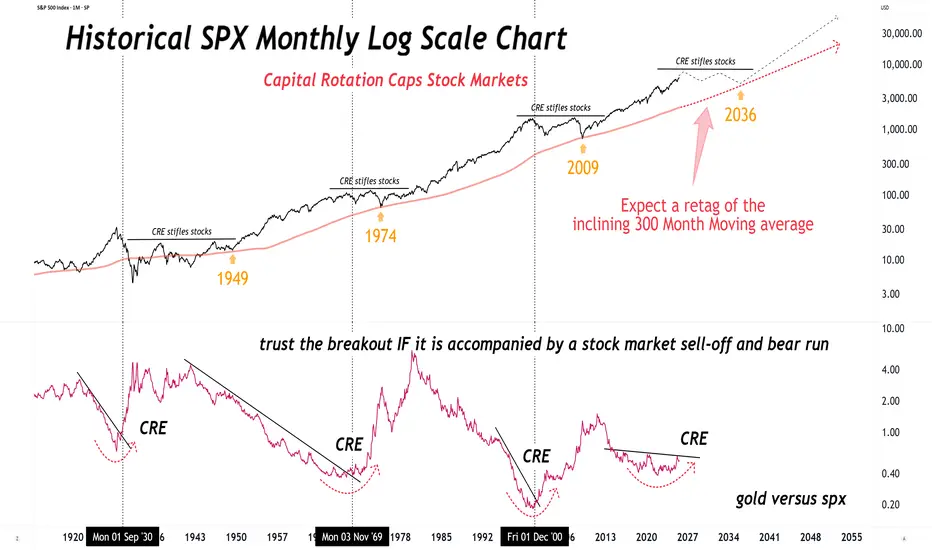
The Stock Market History Says…The Stock Market History Says…
When Capital Rotation Events (CRE) hit, stocks stall & gold outperforms.
Past (1949, 1974, 2009) hints at a retest of the 300-month MA before the next big leg up, maybe around 2036.
Watch GOLD vs SPX for the signal.
Anticipating the market to go down this Thursday ....After my last BAD trade prediction, I just laid low for a little while, was very sick and visited some relatives for a little while. But I am jumping back on the horse, as they say.
I anticipate the market to go down this Thursday when jobless claims are reported.
I expect for whatever the news fo
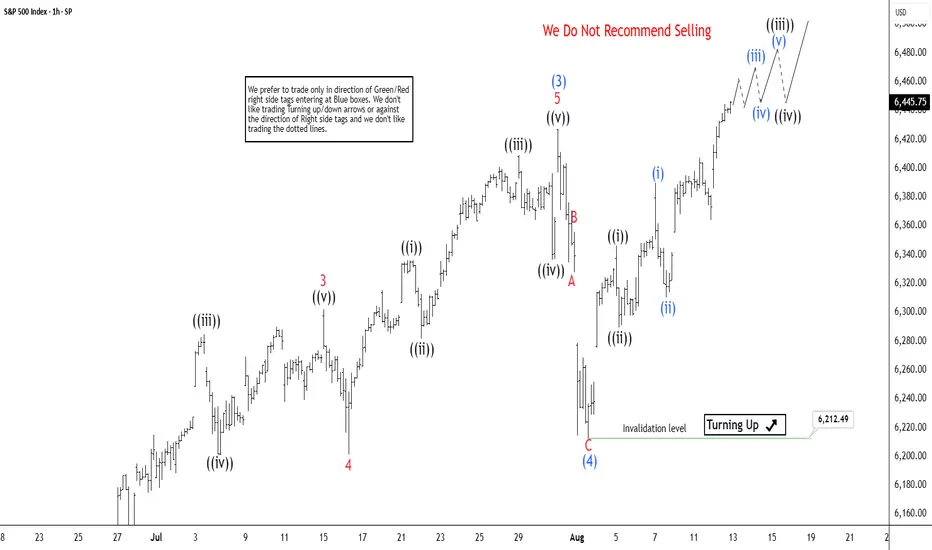
S&P 500 (SPX) Targets 6639 in Final Wave 5The Elliott Wave cycle, initiated at the April 7, 2025 low, is progressing as an impulse structure, driving the Index upward. Wave (1) reached a high of 5267.47, followed by a wave (2) pullback to 4910.42. The Index then surged in wave (3) to 6427.02, as depicted in the one-hour chart. A corrective
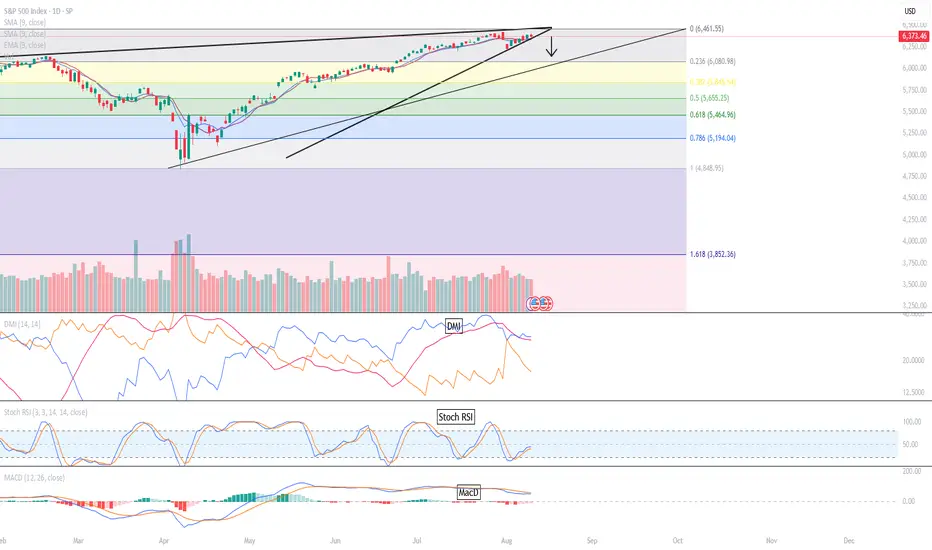
Resistance and divergenceThe price is at the bottom of the old broken channel right now that serves as a resistance. Solid 1d divergence on RSI.
6180 is the minimum target - 1W and 1M FVG start there. Retest of the February ATH at 6150 is probable. A spike to 6100 and below is also possible.
SP500 | Short | 3hrsThis technical analysis is for informational and educational purposes only. It does not constitute financial advice. Remember to always research and consult with a professional before making investment decisions. Good luck! 📈💼🚀
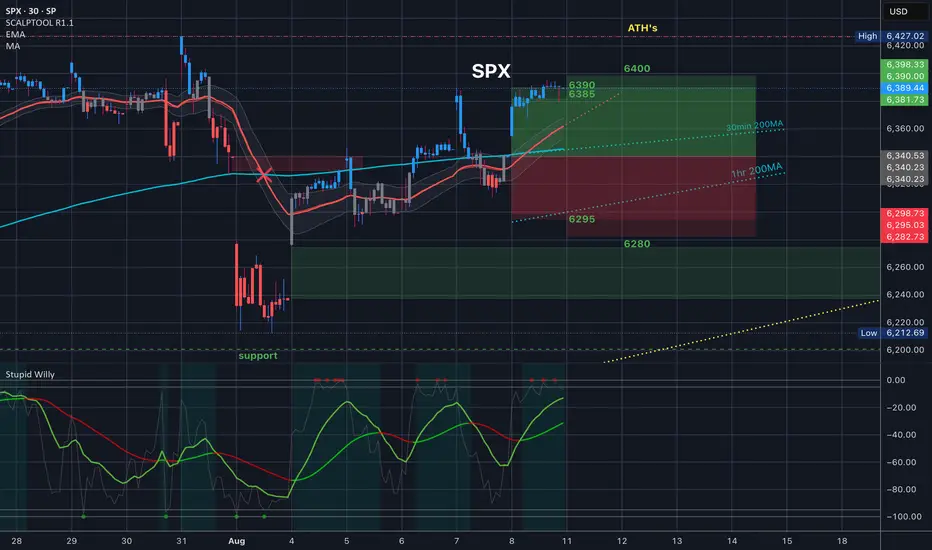
$SPX All Time High’s in view // Last Friday review
Ok, this is a review of last Friday’s price action from the setup provided in the member video. We opened with a gap up and a rally to the top of the implied move. We actually took it to the top of the 30 day average volatility, which rounded out was 6390
So 6390/6400 bear call spreads paid.
See all ideas
Displays a symbol's price movements over previous years to identify recurring trends.
Frequently Asked Questions
US 500 (SPI) / US Dollar reached its highest quote on Jul 31, 2025 — 6,468.38 USD. See more data on the US 500 (SPI) / US Dollar chart.
The lowest ever quote of US 500 (SPI) / US Dollar is 2,172.13 USD. It was reached on Mar 23, 2020. See more data on the US 500 (SPI) / US Dollar chart.
US 500 (SPI) / US Dollar is just a number that lets you track performance of the instruments comprising the index, so you can't invest in it directly. But you can buy US 500 (SPI) / US Dollar futures or funds or invest in its components.