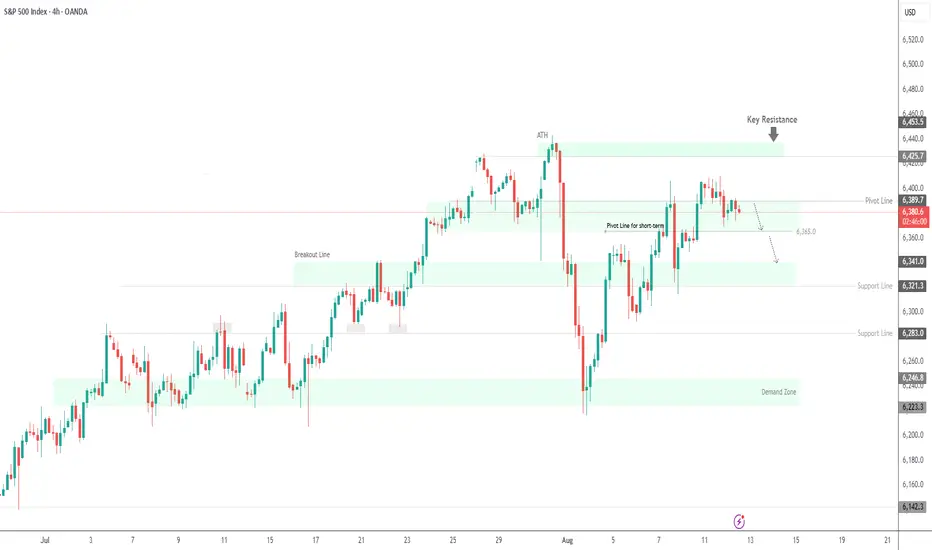
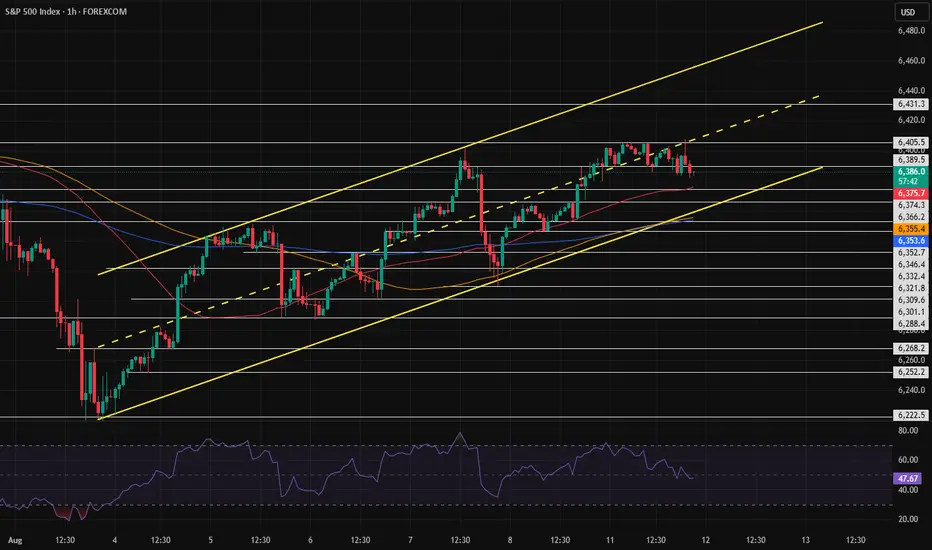
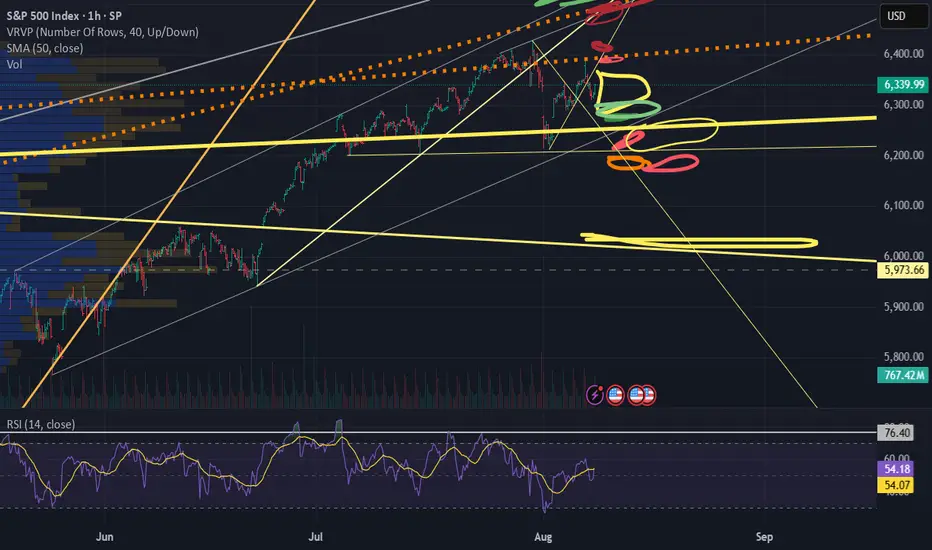
SPX500 | Consolidation at Record Highs – Key Pivot 6468S&P 500 at Record Highs on September Rate Cut Hopes
Futures tracking the S&P 500 and Nasdaq held at record highs on Wednesday, supported by growing expectations that the Federal Reserve could resume its monetary policy easing cycle next month.
Technical Outlook:
The price is expected to consolidate between 6468 and 6425 until a breakout occurs.
Stability below 6468 would favor a bearish move toward 6425.
A 1H close above 6468 could push the price higher toward 6528.
Pivot: 6468
Support: 6437, 6425, 6389
Resistance: 6490, 6500, 6528
SPIUSD trade ideas
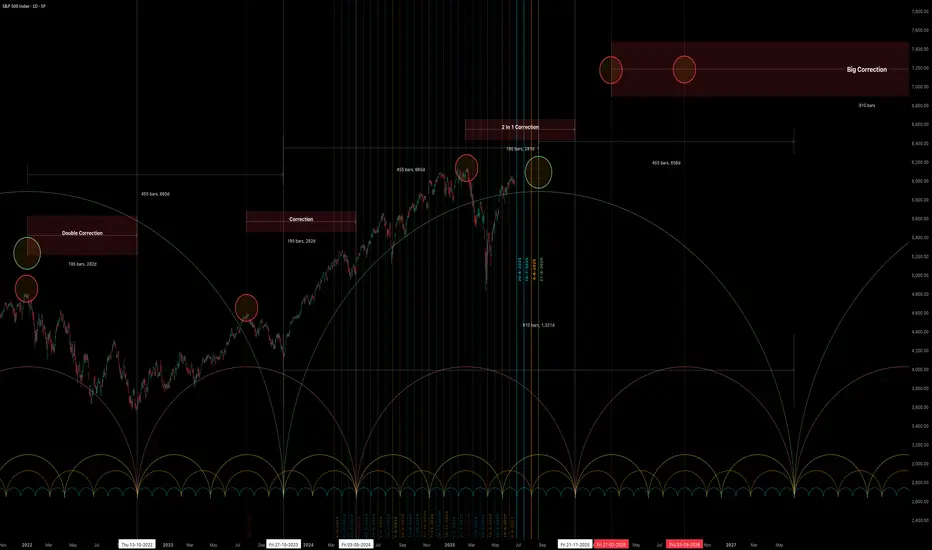
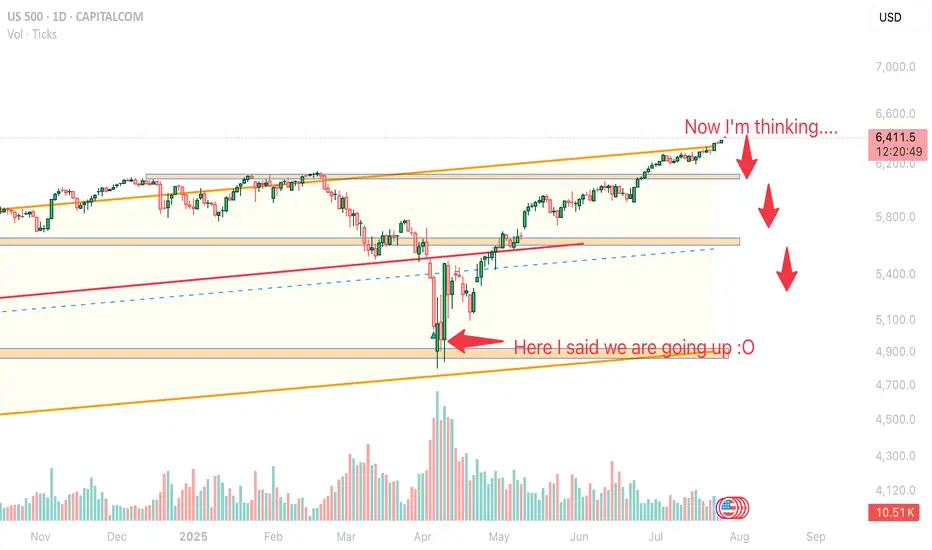
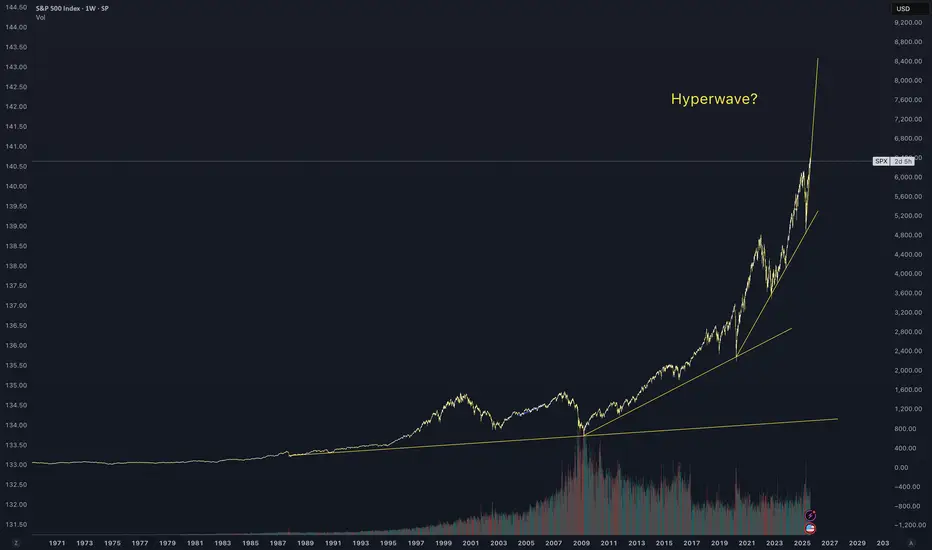
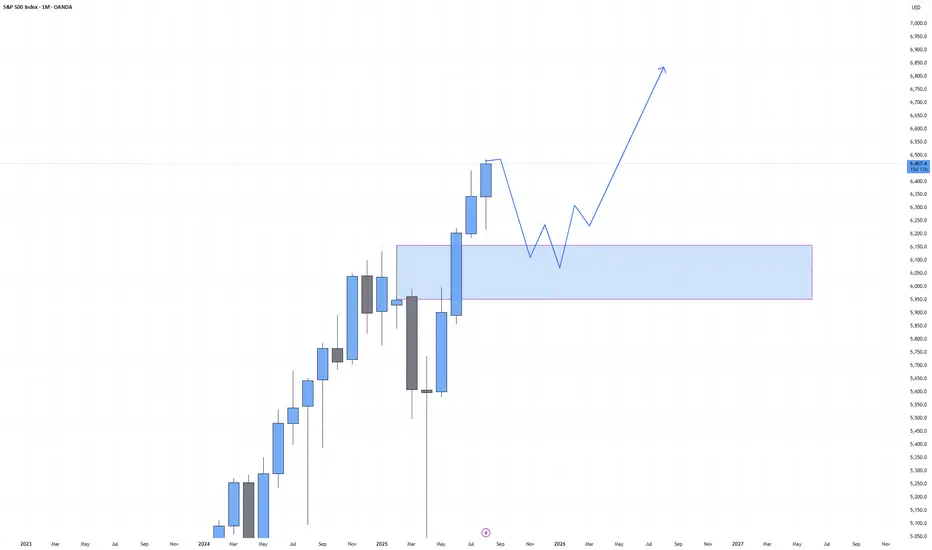
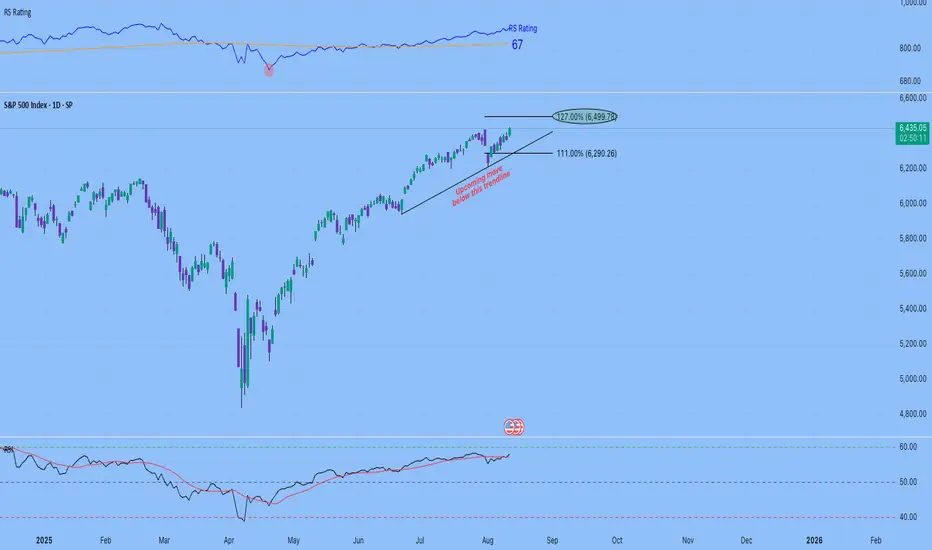
Big CorrectionThe S&P index.
The chart shows the potential end of the final rally from the 2009 low.
Currently, with this rally from the recent 4,800 low, we are still in a correction period that will end in late October (highs and lows are irrelevant), & We have a date coming up in August so let's see what happens there.
After this period, we will have a rally combined with uncertainty and unjustified speculative movements (bubble) that could take us to the final peak, which I expect in 2026.
This remains a possibility, but don't base your trades on it. However, caution is often good.
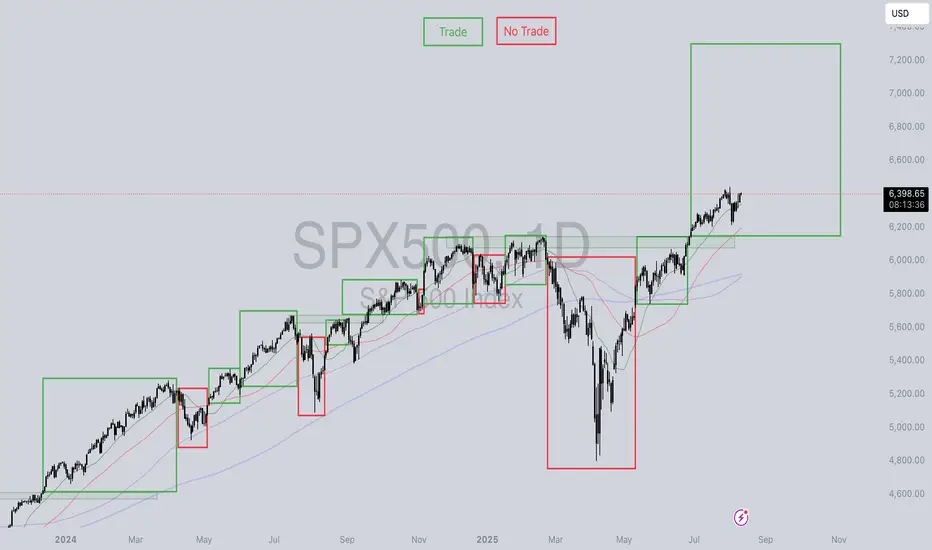
Are you loosing money?....... Please Read.I’ve shared this chart previously, but I’ve just given it another update.........
This is pure simplicity. If the price is above the moving averages, it's a good opportunity to trade. Did it close under any moving average? Step back and wait.
Stop trying to call tops or bottoms. Stop day trading crypto and FX. Stop attempting to master Elliot wave theory or ICT.
Concentrate on a single market, US stocks, align with the trend, and capitalise on a tested advantage. STOCKS WANT TO GO UP!!!!!!
Another advantage- Utilise a tax-advantaged account (IRA, ISA), try spread betting, or leverage an ETP (like 5xSPY).
Keep it simple, follow the trend. It does'nt have to be complicated.
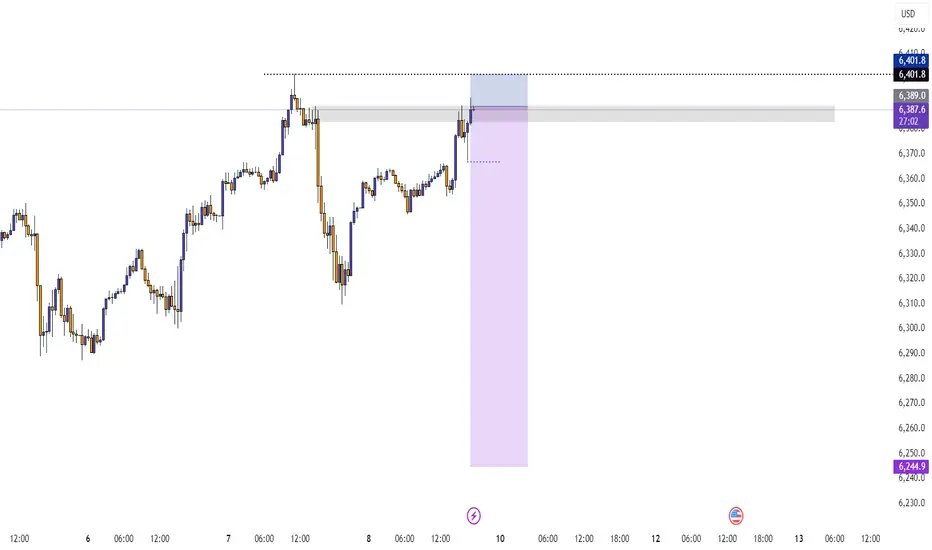
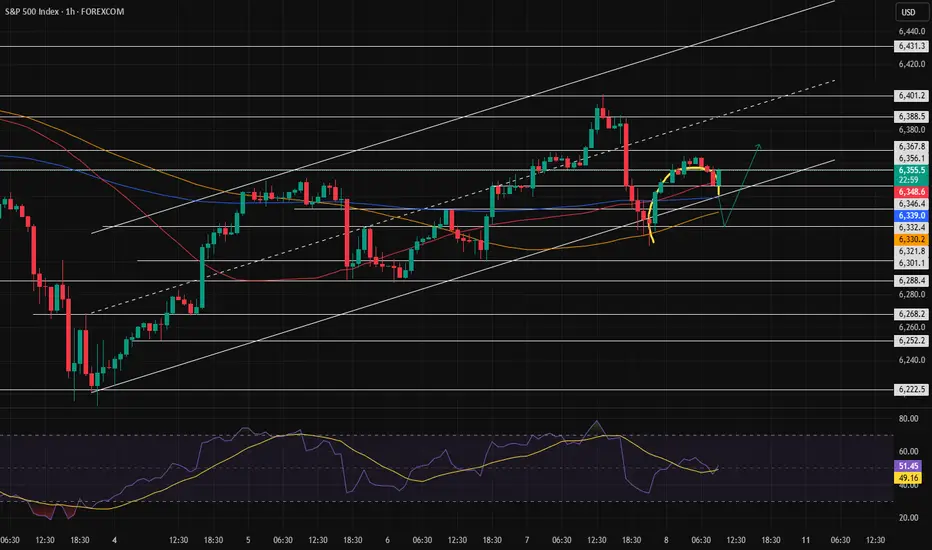
SPX500 | CPI Day Volatility – Key Level at 6389SPX500 Overview
Today’s market is expected to be highly volatile with the release of U.S. CPI data.
The forecast is 2.8%, higher than the previous reading, indicating inflation remains elevated. A result above 2.8% would likely support a bearish trend for indices, while a figure below expectations could trigger bullish momentum.
Technical Outlook:
As long as the price trades below 6389, the downside targets are 6365, then 6341, and 6321.
A 1H close above 6389 would shift momentum bullish toward 6425.
Support: 6365, 6341, 6321
Resistance: 6404, 6425, 6438
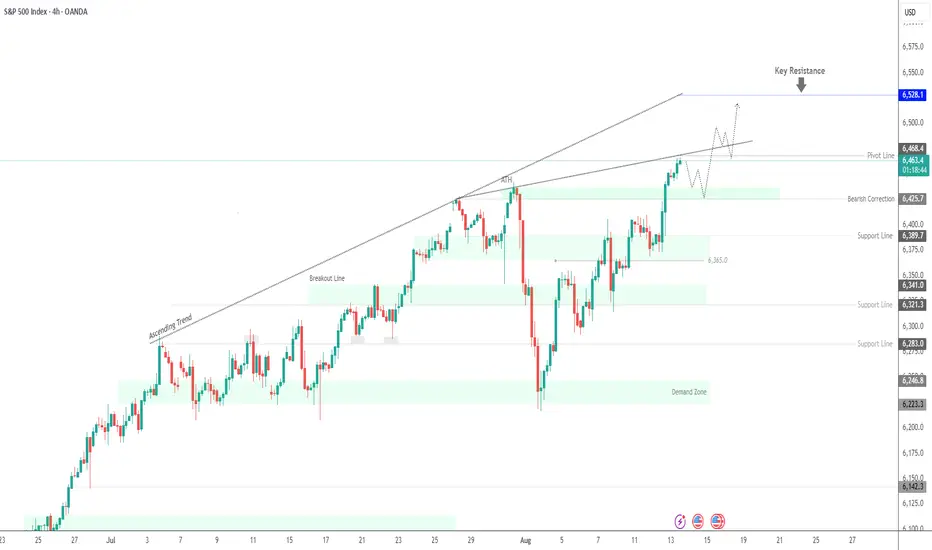
SPX500 | Holding Above Key Pivot – Path to New ATH or Pullback?SPX500 Overview
S&P 500 futures are up 0.2% early Monday, with traders preparing for a week filled with key economic events. While tariff concerns remain in the background, market focus is firmly on upcoming U.S. inflation and retail sales data.
Technical Outlook:
The price has stabilized above 6389, indicating the potential for the bullish trend to extend toward 6425. A breakout above this level could lead to a new all-time high.
Conversely, a 1H close below 6389 would signal a potential bearish move toward 6365.
Resistance: 6413, 6425, 6442
Support: 6365, 6341, 6321
US500 SP500 Sell the news- ShortHello fellow traders, what do you think? Am I predicting FUTURE? This is my early entry, cautious, but holding steady, checking from time to time but general rule- what went up will eventually fall. The price is just a Wave of coincidance and events, trade carefully! Protect capital! don't copy my idea it's an idea NOT A TRADING ADVISE
S&P500 INDEX (US500): Bullish Rally Continues
S&P500 is going to continue rising at least to 6500 level.
A confirmed break of structure BoS on a daily indicates
a clear dominance of the buyers.
With the absence of high impact US news today, the market will
remain strongly bullish.
❤️Please, support my work with like, thank you!❤️
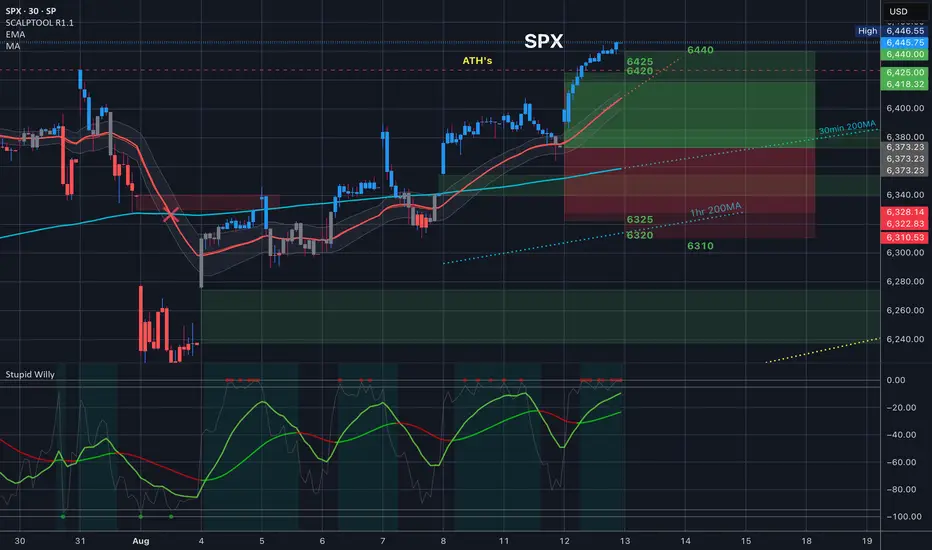
$SPX Analysis, Key Levels & Targets
What a crazy day. We had a CPI in premarket today then we kept up and we took it past all-time highs to the top of the implied move to the top of the implied move on the next day so we close just above 6440.
VIX got absolutely crushed, down 9% today destroying options betting on downside.
I do believe that tomorrow we will be trading around 6440, maybe even between 6420 and 644. Thursday we have PPI and because we're in an in between day tomorrow I think we might be a little bit more flat also look at how high up that 35 EMA is within the training range
(HIT GRAB THIS CHART - UNDER THE CHART NEXT TO THE 🚀)
US500: Rebound Setup After Sharp Pullback – Key Support HoldingUS500 has experienced a strong corrective move after an extended bullish run but is now showing signs of stabilizing near a key support area. This zone aligns with both technical retracement levels and the market's reaction to fundamental shifts—particularly the dovish repricing of the Fed following weak US jobs data.
Technical Analysis (4H Chart)
Pattern: After a strong uptrend, price faced a steep correction, forming a potential short-term reversal setup.
Current Level: 6,235, holding above the 6,217 support zone.
Key Support Levels:
6,217 (immediate support; key defense zone for bulls).
6,171 (38.2% retracement, secondary support if deeper pullback occurs).
Resistance Levels:
6,272 (23.6% retracement and initial resistance).
6,360 (upper resistance zone and retest of recent breakdown).
6,429/6,436 (recent high and target if bullish momentum resumes).
Projection: A rebound from current levels could push US500 back toward 6,360–6,430 if support holds.
Fundamental Analysis
Bias: Neutral-to-bullish as macro drivers favor a recovery from pullback.
Key Fundamentals:
Fed Policy: Weak US jobs (+73K) and downward revisions have solidified rate cut expectations (~75% probability in September), boosting equity sentiment.
Inflation: Market awaits US CPI; softer data would further support equities.
Tariffs: While Trump’s tariffs create a medium-term risk for earnings, immediate Fed easing bets outweigh these concerns.
Risk Sentiment: Global risk remains supported by lower yields and optimism about Fed easing.
Risks:
Hot US CPI could reverse cut expectations, pressuring equities.
Geopolitical risks or tariff escalation could trigger renewed selling.
Key Events:
US CPI and PPI.
Fed speeches and rate expectations.
Earnings reports from key US companies.
Leader/Lagger Dynamics
US500 is a leader, driving global risk sentiment and influencing risk-sensitive assets like AUD/USD, NZD/USD, and JPY crosses.
Summary: Bias and Watchpoints
US500 is neutral-to-bullish, stabilizing at key support (6,217) after a sharp correction. Fed cut expectations and risk-on sentiment support the upside scenario, targeting 6,360–6,430 if US CPI aligns with softer inflation. However, a hot CPI print could invalidate this rebound and trigger another leg lower.

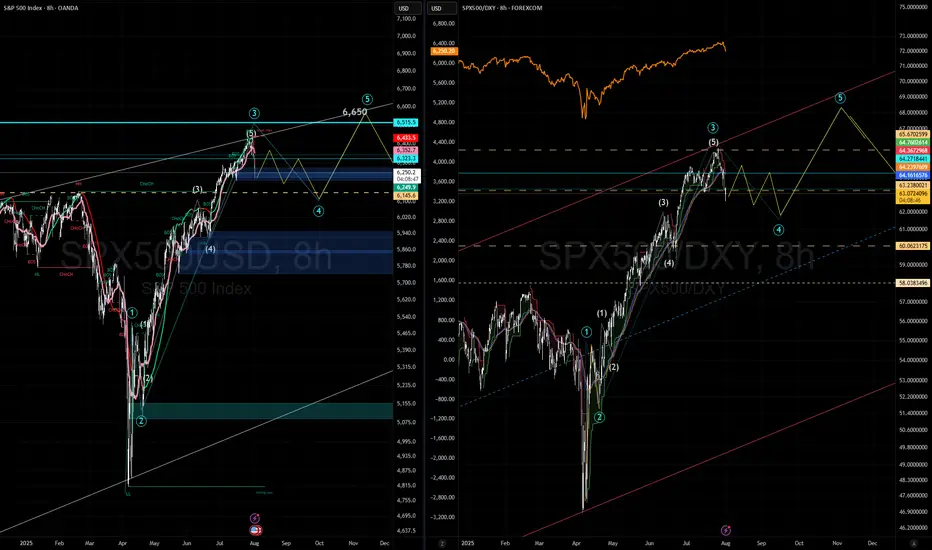
SPX range bound unit September expirationExpect sideways wave 4 to last 4 weeks, volatility, (small positions: sell up, buy dips or do NPOTHING and hold. Basically these types of Wave-4 are where traders loose money from Wave-3.
Warning: SPX500 May Have Peaked—Here’s What the Charts SayThe S&P 500 (SPX500) may have reached its peak. In this video, I reveal the technical evidence pointing to a potential reversal—including monthly bearish divergence, daily and weekly reversal candles, and confirmation from key indicators.
This isn’t just noise—these signals align across timeframes, suggesting a shift in momentum that could lead to significant downside. I’ll walk you through the charts, explain the implications for traders and investors, and highlight critical support levels to watch.
Thank you for watching and have a great trading week. Cheers!!

S&P 500 Daily Chart Analysis For Week of August 8, 2025Technical Analysis and Outlook:
During the trading activity of the previous week, the S&P 500 Index exhibited a predominantly bullish trend and is poised to retest the completed Outer Index Rally target of 6420, as outlined in last week’s Daily Chart Analysis. The primary objective now is to target subsequent levels, specifically the next Outer Index Rally target of 6620 and beyond.
It is crucial to recognize that the current price movement may initiate a substantial pullback from the present price action, either before or following the attainment of the Outer Index Rally peak at 6420.

Trend weakness or consolidation?This index is in an uptrend both in the larger cycle and in the smaller cycle, but in the lower cycle, a trend weakness is observed. If the price can confirm above 6.405, it can continue its upward trend.
SP500 SP500 could come back to the blue area and then we expect the market will push a new high in the near future.
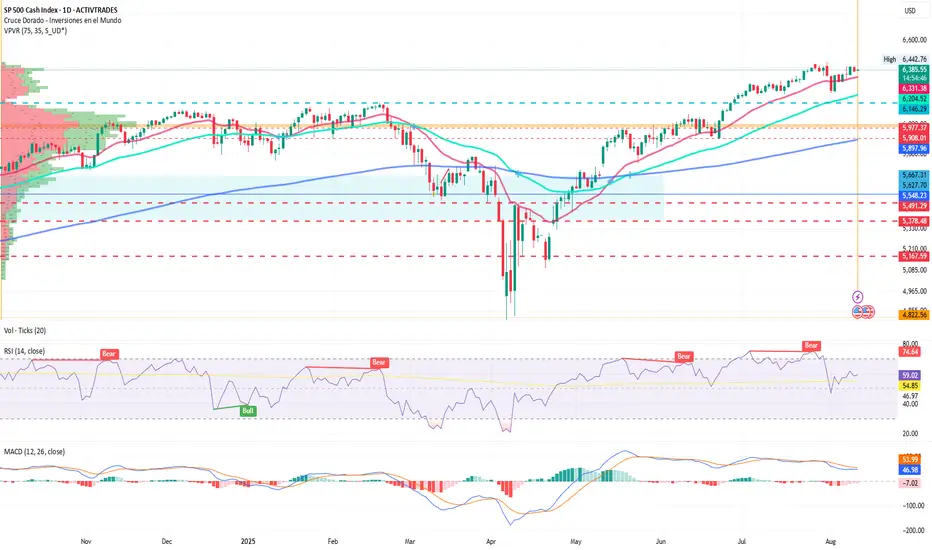
Quants vs Humans: Wall Street’s Cold War
By Ion Jauregui – Analyst at ActivTrades
A silent battle is being fought on Wall Street between humans and machines. Quants — algorithmic traders who operate by following trends — are showing a level of optimism not seen since January 2020, according to Deutsche Bank AG (Ticker AT:DBK.GE). In contrast, “flesh and blood” managers have reduced their equity exposure to modestly underweight levels, pressured by the risk of new Trump tariffs, weaker-than-expected economic growth, and corporate earnings that remain unconvincing.
The S&P 500 has risen nearly 30% since April, bringing systematic long positions to their highest level in four years. Goldman Sachs (Ticker AT:GS.US) reports that Commodity Trading Advisors (CTAs) now control about $50 billion in U.S. equities, placing them in the 92nd percentile of historical exposure. Such an extreme positioning has not been seen since periods preceding major market moves.
Deutsche Bank was among the first to warn about this divergence between quantitative and discretionary trading: while trend-following models keep adding positions, manually managed portfolios are prioritizing capital protection. Goldman Sachs, for its part, offers the clearest risk assessment: aggressive accumulation by CTAs leaves the market highly exposed to feedback-driven moves. And UBS Group AG (Ticker AT:UBSG.CH) warns that if the S&P 500 falls just 4.5% to 6,100 points, these systems could trigger massive selling, creating a domino effect that would accelerate the correction.
The backdrop adds more tension: the VIX volatility index remains around 15 points, its lowest level since February. This apparent calm acts like a stretched rubber band ready to snap. In the event of a sharp pullback, discretionary managers might step in to “buy the dip” and prevent a deeper sell-off, yet the sense that the market is approaching a top is becoming increasingly tangible.
Technical Analysis – S&P 500
The index maintains an underlying bullish structure, but with overbought signals on daily and weekly charts. Currently, the RSI shows mild overbought conditions at 58.7%, while the MACD indicates a bearish divergence and a red histogram with low volume — a sign of possible price consolidation.
• Key resistance: 6,442.76 points, the recent all-time high and a psychological ceiling that could halt further gains if quantitative momentum fades.
• Intermediate support: 6,204 points, where short-term moving averages converge with previous consolidation areas.
• Critical support: 6,060 points, identified by the Point of Control (POC) as the threshold for triggering massive algorithmic selling; a break below this level could open the door to declines toward 5,950 or 5,908 points.
As long as 6,060 holds, the primary trend still favors the bulls. However, the high concentration of systematic long positions suggests that any correction could be swift and violent, forcing traders to react quickly.
*******************************************************************************************
The information provided does not constitute investment research. The material has not been prepared in accordance with the legal requirements designed to promote the independence of investment research and such should be considered a marketing communication.
All information has been prepared by ActivTrades ("AT"). The information does not contain a record of AT's prices, or an offer of or solicitation for a transaction in any financial instrument. No representation or warranty is given as to the accuracy or completeness of this information.
Any material provided does not have regard to the specific investment objective and financial situation of any person who may receive it. Past performance and forecasting are not a synonym of a reliable indicator of future performance. AT provides an execution-only service. Consequently, any person acting on the information provided does so at their own risk. Political risk is unpredictable. Central bank actions can vary. Platform tools do not guarantee success.
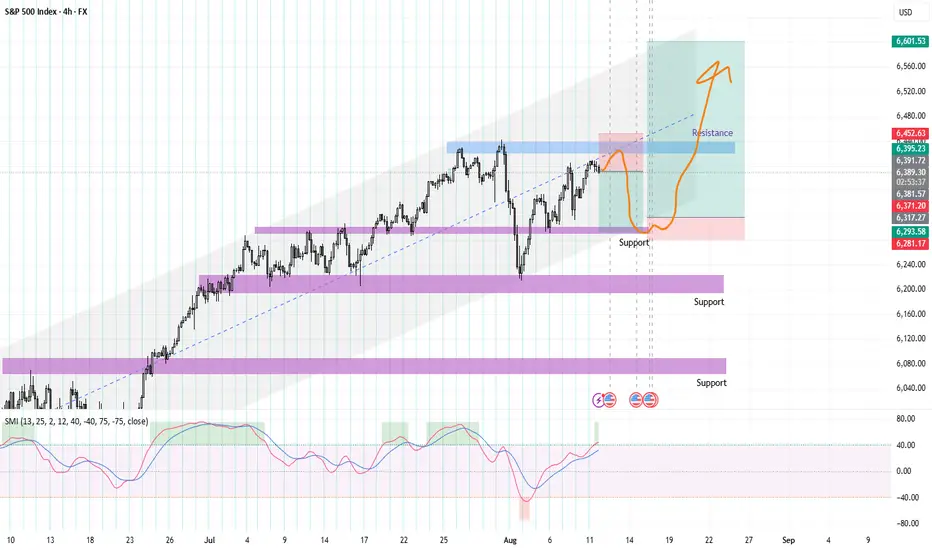
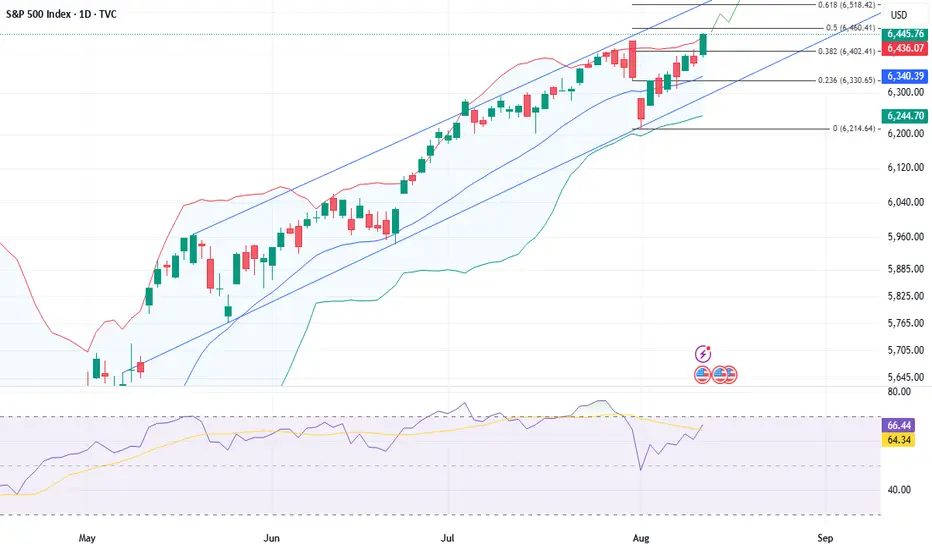
SPX500
Based on the provided 4-hour chart of the S&P 500 Index (SPX500), here is a brief summary and outlook.
The SPX500 has been in a clear uptrend, as indicated by the trend channel and a series of higher highs and higher lows. The price is currently facing resistance near the 6,450 level, where a recent high was made before a pullback. The chart also highlights several key support zones, with the most immediate one being around the 6,290 level.
The chart illustrates a potential scenario where the price consolidates or pulls back from the current resistance. The orange arrow depicts a possible movement where the price could retrace towards the immediate support level around 6,290 before finding buyers. From this support, the expectation is for the uptrend to resume, with the price aiming to break through the resistance at 6,450. A successful breakout would open the path towards the upper boundary of the trend channel, with a target set around 6,600.
The key expectation is a continuation of the overall bullish trend after a potential short-term dip. Traders should look for the price to hold above the support at 6,290 for a long entry opportunity. A break below this support would be a bearish signal, but as long as the price stays within the trend channel, the overall bias remains bullish. The final target for this move is projected to be around the 6,600 level, which aligns with the trend channel's upper boundary.
Activation of the rounded pattern? Or a trend reversal?In the previous analysis, we mentioned that the price was at a decision point — and it made its decision, managing to move up slightly before returning to the bottom of the channel.
Now, at the end of the channel, a pattern has formed. We need to see whether it gets activated or turns out to be a fake.
If the pattern fails (turns out fake), the bullish trend could continue more strongly.
Upside move at EndThis upside ongoing move likely to end near 6500,
on touch it may decline to break Black trendline.
As per #ElliottWave internal 2-4 connected trendline
will break and it will confirm completion of internal wave5.
S&P 500 All Round Analysis - S&P 500 Created HistoryTechnical Summary: The primary trend of the S&P 500 is bullish. On the 4H chart, the prices are trending bullish in an ascending channel formation. Prices are rising after reflecting from the lower trendline of the channel on Monday. The prices rose to an all-time high of 6445.75 after accepting support at the fib extension 0.382 at 6402.4. If prices successfully breach the immediate resistance at fib extension 0.50 at 6460.5, then it may rise to the far resistance zone between 6500 - 6518 (fib extension 0.618).
Descriptive Analysis: The S&P 500 notched a record close on Tuesday after consumer prices rose by less than expected in July, increasing the probability of the Federal Reserve cutting interest rates next month.
Data-related Projection: In the absence of key data releases today, market focus has shifted to tomorrow’s U.S. PPI report. U.S. stock markets are being underpinned by bullish sentiment, which is fueled by expectations of future rate cuts, possibly in the September Fed meeting.
Indicator Interpretation: The prices are trending higher in the buying zone of the technical indicators - above the middle Bollinger band and the mid-50 level of RSI.
ALTERNATIVE SCENARIO
Technical Confirmation: If the index fails to rise above fib extension 0.50 at 6460.5 and sustain, but falls below fib extension 0.382 at 6402.4, then further bearishness can be expected.
Facts & Figures: The S&P 500 is a very well-known index of large-cap US stocks, covering about 75% of all publicly traded US stocks. It comprises 505 stocks of 500 companies selected by a committee using 8 criteria.
Daily Pivot: 6420 (CMP: 6445.75, which is trading above the pivot level while writing the report).
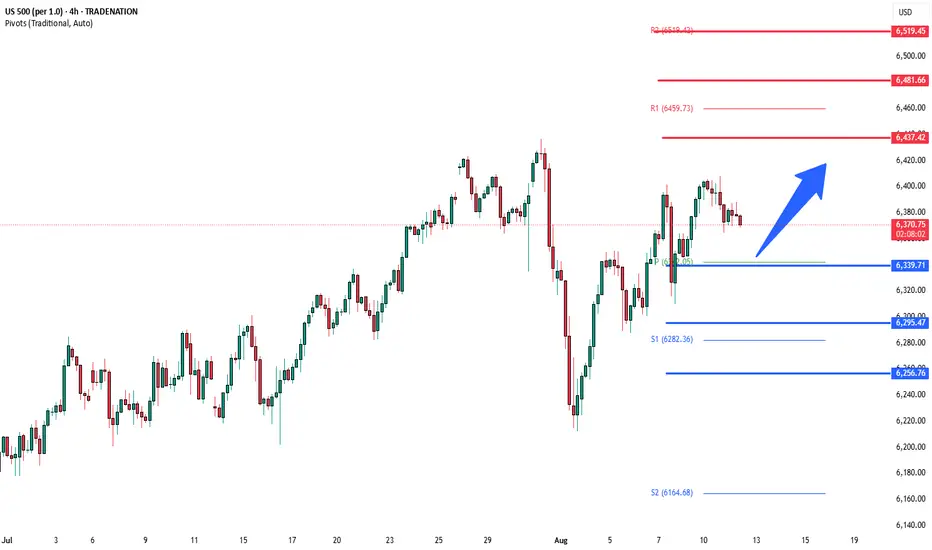
S&P500 awaits US CPI data capped by 6437US equities were little changed Monday. Nvidia (-0.35%) and AMD (-0.28%) slipped after agreeing to pay 15% of Chinese AI chip sales revenue to the US government in exchange for export licenses — a deal Trump confirmed, adding he may allow a scaled-down Blackwell chip to be sold in China. The Philadelphia Semiconductor Index fell -0.13%, cushioned by Intel (+3.51%) after its CEO met with Trump. The Mag-7 (-0.09%) saw slight outperformance, led by Tesla (+2.85%).
Trump extended the US–China tariff truce by 90 days to November 10, keeping additional tariffs at 30%. China matched the extension.
The Fed chair search now includes vice chairs Bowman and Jefferson, plus Dallas Fed President Logan. Trump appointed EJ Antoni (Heritage Foundation) to lead the Bureau of Labor Statistics.
Markets await today’s US CPI, which could influence Fed rate-cut bets, while gold traders look for clarity after Trump said gold imports won’t be tariffed.
Key Support and Resistance Levels
Resistance Level 1: 6437
Resistance Level 2: 6480
Resistance Level 3: 6520
Support Level 1: 6340
Support Level 2: 6295
Support Level 3: 6256
This communication is for informational purposes only and should not be viewed as any form of recommendation as to a particular course of action or as investment advice. It is not intended as an offer or solicitation for the purchase or sale of any financial instrument or as an official confirmation of any transaction. Opinions, estimates and assumptions expressed herein are made as of the date of this communication and are subject to change without notice. This communication has been prepared based upon information, including market prices, data and other information, believed to be reliable; however, Trade Nation does not warrant its completeness or accuracy. All market prices and market data contained in or attached to this communication are indicative and subject to change without notice.