SPIUSD trade ideas
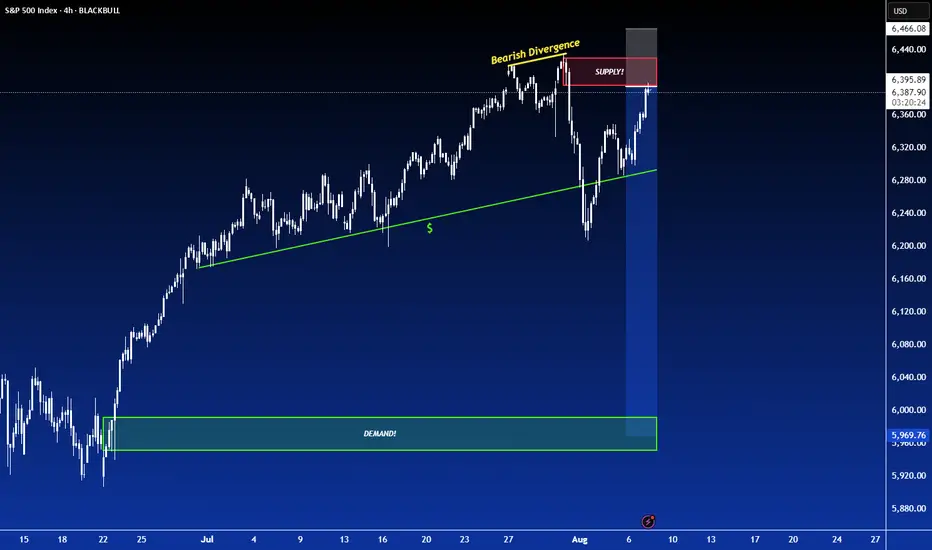
S&P 500 Ascending Triangle Breakout SetupThe S&P 500 index is consolidating within an ascending triangle pattern, with strong support along the rising trendline. Price action suggests bullish momentum building towards a potential breakout above the resistance zone, targeting higher levels if confirmed
1. Previous Trend:
Strong bullish rally before the current consolidation phase, indicating momentum is on the buyers’ side.
2. Pattern Formation:
Horizontal resistance around 6,418–6,420 (marked by the grey line).
Rising support trendline connecting higher lows, showing buying pressure is increasing.
3. Volume (Not Shown Here):
If volume is decreasing inside the triangle and expected to spike on breakout, it supports a bullish case.
4. Breakout Expectation:
A confirmed close above 6,420 with strong volume could trigger a rally towards the next target zone of 6,470–6,500.
The arrow drawn on your chart aligns with this possible breakout scenario.
5. Invalidation Zone:
If price breaks below the rising trendline (~6,360), the bullish pattern would be invalidated, potentially pushing price back to 6,300–6,280.

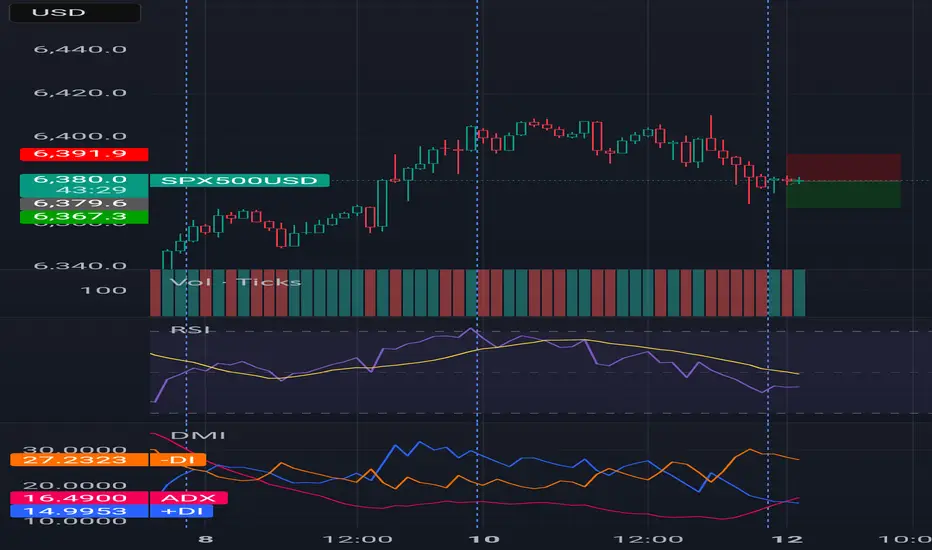
Spx500 usdGetting some pips before spx going up again,
This is my bet in the meanwhile,
Dyor always.
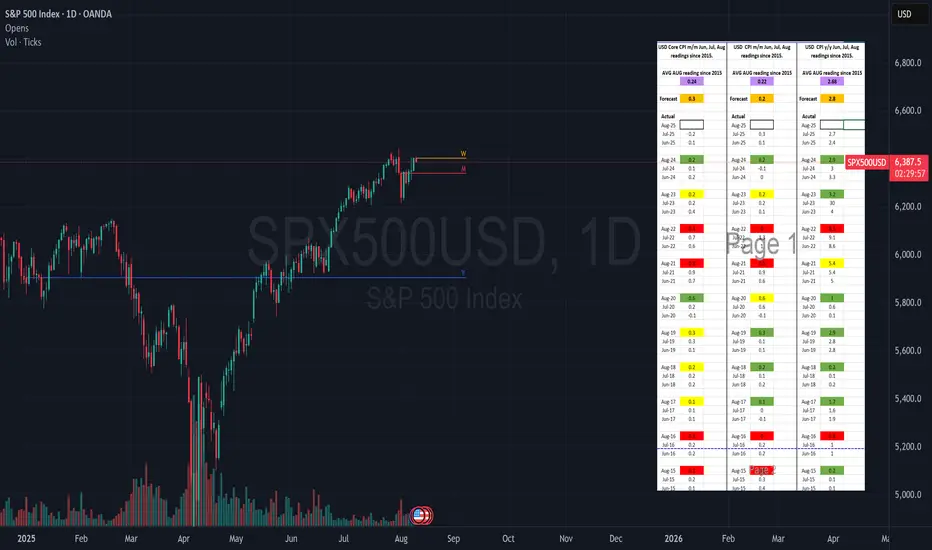
USD cpi yr/yr forecast of 2.8 looks too high for tomorrowBased upon the price of oil, the recent trend of CPI readings, and the 10 yr avg of 2.68 USD cpi reading may come in as a market miss tomorrow. The expected 2.8 looks to high relative to the trend of readings and the price of oil. It might be fair to expect a range of 2.4 to 2.7.
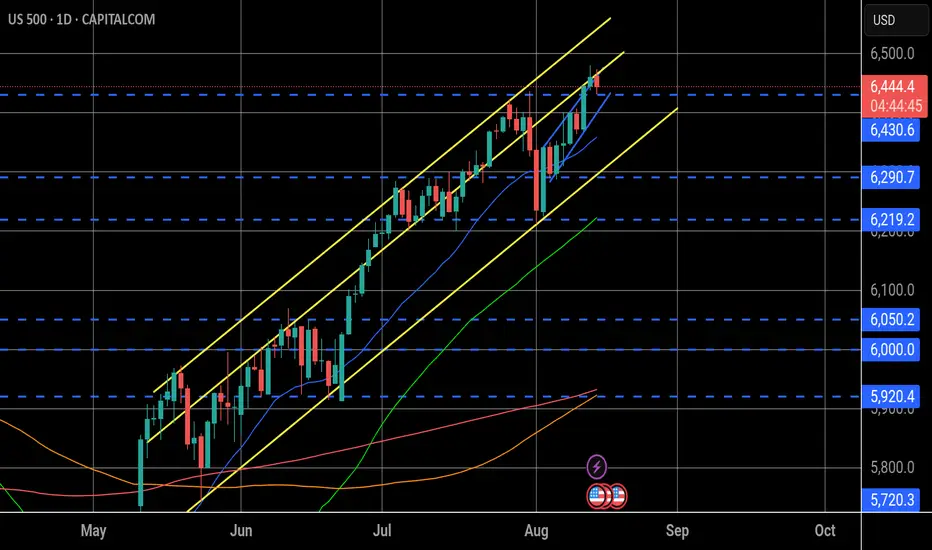
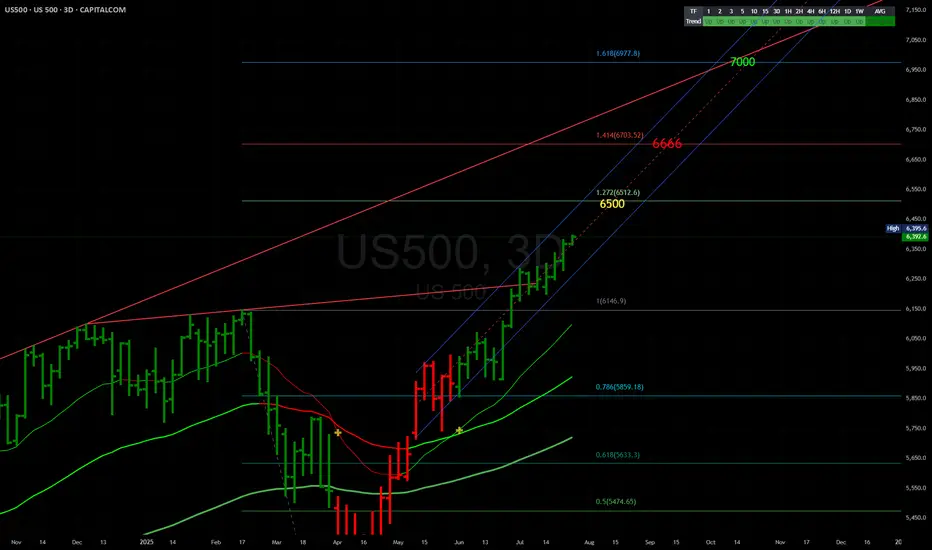
SPX 6500 6666 7000Hello Traders,
Here is my latest Fib, Channel, Trendline, and Price Targets SPX Timeline. Lets see how this plays out.
S&PS&P 500 waiting for overbought of 240 min. If it pass 6427 net resistance is about 6615. at this resistance there is a chance to drop 1 oversold of timeframe 240 min. however, it is on a long up trend, which the mid period target is 6952 (2-4 months). however, during this period it may go direcly to 6952 or down for 1 oversold of timeframe day or 240 min is OK. Note that the very importance supporting line,which should not be lower is at 4841. if it not fall below this point. S&P still on the uptrend.
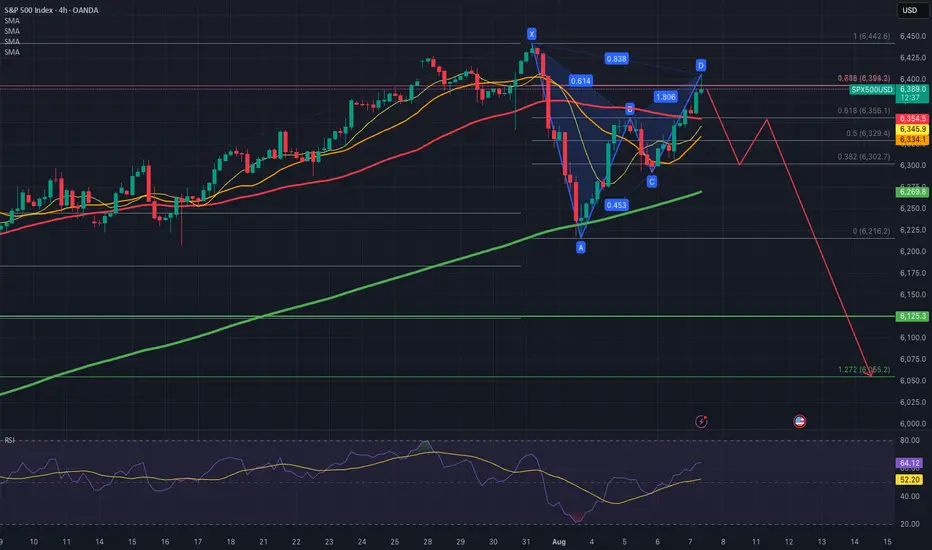
SPX500 - what's next?Further to my previous idea on SPX.
SPX respected the Resistance at FR 161.8 at 6400.
Price went down and reverted form SMA200 (4H)
Now price has completed the Perfect Gartley Pattern and reached point D.
If (against fundamentals) price reverts down from there and breaks down through SMA50 (4h), I will consider it as Bearish Validation and I will expect correction movement, which cen go down to ca 6000.
Just my humble opinion
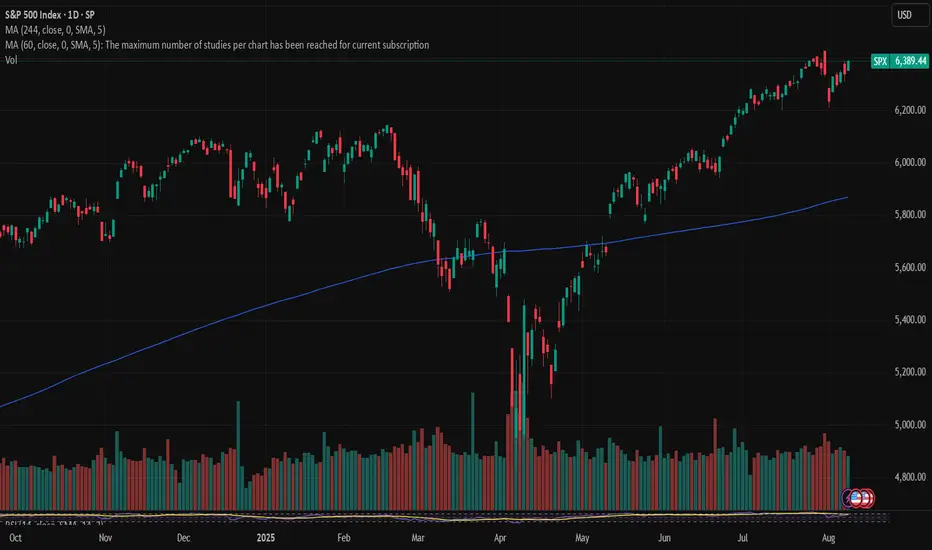
SPX: awaits inflation data Regardless of concerns regarding the future effects of implemented trade tariffs by the U.S. Administration, the positive sentiment continued to hold on the U.S. equity markets during the previous week. The S&P 500 closed the week at the level of 6.389, surging by 2,4% for the week. The index is slowly nearing its all time highest level, achieved on 31st July, at the level of 6.426.
Friday's rally was for one more time led by tech companies. Shares of Apple gained around 13% for the week, after the company announced its significant investments of $600B within the next four years in the U.S. Analysts are calling this deal as “appease” to the U.S. President, who on several occasions expressed his wish that IPhones are made in the U.S.A. As per comments made by Tim Cook, CEO of Apple, “the final assembly that you focus on, that will be elsewhere for a while”, meaning that the production of IPhones is still not going to be done in the U.S.A. Nevertheless, markets reacted positively to Cook's meeting with the U.S. President, especially taking into account a heavy burden of tariffs, which the U.S. President announced to be 100% on chip imports.
Considering current market sensitivity on inflation data, the week ahead might bring some major testing for the U.S. equity markets, as July inflation data are scheduled for a release. Analysts are noting that any surprises in the inflation figures might imply a correction in the value of US companies, especially after a significant surge during the last four months.
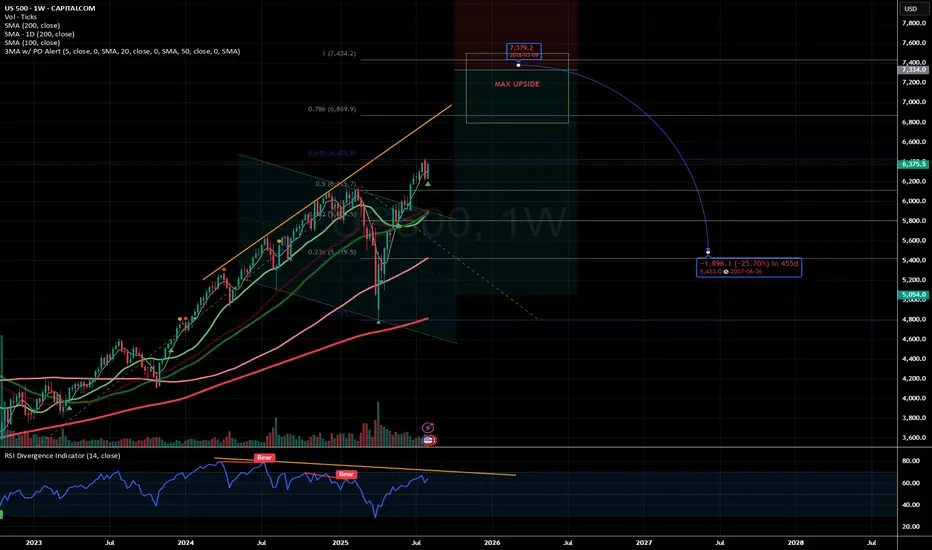
US500 one last leg upI do not want to sound 100% like David Hunter, but I recon max upside in this cycle is approaching and will be somewhere between 7000$ to 7400$, from there a correction of at least 25% is very likely
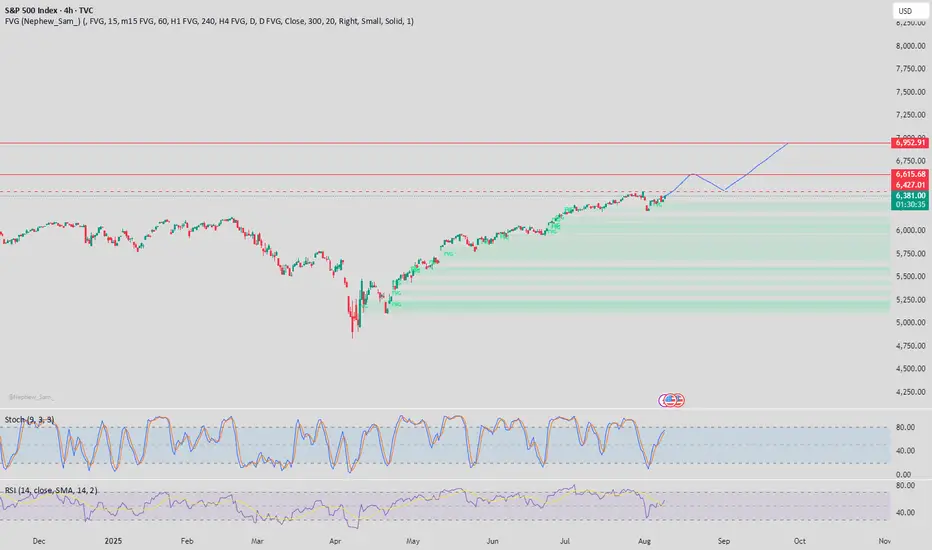
S&P 500: Bearish For The Short Term! Sell It!Welcome back to the Weekly Forex Forecast for the week of July 28 - Aug 1st.
In this video, we will analyze the following FX market for the week of Aug 4-8th:
S&P 500 (ES1!)
The S&P 500 rose Friday to fresh highs, following a busy week of tariff updates and earnings. The S&P ended the week with its fifth straight record close, its longest such streak in over a year.
No reason to consider selling. Wait for pullbacks to FVGs for high probability buys.
FOMC and NFP loom. Be careful to avoid new entries during news times.
Enjoy!
May profits be upon you.
Leave any questions or comments in the comment section.
I appreciate any feedback from my viewers!
Like and/or subscribe if you want more accurate analysis.
Thank you so much!
Disclaimer:
I do not provide personal investment advice and I am not a qualified licensed investment advisor.
All information found here, including any ideas, opinions, views, predictions, forecasts, commentaries, suggestions, expressed or implied herein, are for informational, entertainment or educational purposes only and should not be construed as personal investment advice. While the information provided is believed to be accurate, it may include errors or inaccuracies.
I will not and cannot be held liable for any actions you take as a result of anything you read here.
Conduct your own due diligence, or consult a licensed financial advisor or broker before making any and all investment decisions. Any investments, trades, speculations, or decisions made on the basis of any information found on this channel, expressed or implied herein, are committed at your own risk, financial or otherwise.

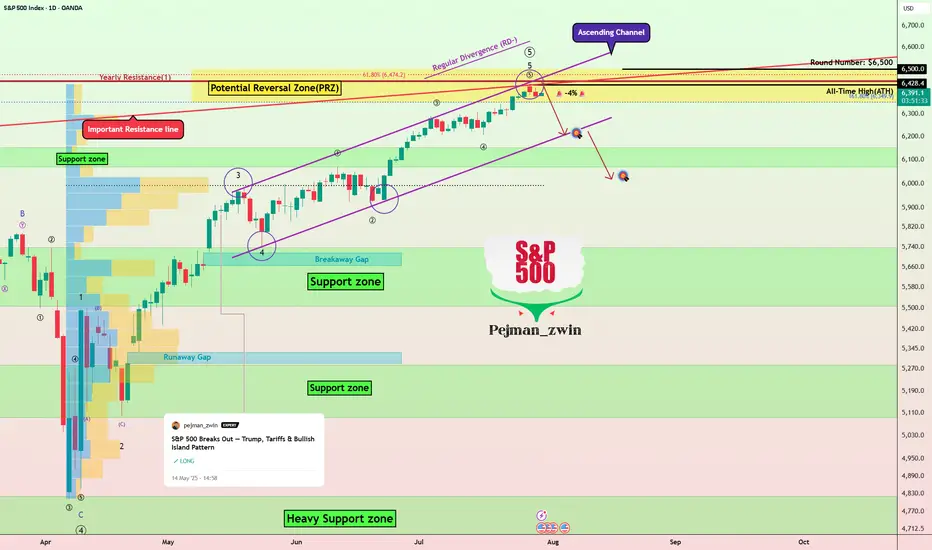
S&P500’s Bullish Island Turns Risky: Elliott Wave Says “Top”The S&P500 Index( SP:SPX ) started to rise and even created a new All-Time High(ATH=$6,428) with the help of the Bullish Long Island Pattern , as I published in my previous idea on May 14, 2025 .
The S&P500 Index is currently moving near the Potential Reversal Zone(PRZ) , upper line of the ascending channel , the Important Resistance line , and the Yearly Resistance(1) .
In terms of Elliott Wave theory , the S&P500 Index appears to be completing microwave 5 of microwave 5 of the main wave 5 .
Also, we can see the Regular Divergence(RD-) between Consecutive Peaks .
I expect the S&P500 Index to correct at least -4% and fall to the lower line of the ascending channel .
First Target: $6,233
Second Target: $6,033
Note: Stop Loss(SL) $6,513
Do you think S&P500 Index can create a new ATH above $6,500 !?
Please respect each other's ideas and express them politely if you agree or disagree.
S&P 500 Index Analyze (SPX500USD), Daily time frame.
Be sure to follow the updated ideas.
Do not forget to put a Stop loss for your positions (For every position you want to open).
Please follow your strategy and updates; this is just my Idea, and I will gladly see your ideas in this post.
Please do not forget the ✅' like '✅ button 🙏😊 & Share it with your friends; thanks, and Trade safe.
Rob the Rally SPX500: Enter Before Resistance Catches You🦹♂️💎 “SPX500 Vault Breach – Layered Robbery in Progress!” 💼📈
(Thief Trader's Multi-Limit Entry Bullish Blueprint – No Mercy, Just Money)
📍Asset: SPX500 / US500
🎯Plan: Bullish Heist
🧠Style: Layered Limit Orders | Thief Strategy Entry | Zero Mercy Execution
📈Target: 6600.00
🛑Stop Loss: 6200.00
💣Entry: Any level — thieves adapt, not wait!
🌍 Welcome to the Global Robbery Room, Traders!
It’s your boy Thief Trader, back in the vault with another plan to crack the SPX500 like a safe on Wall Street. This one’s for the bold bulls who like to rob with precision, not permission. 🎯💰
💼 The Setup – High Stakes, High Floors
SPX500 is lining up for a classic breakout breach. This isn’t just technical — it’s tactical warfare. Market noise? Ignore it. We operate on strategy and steel nerves. 🧠🔫
🔥 Entry Protocol – Layer Up or Miss Out
🧱 Multiple limit orders across price zones — like planting C4 charges on every door.
🎯 Enter wherever price dips — don’t wait for permission from retail traders.
🎯 No fixed entry — this is Thief Layering: get in where you fit in.
🚪 Escape Plan – Stop Loss Strategy
📍 SL: 6200.00
Why? That’s where the guards start showing up. If price drops below, we vanish.
💡 Be flexible — smart robbers don’t get caught, they regroup.
💎 Target Loot – The Golden Zone
📍 Primary TP: 6600.00
Once we breach the 6500+ resistance, it's a moonwalk. Lock gains or trail with confidence.
📢 Warning for Scalpers & Swing Thieves Alike:
Only play Long-side. Don’t try to rob both ends — that’s suicide.
Big wallet? Scale heavy. Small bag? Layer light but tight.
Always use trailing stops — never trust the market with your escape bag. 🎒💸
📊 Thief Intel – Why We’re Bullish
✅ Index rotation favors large-cap strength
✅ Macro sentiment + institutional bias points UP
✅ No bearish COT signals in sight
✅ Fed tone & economic backdrop: neutral to supportive
This isn’t hopium. It’s strategy.
🚨 NEWS FLASH – Stay Stealthy!
Do NOT enter during economic bombs 💣 (NFP, CPI, Fed minutes, etc.)
Market noise kills precision. We only move in silence and with SLs trailing tight.
💬 Smash that BOOST 💖 if you’re riding with the Thief Army.
Share this plan, spread the word, and let’s rob the markets the smart way.
📢 Tag your crew, stack your layers, and let’s hit 6600 like pros.
📌Disclaimer: Not financial advice — this is a market operation plan for educational use. Trade at your own risk. Smart thieves plan exits before entries. 💼📉📈
🦹♂️ Thief Trader out.
💸 Rob smart. Rob clean. Rob global.

$SPX Analysis, Key Levels & Targets 8.4.25
Today’s Trading Range - we have a great range expansion here from last Friday’s drop. Some interesting targets here. Let me know what you see.

Potential bearish drop?S&P500 is rising towards the pivot, which is a pullback resistance that aligns with the 61.8% Fibonacci retracement and could drop to the 1st support.
Pivot: 6,362.20
1st Support: 6,214.78
1st Resistance: 6,436.72
Risk Warning:
Trading Forex and CFDs carries a high level of risk to your capital and you should only trade with money you can afford to lose. Trading Forex and CFDs may not be suitable for all investors, so please ensure that you fully understand the risks involved and seek independent advice if necessary.
Disclaimer:
The above opinions given constitute general market commentary, and do not constitute the opinion or advice of IC Markets or any form of personal or investment advice.
Any opinions, news, research, analyses, prices, other information, or links to third-party sites contained on this website are provided on an "as-is" basis, are intended only to be informative, is not an advice nor a recommendation, nor research, or a record of our trading prices, or an offer of, or solicitation for a transaction in any financial instrument and thus should not be treated as such. The information provided does not involve any specific investment objectives, financial situation and needs of any specific person who may receive it. Please be aware, that past performance is not a reliable indicator of future performance and/or results. Past Performance or Forward-looking scenarios based upon the reasonable beliefs of the third-party provider are not a guarantee of future performance. Actual results may differ materially from those anticipated in forward-looking or past performance statements. IC Markets makes no representation or warranty and assumes no liability as to the accuracy or completeness of the information provided, nor any loss arising from any investment based on a recommendation, forecast or any information supplied by any third-party.

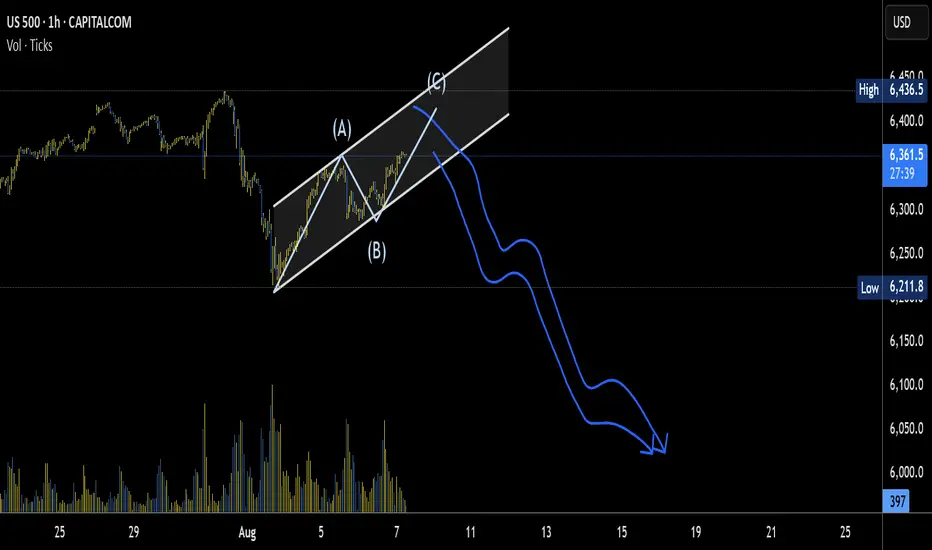
US 500 road mapus 500 could be ready for a major c leg down. looking for a significant entry signal down
Possible return of the stock market downtrend.After a sharp drop due to last week's news, the S\&P stock index is now at a critical point.
Given the strong bullish trend it had previously, there’s a possibility we might see a return to the uptrend this week.

JP Morgan warns the S&P is due a retracement!🚨 Alert 🚨
JP Morgan and Deutsche Bank are the latest to warn that the S&P is due for a correction.
I'm short with a small position size, as the price could move higher yet... Judging by experience, it's near impossible to predict tops. It's best to close long positions or enter smaller-sized short positions with large stops.
VANTAGE:SP500 PEPPERSTONE:US500 ICMARKETS:US500 OANDA:SPX500USD

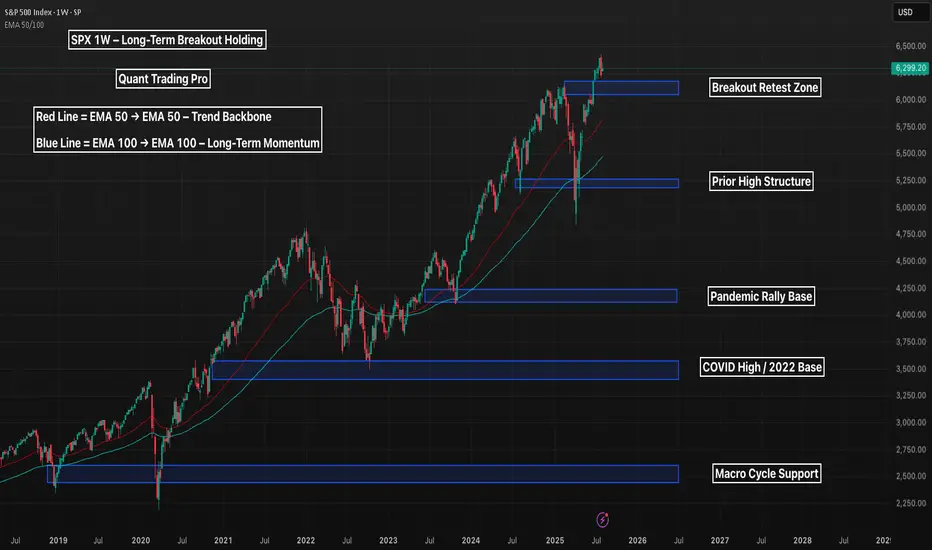
SPX 1W – Long-Term Breakout Holding, Can the Rally Sustain?The S&P 500 just printed a weekly breakout above historical highs, tapping into uncharted territory above 6,300 — but now the question is whether the trend can sustain or if a deeper retest is on the horizon.
🔹 Macro Structure
Multiple clean support levels exist below, each marking prior macro pivots — from the 2020 breakout to the 2022 base.
The most immediate zone of interest is 6,100–6,200, which could act as a bullish retest zone if this breakout is valid.
Deeper downside remains structurally healthy unless 4,250 or below is breached.
🔹 Trend Health
Price remains well above the EMA 50 and 100, showing no signs of structural weakness.
Pullbacks into the EMAs historically triggered trend continuation — and bulls will likely treat those zones as reload points.
🔹 Big Picture
As long as SPX holds above 5,400, the macro bull trend remains intact.
A drop to retest lower zones wouldn’t necessarily break the uptrend — but it would shake sentiment and invite reaccumulation.
Is this the beginning of a new macro leg — or the last shake before a deeper correction?
Let’s chart it out 👇
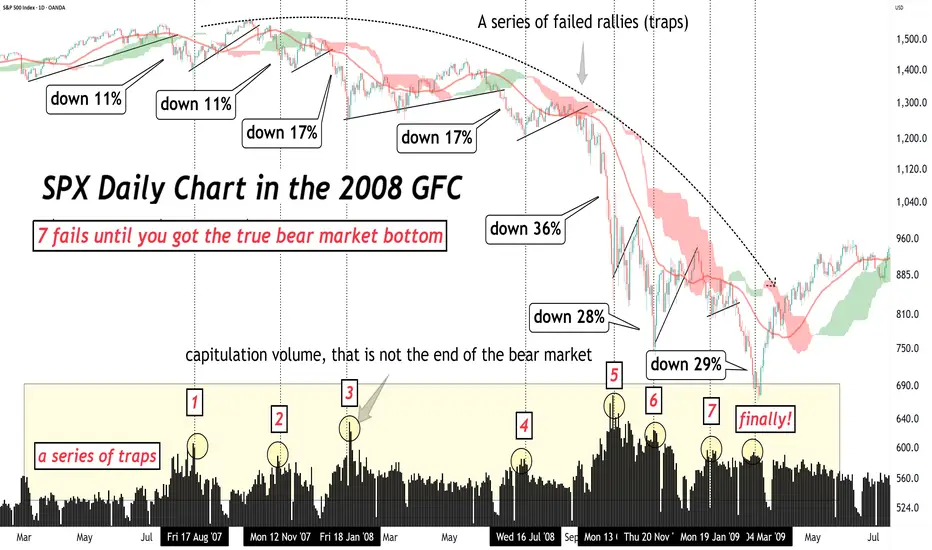
The worst drops often come later!Don’t be fooled by the first crash… The worst drops often come later in a bear market.
Let’s break down the brutal truth about the 2008 GFC and what it teaches us today. 🧵
1.
In the 2007–2009 bear market, the S&P 500 had 7 failed rallies before finally bottoming.
Every bounce looked like the bottom — and every one was a trap.
👇
2.
The early drops were steep:
🔻 Down 11%
🔻 Down 17%
But the most violent crashes came after those…
Near the END — not the beginning — of the bear market.
3.
Later stage declines:
❌ Down 28%
❌ Down 36%
❌ Down 29%
That’s when capitulation kicked in.
Investors gave up. Fear took over.
4.
Capitulation volume isn’t a guaranteed bottom.
It feels like it’s over.
But if fundamentals haven’t turned and the trend isn’t broken, the bear can still bite — hard.
5.
Final crashes are like cliffs:
Markets are exhausted.
Hope is crushed.
And that’s finally when the real bottom shows up.
6.
The lesson?
Bear markets are full of traps.
Relief rallies can fool even seasoned pros.
Stay patient. Wait for trend confirmation. Don’t chase fake bottoms.
7.
📉 The biggest crashes usually happen at the end of the bear market.
That’s the final flush — and it sets the stage for true opportunity.
Learn from the past. Don’t get trapped. Stay sharp.
The $CURE For Your Healthcare PortfolioHey team,
Everyone knows how the health sector is beat up.
The Trump administration hasn't shown any mercy to the health and pharma sectors. They’ve been hammering Big Pharma with a mix of fiery rhetoric and aggressive policy moves. Trump has brought back his “most favored nation” drug pricing plan, tying Medicare reimbursements to what other countries pay, slashing profits for drugmakers who’ve been charging Americans a fortune.
As a result, some of the top health stocks such as NYSE:PFE , NYSE:LLY , NYSE:JNJ , and NYSE:UNH , among many others, have been suffering.
We need, however, to understand that healthcare is sometimes cyclical, and there are some clues that tell us what's likely to happen next:
For most years, AMEX:XLV (health index ETF) is highly correlated with the $SP:SPX. Historically, when this correlation breaks, it's either because healthcare is lagging behind the S&P 500, or because the S&P 500 is crashing, and healthcare is holding well because healthcare is recession-resistant. Typically, these moments of uncorrelation are followed by a very well-performing healthcare sector.
AMEX:XLV / SP:SPX is now at a 25-year low! Healthcare stocks have never been so low in 25 years compared to the benchmark.
While the S&P P/E ratio is at 28, healthcare is at 14. This shows a potentially underdeveloped sector.
The spread between healthcare and the rest of the stock market is very large and unnatural. Considering this, it's more likely that it will regress to its mean and recover. You can see this in the Dual Z-Score indicator in the chart.
Additionally, the US midterms are coming, which can bring policy changes that might favor healthcare again.
Now, you might be wondering: Why invest in AMEX:CURE and not in AMEX:XLV ?
I plan to allocate around 2% of my portfolio to CURE, the 3x leveraged ETF, because it's an easier way to achieve the proper Kelly allocation to this sector, a sector that I believe will recover over the next couple of years. The leverage provided by this ETF will help compound returns.
Is this strategy risky?
Well, CURE is 3x more volatile than XLV, but this is the way I see it: healthcare is already too beat up to continue declining sharply from here. Additionally, healthcare is recession-resistant, meaning that it should not be too affected if the US economy suffers, enters a recession, or if unemployment numbers increase.
I think CURE gives me a potentially good risk/reward ratio, considering that if healthcare catches up with the S&P 500, CURE could return approximately (and very roughly) 100%.
Quick note: I'm just sharing my journey - not financial advice! 😊

SP500 reinforcing a bearish short-term trendThe S&P 500 retreated in the final session of July, weighed down by renewed tariff concerns and ongoing uncertainty surrounding the Fed’s next policy move. Despite the late pullback, the index remains positive for the month overall.
From a technical perspective, the index has declined approximately 2.5% since yesterday, reinforcing a bearish short-term trend. The bearish outlook remains valid as long as the price stays below 6220.
Immediate Support: 6220 – A break below this level could lead to further downside. Next Downside Target: 6150 – If the bearish momentum continues past 6220. if price closes above this, 6250 short-term bullish momentum may build. 6300 – A major resistance; a close above this would invalidate the current bearish outlook.
we have Some Tips about SO500 But Trading range is small Traders.
Ps; Support with like and comments for more analysis.

S&P 500 extends drop - can dip buyers come to rescue again?After a decent rally earlier in the day, the major indices and futures started to ease off around mid-morning London trade, before easing further lower in the last couple of hours.
At the time of writing, the S&P was testing its session lows. Here it was probing support and a short-term bullish trend line in the 6319-6331 range. This area needs to hold to keep the bulls happy and in charge. Break this and we could see a bigger correction in the days ahead.
Resistance now comes in at 6372 followed by 6,400.
By Fawad Razaqzada, markets analyst with FOREX>com

SHORT ON SPX/USDSpy has created a Double top followed by a CHOC and retest to the downside.
Their is plenty sell side liquidity to be collected as I expect a major drop on spy.
Looking to catch 300-400 points on SPY.